. 2017 Feb 7;25(2):358-373.
doi: 10.1016/j.cmet.2016.12.010. Epub 2017 Jan 12.

Prevention of Dietary-Fat-Fueled Ketogenesis Attenuates BRAF V600E Tumor Growth

Affiliations

Prevention of Dietary-Fat-Fueled Ketogenesis Attenuates BRAF V600E Tumor Growth

Siyuan Xia et al. Cell Metab. .

Abstract

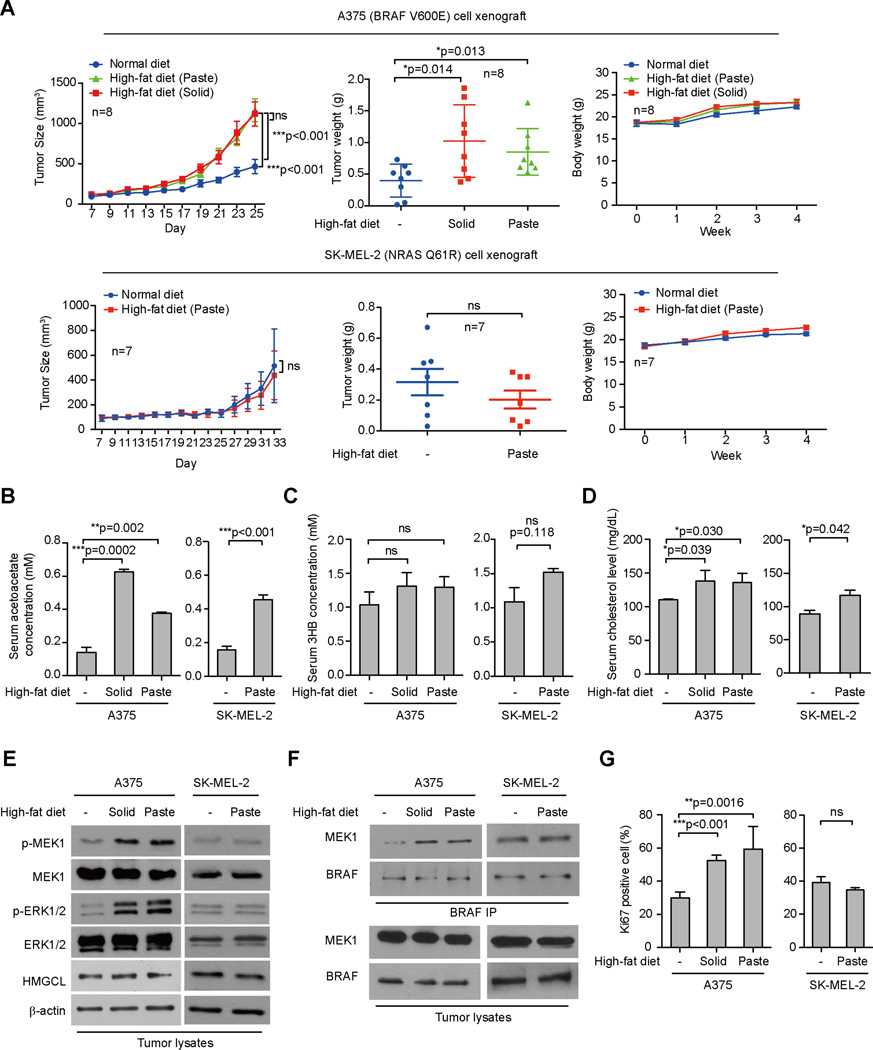
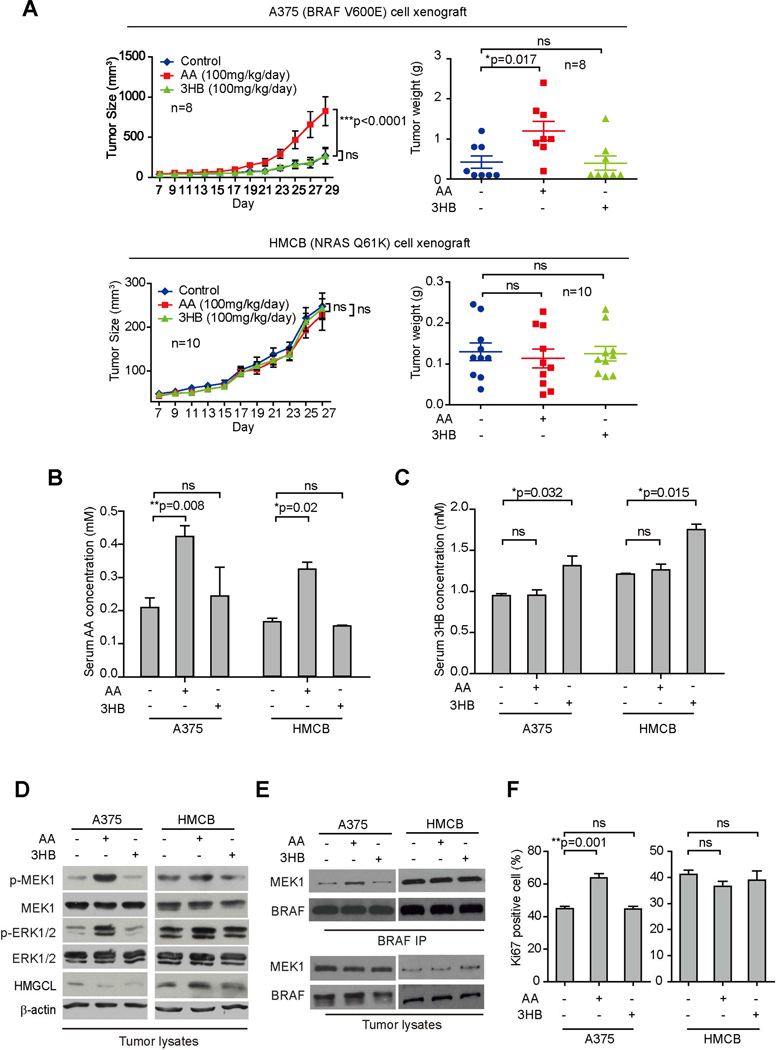
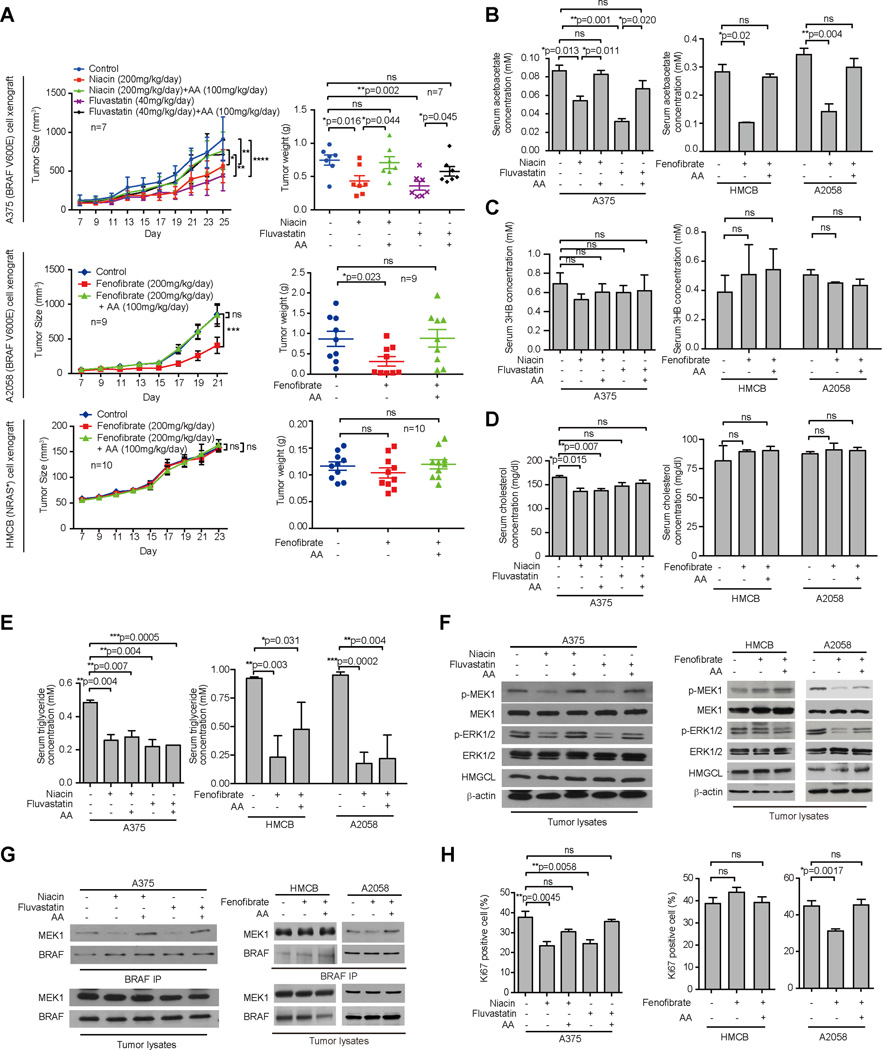
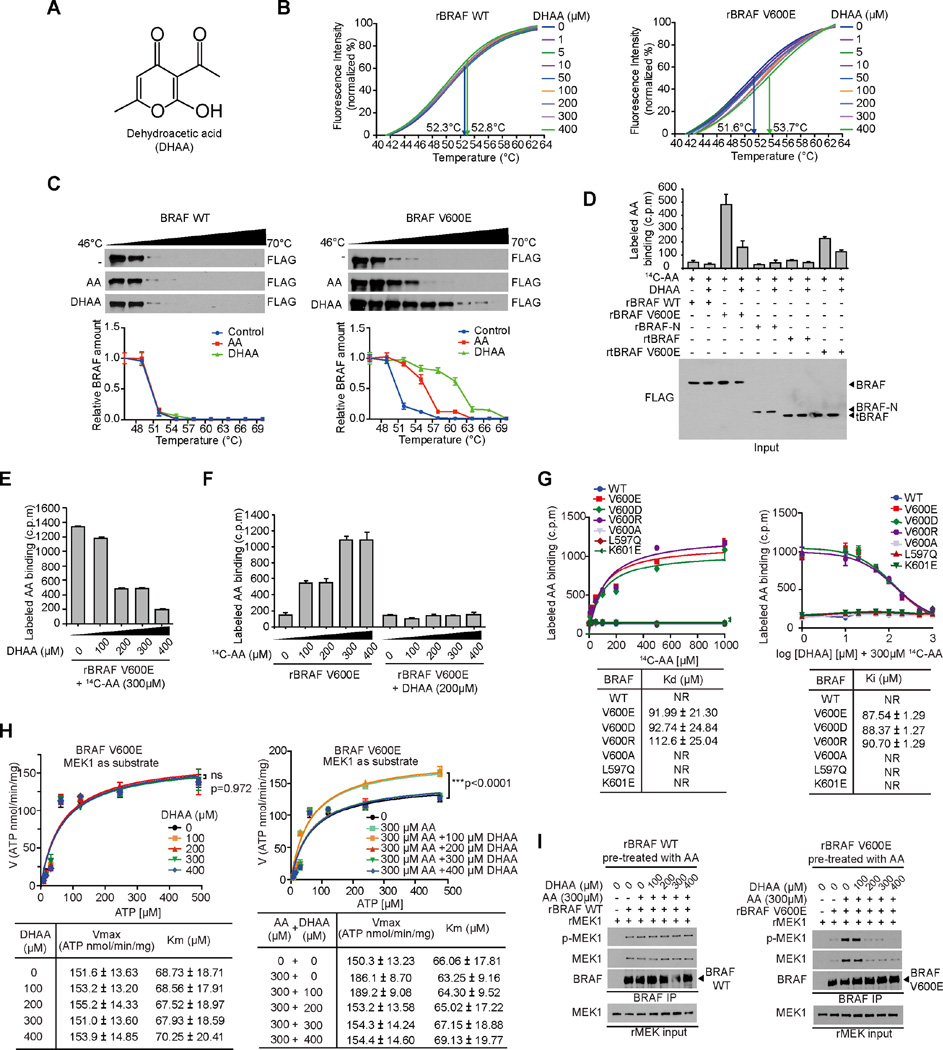
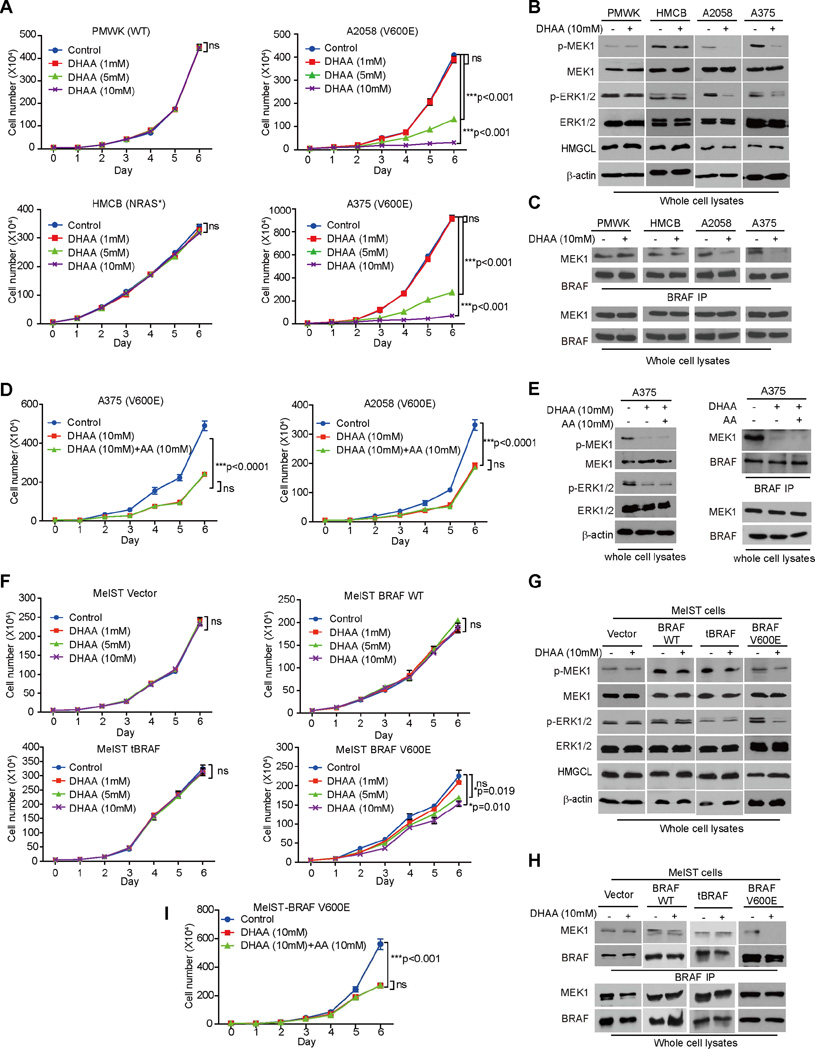
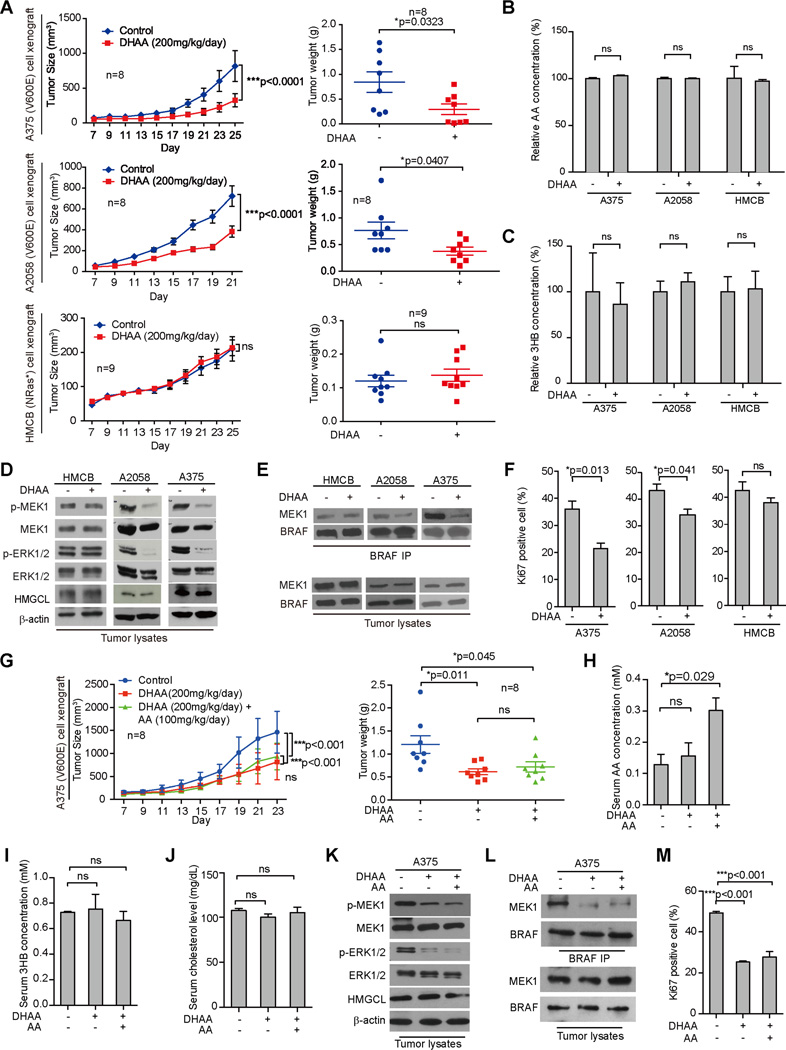
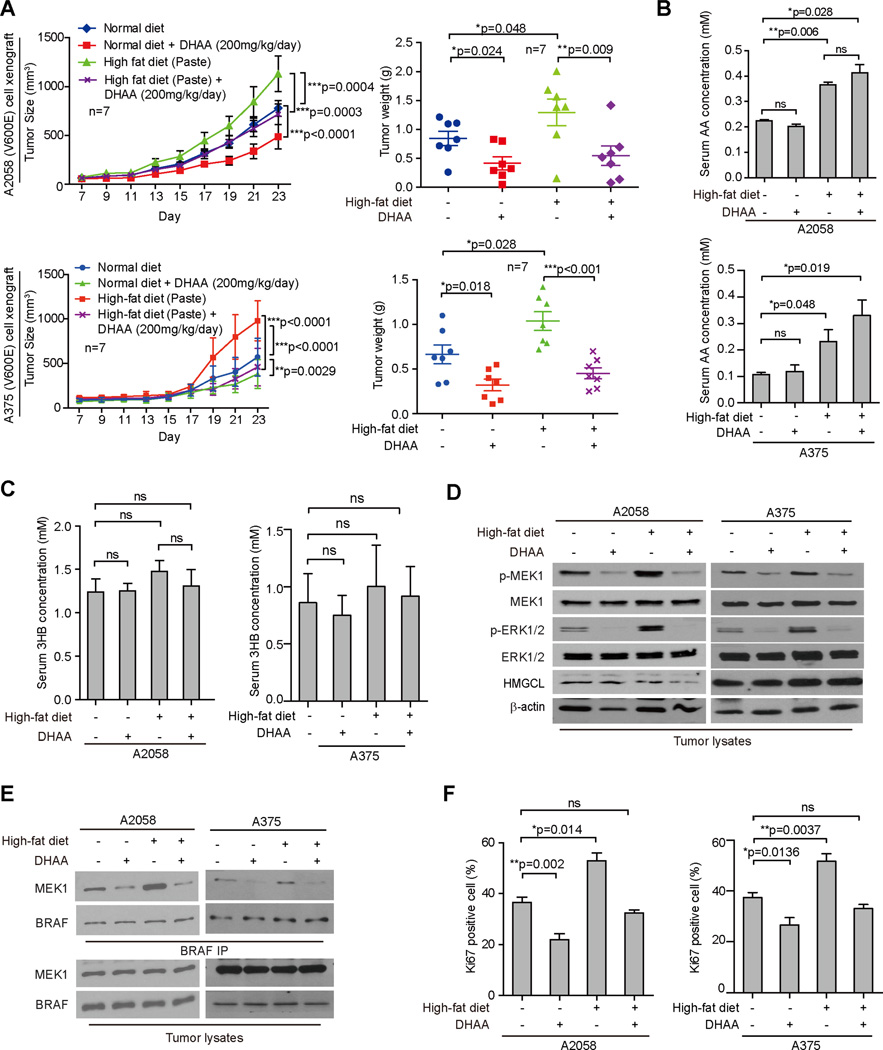
Lifestyle factors, including diet, play an important role in the survival of cancer patients. However, the molecular mechanisms underlying pathogenic links between diet and particular oncogenic mutations in human cancers remain unclear. We recently reported that the ketone body acetoacetate selectively enhances BRAF V600E mutant-dependent MEK1 activation in human cancers. Here we show that a high-fat ketogenic diet increased serum levels of acetoacetate, leading to enhanced tumor growth potential of BRAF V600E-expressing human melanoma cells in xenograft mice. Treatment with hypolipidemic agents to lower circulating acetoacetate levels or an inhibitory homolog of acetoacetate, dehydroacetic acid, to antagonize acetoacetate-BRAF V600E binding attenuated BRAF V600E tumor growth. These findings reveal a signaling basis underlying a pathogenic role of dietary fat in BRAF V600E-expressing melanoma, providing insights into the design of conceptualized "precision diets" that may prevent or delay tumor progression based on an individual's specific oncogenic mutation profile.

Keywords: BRAF V600E; acetoacetate; cancer metabolism; cancer prevention; cancer risk; cancer therapy; dehydroacetic acid; dietary fat; ketogenesis; precision diet.


Figures

Figure 1
Figure 1. High-fat diet selectively promotes tumor growth potential of BRAF V600E-positive melanoma cells in xenograft nude mice
(A) Tumor growth (left), weight (middle) and body weight (right) of xenograft nude mice injected with human melanoma BRAF V600E-positive A375 (upper panels), or SK-MEL-2 cells (NRAS Q61K; lower panels) that were fed with normal diet, or different high-fat diets. Data are mean ± SEM for tumor growth and mean ± s.d. for tumor weight; p values were obtained by a two-way ANOVA test for tumor growth rates and a two-tailed Student’s t test for tumor masses. (B–D) Acetoacetate (AA; B), β-hydroxybutyrate (3HB; C), and cholesterol (D) levels in serum harvested from A375 and SK-MEL-2 xenograft mice fed with normal or different high-fat diets. Data are mean ± s.d.; n=3; p values were obtained by a two-tailed Student’s t test. (E–F) Western blot results show MEK1 and ERK1/2 phosphorylation (E) and BRAF-MEK1 binding (F) in tumor tissue samples obtained from xenograft mice. (G) Summarized results of immunohistochemical (IHC) staining assay detecting Ki67-positive cells in tumor tissue samples from A375 and SK-MEL-2 xenograft mice. Data are mean ± s.d.; p values were obtained by a two-tailed Student’s t test. Also see Figure S1.
Figure 2
Figure 2. Intraperitoneally injected acetoacetate selectively promotes BRAF V600E-positive melanoma tumor growth
(A) Tumor growth (left) and weight (right) of xenograft nude mice injected with human melanoma BRAF V600E-positive A375 (upper panels) or HMCB (NRAS Q61K; lower panels) cells that were intraperitoneally injected with AA or 3HB. Data are mean ± SEM for tumor growth and mean ± s.d. for tumor weight; p values were obtained by a two-way ANOVA test for tumor growth rates and a two-tailed Student’s t test for tumor masses. (B–C) AA (B) and 3HB (C) levels in serum harvested from A375 and HMCB xenograft mice treated with AA or 3HB. Data are mean ± s.d.; n=3; p values were obtained by a two-tailed Student’s t test. (D–E) Western blot results show MEK1 and ERK1/2 phosphorylation (D) and BRAF-MEK1 binding (E) in tumor tissue samples obtained from xenograft mice. (F) Summarized results of IHC staining assay detecting Ki67-positive cells in tumor tissue samples from xenograft mice. Data are mean ± s.d.; p values were obtained by a two-tailed Student’s t test. Also see Figure S2 and S3.
Figure 3
Figure 3. Lipid lowering agents decrease serum acetoacetate levels in xenograft mice and reduce VRAF V600E tumor growth
(A) Tumor growth (left) and weight (right) of xenograft nude mice injected with human melanoma BRAF V600E-positive A375 cells (upper panels) that were orally treated with two different lipid lowering agents Niacin or Fluvastatin alone or in combination with intraperitoneal injection with acetoacetate (AA); Tumor growth (left) and weight (right) of xenograft nude mice injected with human melanoma BRAF V600E-positive A2058 (middle) cells or HMCB (NRAS Q61K; lower panels) cells that were orally treated with lipid lowering agent Fenofibrate alone or in combination with intraperitoneal injection with AA. Data are mean ± SEM for tumor growth and mean ± s.d. for tumor weight; p values were obtained by a two-way ANOVA test for tumor growth rates and a two-tailed Student’s t test for tumor masses. (B–E) AA(B), 3HB (C), cholesterol (D), and triglyceride (E) levels in serum harvested from A375, A2058 and HMCB xenograft mice tissue. Data are mean ± s.d.; n=3; p values were obtained by a two-tailed Student’s t test. (F–G) Western blot results show MEK1 and ERK1/2 phosphorylation (F) and BRAF-MEK1 binding (G) in tumor tissue samples obtained from xenograft mice tissue. (H) Summarized results of IHC staining assay detecting Ki67-positive cells in tumor tissue samples from xenograft mice. Data are mean ± s.d.; n=3; p values were obtained by a two-tailed Student’s t test. Also see Figures S4.
Figure 4
Figure 4. Dehydroacetic acid competes with acetoacetate for BRAF V600E binding and antagonizes acetoacetate-enhanced V600E-MEK1 association
(A) Chemical structure formula of dehydroacetic acid (DHAA). (B) Thermal melt shift assay was performed to examine the protein (BRAF WT or BRAF V600E; left and right panel, respectively) and ligand (DHAA) interaction. Arrows in each panel indicate melting temperatures at 0 µM (left) and 400 µM (right). (C) Intracellular thermal melt shift assay was performed to examine the protein (BRAF WT or BRAF V600E; left and right panel, respectively) and ligand (AA or DHAA) interaction. (D) Radiometric metabolite-protein interaction analysis using 14C-labeled acetoacetate incubated with purified BRAF variants, followed by treatment with DHAA. Data are mean ± s.d.; n=3 each; p values were obtained by a two-tailed Student’s t test. (E–F) Radiometric metabolite-protein interaction analysis using purified recombinant BRAF V600E (rBRAF V600E) pre-treated with 14C-labeled acetoacetate incubated with increasing concentrations of DHAA (E), or rBRAF V600E pre-treated with DHAA incubated with increasing concentrations of 14C-labeled acetoacetate (F). Data are mean ± s.d.; n=3 each; p values were obtained by a two-tailed Student’s t test. (G) Kd values (left) were determined by 14C-labeled acetoacetate binding assay. BRAF wild type and mutant proteins were incubated with increasing concentrations of 14C-labeled acetoacetate. Effect of increasing concentrations of DHAA on 14C-labeled acetoacetate binding to BRAF mutant proteins (right panels). (H) Vmax and Km of BRAF V600E were measured using purified BRAF V600E protein incubated with increasing concentrations of ATP in the presence and absence of increasing concentration of AA (left panel) or increasing concentration of DHAA with 300 µM AA (right panel), using excessive amount of purified MEK1 as substrates. Data are mean ± s.d.; n = 3 each; p values were obtained by a two-tailed Student’s t test. (I) Effect of increasing concentrations of DHAA on AA-enhanced rBRAF WT or rBRAF V600E binding to purified recombinant MEK1 (rMEK1). Also see Figure S5.
Figure 5
Figure 5. DHAA selectively inhibits BRAF V600E-positive melanoma cell proliferation
(A–C) Effect of DHAA treatment on cell proliferation rates (A), MEK1 and ERK1/2 phosphorylation (B) and BRAF-MEK1 binding (C) of melanoma PMWK, HMCB, A2058 and A375 cells. Data are mean ± s.d.; p values were obtained by a two-tailed Student’s t test. (D–F) Effect of DHAA with or without AA treatment on cell proliferation rates (D), MEK1 and ERK1/2 phosphorylation (E), and BRAF-MEK1 binding (F) of melanoma BRAF-V600E positive A2058 and A375 cells. Data are mean ± s.d.; p values were obtained by a two-tailed Student’s t test. (G–I) Effect of DHAA treatment on cell proliferation rates (G), MEK1 and ERK1/2 phosphorylation (H) and BRAF-MEK1 binding (I) of Mel-ST cells stably expressing BRAF WT, BRAF V600E or a truncated, constitutively active form of BRAF (tBRAF). Data are mean ± s.d.; p values were obtained by a two-tailed Student’s t test. (I) Effect of DHAA with or without AA rescue treatment on cell proliferation rates Mel-ST cells stably expressing BRAF V600E. Data are mean ± s.d.; p values were obtained by a two-tailed Student’s t test. Also see Figures S5.
Figure 6
Figure 6. DHAA attenuates BRAF V600E tumor growth in xenograft nude mice
(A) Tumor growth (left) and weight (right) of xenograft nude mice injected with human melanoma BRAF V600E-positive A375 (upper panels) or A2058 (middle panels) and HMCB (NRAS Q61K; lower panels) cells were intraperitoneally injected with DHAA. Data are mean ± SEM for tumor growth and mean ± s.d. for tumor weight; p values were obtained by a two-way anova test and two-tailed Student’s t test. (B–C) AA (B) and 3HB (C) levels in tumor samples obtained from xenograft mice. Data are mean ± s.d.; n=3; p values were obtained by a two-tailed Student’s t test. (D–E) Western blot results assessing MEK1 and ERK1/2 phosphorylation (D) and BRAF-MEK1 binding (E) in tumor tissue samples obtained from xenograft mice. (F) Summarized results of IHC staining assay detecting Ki67-positive cells in tumor tissue samples from xenograft mice. Data are mean ± s.d.; p values were obtained by a two-tailed Student’s t test. (G) Tumor growth (left) and weight (right) of xenograft nude mice injected with A375 were intraperitoneally injected with DHAA in the absence or presence of AA. Data are mean ± SEM for tumor growth and mean ± s.d. for tumor weight; p values were obtained by a two-way anova test and two-tailed Student’s t test. (H–J) AA (H), 3HB (I) and cholesterol (J) levels in tumor samples obtained from xenograft mice shown in (G). Data are mean ± s.d.; n=3; p values were obtained by a two-tailed Student’s t test. (K–L) Western blot results assessing MEK1 and ERK1/2 phosphorylation (K) and BRAF-MEK1 binding (L) in tumor tissue samples obtained from xenograft mice shown in (G). (H) Summarized results of IHC staining assay detecting Ki67-positive cells in tumor tissue samples from xenograft mice shown in (G). Data are mean ± s.d.; p values were obtained by a two-tailed Student’s t test. Also see Figure S6
Figure 7
Figure 7. DHAA treatment reverses high-fat enhanced BRAF V600E tumor growth in xenograft nude mice
(A) Tumor growth (left) and weight (right) of xenograft nude mice injected with BRAF V600E-positive human melanoma A375 (upper panels) an A2058 (bottom panels) cells that were fed with normal or high-fat diets followed by intraperitoneal injection with DHAA. Data are mean ± SEM for tumor growth and mean ± s.d. for tumor weight; p values were obtained by a two-way ANOVA test. (B–C) AA (B) and 3HB (C) levels in serum harvested from xenograft mice. Data are mean ± s.d.; n=3; p values were obtained by a two-way ANOVA test for tumor growth rates and a two-tailed Student’s t test for tumor masses. (D–E) Western blot results assessing MEK1 and ERK1/2 phosphorylation (D) and BRAF-MEK1 binding (E) in tumor tissue samples obtained from xenograft mice. (F) Summarized results of IHC staining assay detecting Ki67-positive cells in tumor tissue samples from xenograft mice. Data are mean ± s.d.; p values were obtained by a two-tailed Student’s t test. Also see Figure S7.

References

    1. Amjadi F, Javanmard SH, Zarkesh-Esfahani H, Khazaei M, Narimani M. Leptin promotes melanoma tumor growth in mice related to increasing circulating endothelial progenitor cells numbers and plasma NO production. J Exp Clin Cancer Res. 2011;30:21. - PMC - PubMed
    1. Antoniadis AG, Petridou ET, Antonopoulos CN, Dessypris N, Panagopoulou P, Chamberland JP, Adami HO, Gogas H, Mantzoros CS. Insulin resistance in relation to melanoma risk. Melanoma Res. 2011;21:541–546. - PubMed
    1. Arcaini L, Zibellini S, Boveri E, Riboni R, Rattotti S, Varettoni M, Guerrera ML, Lucioni M, Tenore A, Merli M, Rizzi S, Morello L, Cavalloni C, Da Via MC, Paulli M, Cazzola M. The BRAF V600E mutation in hairy cell leukemia and other mature B-cell neoplasms. Blood. 2012;119:188–191. - PubMed
    1. Avis HJ, Vissers MN, Stein EA, Wijburg FA, Trip MD, Kastelein JJ, Hutten BA. A systematic review and meta-analysis of statin therapy in children with familial hypercholesterolemia. Arterioscler Thromb Vasc Biol. 2007;27:1803–1810. - PubMed
    1. Balasse EO, Fery F. Ketone body production and disposal: effects of fasting, diabetes, and exercise. Diabetes Metab Rev. 1989;5:247–270. - PubMed

Publication types

MeSH terms