. 2017 Feb 13;31(2):270-285.
doi: 10.1016/j.ccell.2016.12.005. Epub 2017 Jan 12.

MYC Drives Progression of Small Cell Lung Cancer to a Variant Neuroendocrine Subtype with Vulnerability to Aurora Kinase Inhibition

Affiliations

MYC Drives Progression of Small Cell Lung Cancer to a Variant Neuroendocrine Subtype with Vulnerability to Aurora Kinase Inhibition

Gurkan Mollaoglu et al. Cancer Cell. .

Abstract

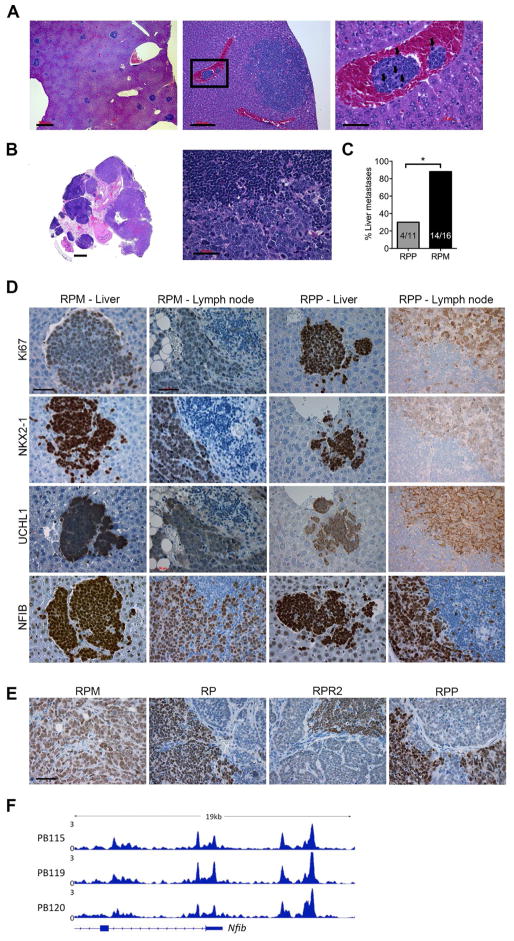
Loss of the tumor suppressors RB1 and TP53 and MYC amplification are frequent oncogenic events in small cell lung cancer (SCLC). We show that Myc expression cooperates with Rb1 and Trp53 loss in the mouse lung to promote aggressive, highly metastatic tumors, that are initially sensitive to chemotherapy followed by relapse, similar to human SCLC. Importantly, MYC drives a neuroendocrine-low "variant" subset of SCLC with high NEUROD1 expression corresponding to transcriptional profiles of human SCLC. Targeted drug screening reveals that SCLC with high MYC expression is vulnerable to Aurora kinase inhibition, which, combined with chemotherapy, strongly suppresses tumor progression and increases survival. These data identify molecular features for patient stratification and uncover a potential targeted treatment approach for MYC-driven SCLC.

Keywords: ASCL1; Aurora kinase inhibitor; MYC; NEUROD1; chemotherapy; genetically engineered mouse model; neuroendocrine; small-cell lung cancer.


Figures

Figure 1
Figure 1. MYC promotes rapid SCLC in cooperation with Rb1 and Trp53 loss
(A) Survival of mice infected with 108 plaque-forming units (PFU) of Cgrp-Cre. Log-rank (Mantel-Cox) test indicated. (B) Representative bioluminescent imaging of uninfected (- Cre) or Cgrp-Cre infected (+ Cre) RPM mice at 69 days post-infection with 106 PFU virus. Units represent relative light units. (C) Brightfield image of dissected lung from RPM mouse with tumor in the airway (indicated by black arrow) at 8 weeks post-infection. (D) 3D rendering of microCT data with lungs in gray, tumor in red and major airways in blue. (E) MicroCT images in indicated planes from WT or RPM mice at 39 (RPM-1) and 44 (RPM-2) days post-108 PFU Cgrp-Cre. The red line surrounds the heart. (F-I) Representative RPM lung hematoxylin and eosin (H&E) images: Sections derived from 3 weeks post-infection (F), scale bar is 1 mm; 7 weeks post-infection with perivascular and perilymphatic spread (G), scale bar is 250 μm; classic morphology (H) and variant morphology (I), scale bars are 50 μm. (J–L) IHC (J) and manual quantification of pHH3 (K) or CC3 (L) in indicated tumor models. Scale bars are 50 μm. Error bars indicate mean ± standard error of the mean (SEM). Two-tailed unpaired t tests, **** p < 0.0001; *** p = 0.001. See also Figure S1.
Figure 2
Figure 2. MYC promotes neuroendocrine-low SCLC with NEUROD1 expression in vivo
(A) Hierarchical cluster analysis of NE markers from mouse tumors by expression array (indicated by #) or RNA-seq. (B) Expression of Ascl1 and Neurod1 in mouse lung tumors. Proportions of Myc high samples are indicated by pie charts. (C) GSEA analysis from RPM vs. RPR2 tumors with normalized enrichment scores (NES) and p values for NEUROD1high and ASCL1high signatures. (D) IHC and automated quantification for ASCL1 and NEUROD1 in the indicated models. Scale bars are 50 μm. Error bars indicate mean ± SEM. Two-tailed unpaired t tests, **** p < 0.0001, * p < 0.01; ns = not significant. (E) Immunoblot of mouse lung tumor lysates with NEUROD1 antibodies from the indicated source; HSP90 is loading control. Control human SCLC cell lines are H1963 (−) and H82 (+). See also Figure S2 and Table S1.
Figure 3
Figure 3. RPM tumors recapitulate molecular subset of MYC high human SCLC
(A) Unsupervised hierarchical cluster analysis of NE markers from human SCLC patient samples and cell lines by RNA-seq. MYC expression, type of sample, and origin of data set indicated above the heatmap. (B) Expression of ASCL1 and NEUROD1 in human SCLCs and cell lines (grouped by NE marker expression according to A). Proportions of MYC high vs. MYC low samples are indicated by pie charts. Two-tailed unpaired t tests, **** p < 0.0001; *** p < 0.001; ns = not significant. (C) GSEA analysis from MYC high or MYC low human SCLC with NES and p values for NEUROD1high and ASCL1high signatures. (D) IHC serial sections from RPM lung tumor samples from in situ and invasive lesions stained with indicated antibodies (left). Tumors were grouped based on automated quantification of IHC staining as high or low for ASCL1 or NEUROD1. Proportions of tumors with each pattern (n = 26 in situ lesions; n = 41 invasive lesions) are indicated (right). Scale bars are 50 μm. See also Figure S3.
Figure 4
Figure 4. MYC-driven tumors are highly metastatic similar to the human disease
(A) Representative H&E stains of metastatic liver lesions from RPM mice. Area in black box of middle panel is magnified in right panel. Black arrows indicate mitotic figures in the blood vessel. Scale bars in panels from left to right are: 500, 200 and 50 μm. (B) H&E image of mediastinal lymph node metastases from RPM mice. Scale bars are 1 mm (left) and 50 μm (right). (C) Percentage of mice with liver metastases analyzed by contingency table with Fisher's exact test, two-tailed, p = 0.0115. Number of mice with liver metastases out of total number of mice indicated within bars. (D) Representative IHC for indicated antibodies in metastatic tissues from RPM or RPP mice. Scale bar is 50 μm. (E) Representative IHC for NFIB in primary lung tissue from indicated mice. Scale bar is 50 μm. (F) ChIP-seq analysis of MYC targets in three independent RPM cell lines with exons of Nfib gene indicated by rectangles at the bottom.
Figure 5
Figure 5. MYC-driven SCLC is highly responsive to chemotherapy but rapidly relapses
(A) H&E stained lung tumor tissue from RPM or RPP mice in the absence (PBS) or presence of a single dose of chemotherapy (Chemo) and representative IHC for indicated antibodies. Scale bar is 50 μm. (B-D) Automated quantification of IHC for pH2AX (B), BrdU (C) or CC3 (D) from mice as in A. Dots are average per animal. *** p < 0.0003, ** p < 0.003, * p < 0.05. (E) H&E of whole lung sections from RPM mice treated with PBS or 2 doses of chemotherapy (2X Chemo). Lung outlined in black, tumor outlined in red. Scale bar is 4 mm. Automated quantification of percent tumor burden; n = 7 mice per treatment group. *** p < 0.0007. (F) Representative microCT images and quantification of total tumor burden from animals in panel E at day 0 (d0) or day 12 (d12). Tumors are pseudo-colored yellow; air space is purple. *** p < 0.0008; **** p < 0.0001. For panels B–F, error bars indicate mean ± SEM with two-tailed unpaired t tests. (G) Kaplan-Meier survival analysis of RPM mice treated with 5 mg/kg cisplatin and 10 mg/kg etoposide indicated by dashed vertical lines. Log-rank (Mantel-Cox) test indicated. See also Figure S4.
Figure 6
Figure 6. MYC-driven SCLC is vulnerable to Aurora kinase inhibition
(A) Heatmap of median GI50 values for indicated human SCLC cell lines treated with indicated drugs for 72–96 hr. (B) Statistical significance of increased drug responses in A tested for each compound (one-sided t tests, p values adjusted according to Bonferroni-Holm). (C–F) GI50 values of cells treated with cisplatin (C), etoposide (D), Alisertib (E) or Barasertib (F) in triplicate for 96 hr. Mean ± SEM of n = 4–7 experiments. Black boxes indicate genotype; half black boxes indicate RPMLSL/+. (G) GI50 drug responses of SCLC cell lines grouped according to MYC status. p values were calculated by two-sided t tests with Bonferroni-Holm correction for multiple testing. (H) Immunoblot of whole cell lysates from cell lines treated for 48 hr with indicated concentrations of Alisertib. HSP90 serves as loading control. (I) DNA content of PB120 (RPM), 3151T1 (RP), MC331 (RPP) and KP mouse cell lines treated with Alisertib (48 hr) measured by flow cytometry, representative of n = 2 experiments. See also Figure S5.
Figure 7
Figure 7. Aurora kinase inhibition combined with chemotherapy significantly prolongs survival of mice with MYC-driven SCLC
(A) Schematic for in vivo drug studies in RPM mice. Black arrowheads indicate microCT imaging (mCT). Purple arrows indicate Alisertib (Ali) treatment (20 mg/kg, twice daily, 5 days on, 2 days off); gray arrows indicate cisplatin (5 mg/kg) or etoposide (10 mg/kg)(Chemo, weekly). Days indicated as white dots on X-axis. (B) Fold change in tumor burden in indicated cohorts of RPM mice. Error bars represent mean ± SEM. For Chemo vs. Chemo + Ali, * p < 0.05 at indicated time points. (C) Representative microCT images from RPM mice pseudo-colored with tumors (yellow) and normal tissue/airway (purple). (D) Total tumor volume change from day 0–19 (or last scan before death) of individual RPM mice treated as in A for three cycles. Partial response and stable disease indicated with gray shading. Two-tailed unpaired t tests, p < * 0.023, ** < 0.002, **** < 0.0001. (E–F) IHC for indicated antibodies in each treatment group (E) and automated quantification of IHC (F). Scale bar is 50 μm. Abnormal NEUROD1+ cells are indicated by yellow arrows. Error bars represent mean ± SEM, two-tailed unpaired t tests, * p < 0.02, *** < 0.0008, **** < 0.0001. ns = not significant. (G) Kaplan-Meier survival analysis of RPM mice treated as in A with day 0 as start of treatment and cisplatin treatment indicated by dashed lines. Log-rank (Mantel-Cox) test, * p < 0.02, p ** < 0.009, *** < 0.0006, **** < 0.0001, ns = not significant. See also Figure S6.

References

    1. Borromeo MD, Savage TK, Kollipara RK, He M, Augustyn A, Osborne JK, Girard L, Minna JD, Gazdar AF, Cobb MH, Johnson JE. ASCL1 and NEUROD1 Reveal Heterogeneity in Pulmonary Neuroendocrine Tumors and Regulate Distinct Genetic Programs. Cell Rep. 2016;16:1259–1272. - PMC - PubMed
    1. Brennan J, O'Connor T, Makuch RW, Simmons AM, Russell E, Linnoila RI, Phelps RM, Gazdar AF, Ihde DC, Johnson BE. myc family DNA amplification in 107 tumors and tumor cell lines from patients with small cell lung cancer treated with different combination chemotherapy regimens. Cancer Res. 1991;51:1708–1712. - PubMed
    1. Brockmann M, Poon E, Berry T, Carstensen A, Deubzer HE, Rycak L, Jamin Y, Thway K, Robinson SP, Roels F, et al. Small molecule inhibitors of aurora-a induce proteasomal degradation of N-myc in childhood neuroblastoma. Cancer Cell. 2013;24:75–89. - PMC - PubMed
    1. Bunn PA, Jr, Minna J, Augustyn A, Gazdar A, Ouadah Y, Krasnow MA, Berns A, Brambilla E, Rekhtman N, Massion PP, et al. Small Cell Lung Cancer: Can recent advances in biology and molecular biology be translated into improved outcomes? J Thorac Oncol. 2016;11:453–474. - PMC - PubMed
    1. Calbo J, van Montfort E, Proost N, van Drunen E, Beverloo HB, Meuwissen R, Berns A. A functional role for tumor cell heterogeneity in a mouse model of small cell lung cancer. Cancer Cell. 2011;19:244–256. - PubMed

Publication types

MeSH terms

Substances