. 2017 Feb 13;31(2):240-255.
doi: 10.1016/j.ccell.2016.12.004. Epub 2017 Jan 12.

Single-chromosome Gains Commonly Function as Tumor Suppressors

Affiliations

Single-chromosome Gains Commonly Function as Tumor Suppressors

Jason M Sheltzer et al. Cancer Cell. .

Abstract

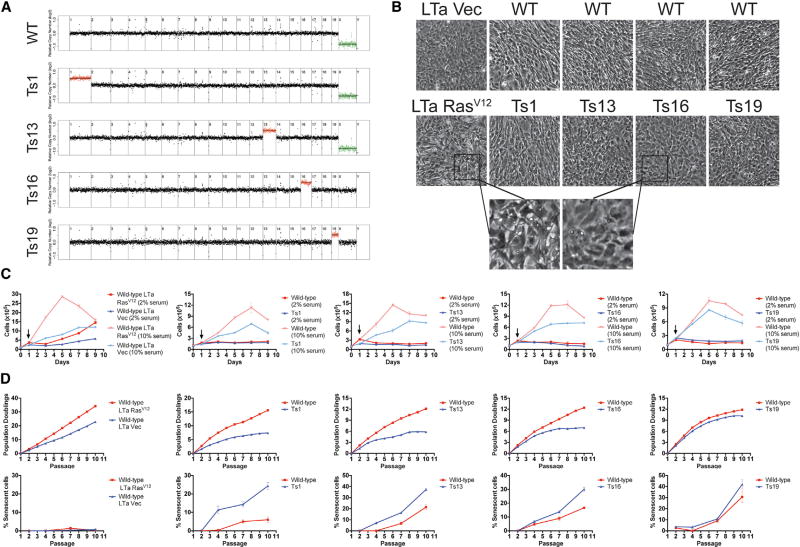
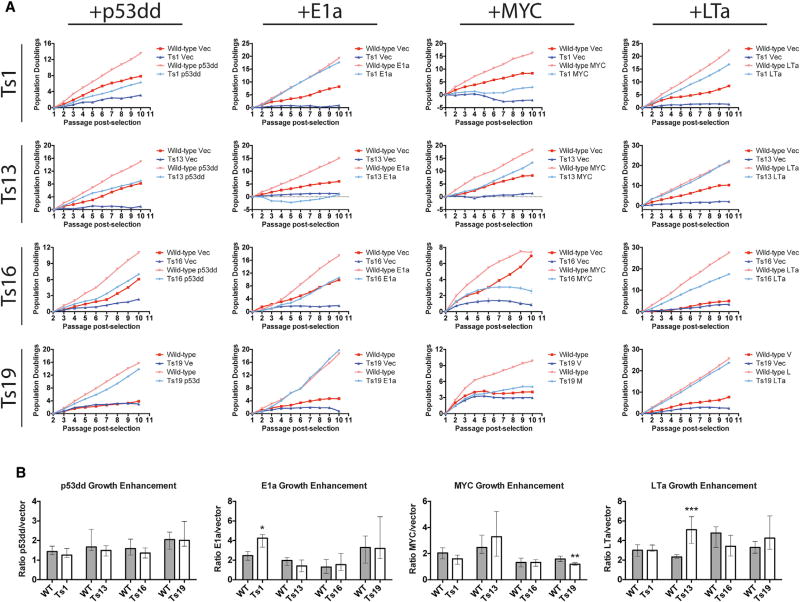
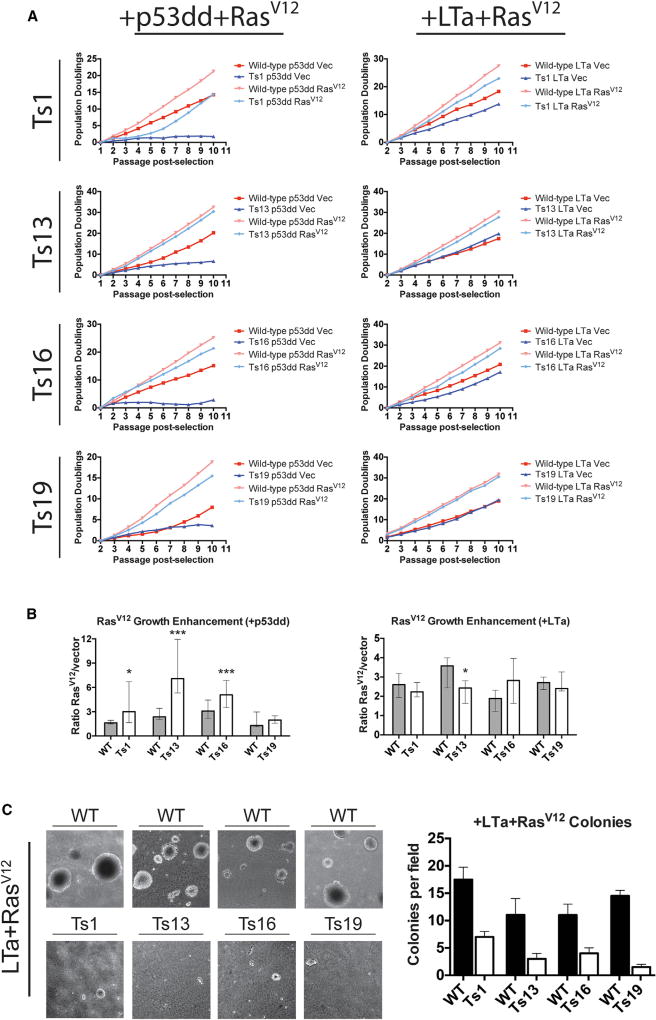
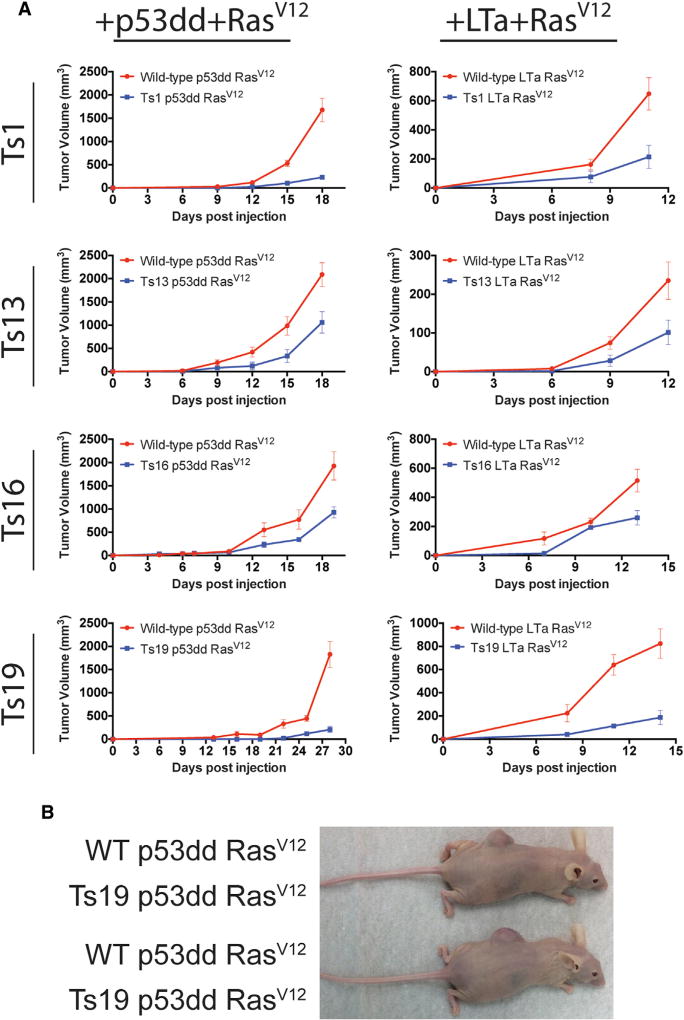
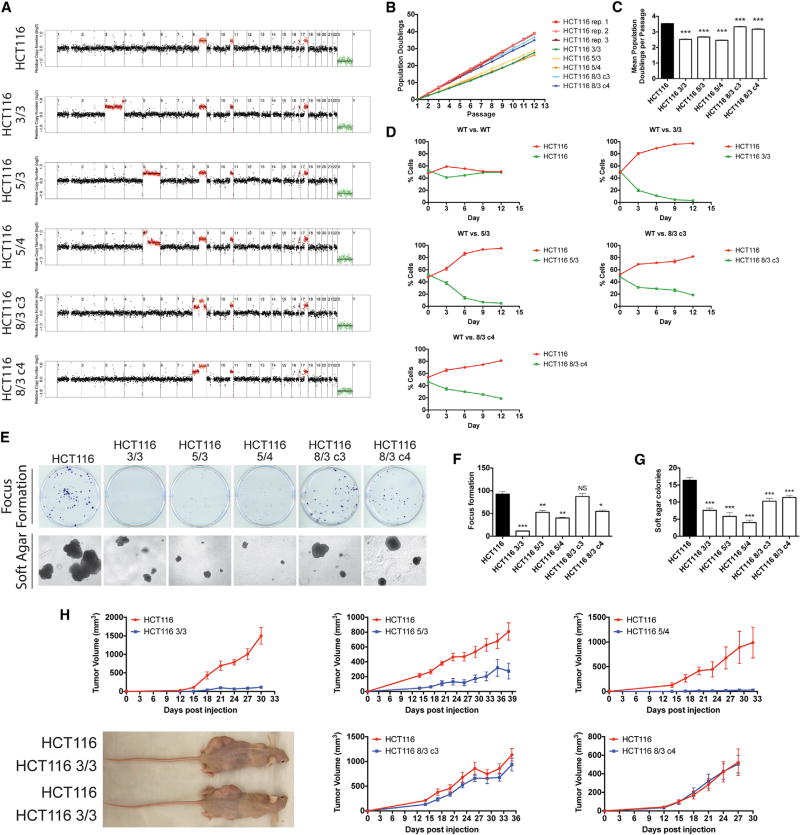
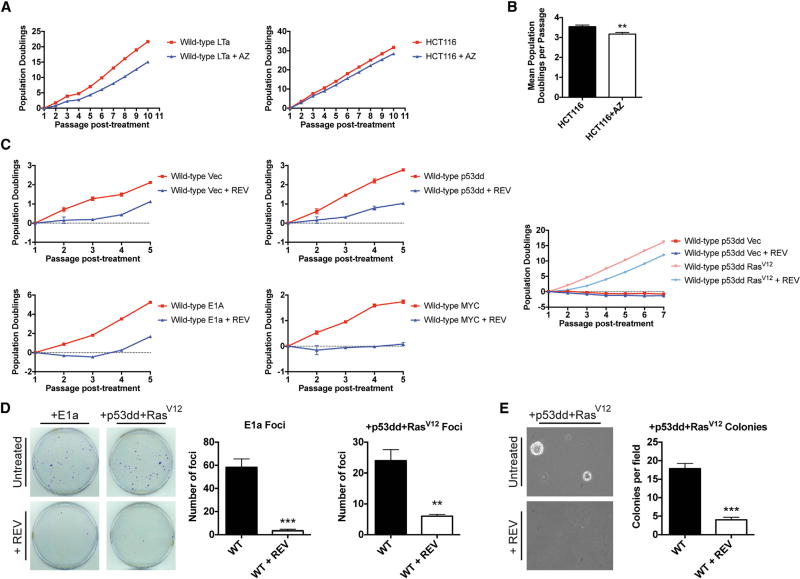
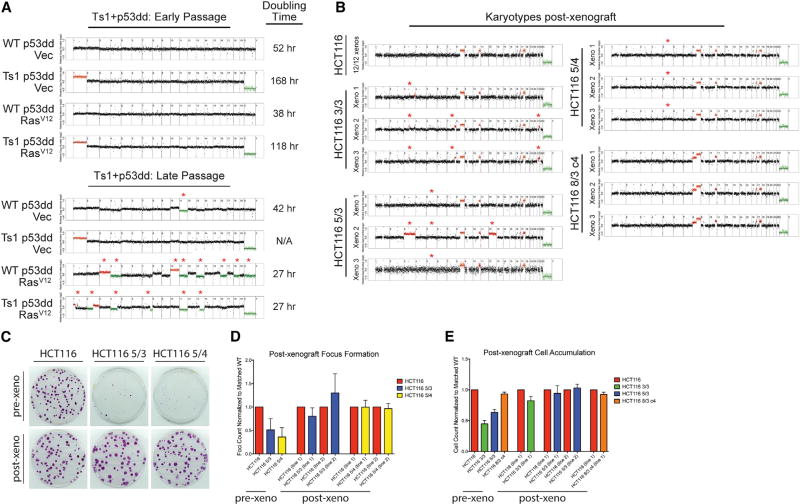
Aneuploidy is a hallmark of cancer, although its effects on tumorigenesis are unclear. Here, we investigated the relationship between aneuploidy and cancer development using cells engineered to harbor single extra chromosomes. We found that nearly all trisomic cell lines grew poorly in vitro and as xenografts, relative to genetically matched euploid cells. Moreover, the activation of several oncogenic pathways failed to alleviate the fitness defect induced by aneuploidy. However, following prolonged growth, trisomic cells acquired additional chromosomal alterations that were largely absent from their euploid counterparts and that correlated with improved fitness. Thus, while single-chromosome gains can suppress transformation, the genome-destabilizing effects of aneuploidy confer an evolutionary flexibility that may contribute to the aggressive growth of advanced malignancies with complex karyotypes.

Keywords: aneuploidy; chromosomal instability; genome dosage imbalance; genomic instability; transformation.


Figures

Figure 1
Figure 1. Single-Chromosome Aneuploidy Is Insufficient to Induce Neoplastic Phenotypes
(A) MEF lines that were euploid or trisomic for chromosomes 1, 13, 16, or 19 were subjected to low-pass whole-genome sequencing. Normalized read depths across 500 kb bins are displayed. Note that only one euploid cell line is shown, although each trisomic MEF line had a separate euploid line that was derived from a euploid littermate. (B) Photomicrographs of monolayers of the indicated cell lines. LTa + RasV12 MEFs, but not trisomic MEFs, lose contact inhibition when grown to confluence. (C) Growth curves of the indicated cell lines are displayed. Cells were first plated in normal (10% serum) medium, then 24 hr after plating, the cells were re-fed or switched to reduced (2% serum) medium (indicated by an arrow). LTa + RasV12 MEFs, but not trisomic MEFs, continue to divide in low-serum medium. (D) The indicated cells were passaged, counted, and plated in triplicate every third day for 10 passages (top row). On passages 2, 4, 7, and 10, β-galactosidase levels were measured (bottom row). LTa-transduced MEFs exhibit negligible levels of senescence, but trisomic cell lines senesce at an early passage. Error bars indicate the SEM. See also Figures S1 and S2, and Table S1.
Figure 2
Figure 2. Trisomy Impedes the Proliferation of Oncogene-Transduced Cell Lines
(A) Euploid and trisomic cell lines were stably transduced with plasmids harboring the indicated oncogene or a matched empty vector. Following selection, the cell lines were passaged every third day for up to 10 passages, and the cumulative population doublings over the course of each experiment are displayed. Note that the panel displaying Ts19 + LTa is reproduced in Figure S7. See also Figures S3 and S4. (B) The number of cells recovered from oncogene-transduced MEFs was divided by the number of cells recovered from vector-transduced MEFs at every passage. Bar graphs display the median ratios and the interquartile ranges. *p < 0.05, **p < 0.005, ***p < 0.0005 (Wilcoxon rank-sum test). See also Figures S3 and S4.
Figure 3
Figure 3. Effects of RasV12 Expression on Immortalized Euploid and Trisomic MEFs
(A) Euploid and trisomic cell lines were first stably transduced with p53dd or with LTa, and then transduced a second time with plasmids harboring RasV12 or a matched empty vector. The cell lines were passaged, counted, and plated in triplicate up to 10 passages following the second round of selection. Note that the panel displaying Ts13 + LTa + RasV12 is reproduced in part in Figure S5, the panel displaying Ts16 + p53dd + RasV12 is reproduced in Figure S6, and the panel displaying Ts19 + LTa + RasV12 is reproduced in part in Figures S5 and S7. (B) The number of cells recovered from RasV12-transduced MEFs was divided by the number of cells recovered from vector-transduced MEFs at every passage. Bar graphs display the median ratios and the interquartile ranges. *p < 0.05, ***p < 0.0005 (Wilcoxon rank-sum test). (C) 20,000 cells of the indicated cell lines were plated in soft agar and then grown for 20 days. For each comparison, the euploid MEFs formed more colonies than the trisomic MEFs (p < 0.01, Student’s t test). Bar graphs display the mean ± SEM colonies per field. See also Figures S5 and S6.
Figure 4
Figure 4. Trisomy Hampers Tumor Growth in Xenografts
(A) 106 euploid or aneuploid cells transduced with either p53dd and RasV12 or with LTa and RasV12 were injected subcutaneously into the flanks of nude mice. Tumor volume was measured every 3 days. Note that mice injected with cells transduced with LTa + RasV12 had to be euthanized prematurely due to cachexia. Error bars indicate the SEM. (B) Representative images of mice injected contralaterally with WT + p53dd + RasV12 cells or Ts19 + p53dd + RasV12 cells.
Figure 5
Figure 5. Single-Chromosome Gains Impede the Growth of Human Colorectal Cancer Cell Lines In Vitro and In Vivo
(A) Normalized read depths from whole-genome sequencing of the HCT116 human colorectal cancer cell line as well as HCT116 derivatives that harbored extra chromosomes. (B) Growth curves of colorectal cancer cell lines with different karyotypes. Cells were counted and passaged every third day. (C) Quantification of the mean population doublings per passage of multiple replicates of the experiment shown in (B). (D) Competition experiment between GFP+ aneuploid HCT116 cells and GFP + dsRed+ near-euploid HCT116 cells. Every third day, the cells were trypsinized, passaged, and analyzed for dsRed+ cell number. (E) 200 cells of the indicated lines were grown for 14 days prior to staining with crystal violet (top), or 2,000 cells of the indicated lines were plated in soft agar and allowed to grow for 20 days before being imaged (bottom). (F) Quantification of focus formation assayed in (E). (G) Quantification of colony formation in soft agar in (E). (H) 4 × 10⁶ HCT116 cells or HCT116 cells with additional chromosome(s) were injected subcutaneously into the flanks of 5–10 nude mice. Tumor growth was measured every third day. Error bars indicate the SEM. *p < 0.05, **p < 0.005, ***p < 0.0005 (Student’s t test). See also Table S2.
Figure 6
Figure 6. Spindle Assembly Checkpoint Inhibitor Treatment Fails to Transform MEFs
(A) MEFs expressing LTa or HCT116 cells were treated for 24 hr with 2 µM AZ3146, and then counted and passaged every third day following removal of the drug. (B) Quantification of the HCT116 growth curve from (A). Although the slopes of these growth curves are similar, the untreated HCT116 cells undergo significantly more population doublings per passage than the AZ3146-treated HCT116 cells. (C) MEFs expressing either an empty vector control, p53dd, MYC, E1A, or p53dd and RasV12 were treated with 500 nM reversine for 24 hr and then counted and passaged every third day following removal of the drug. (D) 1,000 cells of the indicated cell lines that either had or had not been treated with 500 nM reversine for 24 hr were plated and then allowed to grow for 10 days before being stained with crystal violet. Representative plates are shown on the left, while average foci counts are displayed on the right. (E) 20,000 MEFs expressing p53dd and RasV12 that either had or had not been treated with 500 nM reversine for 24 hr were plated in soft agar and then grown for 20 days. Representative images are shown on the left, while average colonies per field are displayed on the right. **p < 0.005, ***p < 0.0005 (Student’s t test). Error bars indicate the SEM.
Figure 7
Figure 7. Karyotype Evolution Correlates with Enhanced Growth in Aneuploid Cell Lines
(A) Karyotype analysis of the Ts1+p53dd + RasV12 experiment, initially presented in Figure 3A, is displayed. Whole-genome sequencing at passage 2 revealed that the slow-growing line maintained its initial karyotype, while whole-genome sequencing at passage 10 revealed that the rapidly growing line had lost the trisomy of mChr1 and displayed several further chromosomal gains and losses. Note that the early-passage karyotype analysis is also displayed in Figure S2B, and is presented here for reference. (B) HCT116 xenografts, initially presented in Figure 5H, were extracted, digested with trypsin, and then plated on plastic. Low-pass whole-genome sequencing revealed that 12 HCT116 xenografts and 3 HCT116 8/3 c4 xenografts maintained their initial karyotypes. However, all HCT116 3/3, 5/3, and 5/4 xenografts lost their initial trisomies or tetrasomies during in vivo growth, and several lines displayed additional chromosomal CNAs. Deviations from each cell line’s initial karyotype are indicated with an asterisk in (A) and (B). (C) Comparison of the focus-formation ability of HCT116 cells before or after growth as a xenograft. (D) Quantification of the focus-formation assay in (C). (E) Proliferation assay of HCT116 cells before or after growth as a xenograft. Error bars indicate the SEM. See also Figures S7 and S8.

Comment in

References

    1. Ahuja D, Sáenz-Robles MT, Pipas JM. SV40 large T antigen targets multiple cellular pathways to elicit cellular transformation. Oncogene. 2005;24:7729–7745. - PubMed
    1. Baker DJ, Jeganathan KB, Cameron JD, Thompson M, Juneja S, Kopecka A, Kumar R, Jenkins RB, de Groen PC, Roche P, et al. BubR1 insufficiency causes early onset of aging-associated phenotypes and infertility in mice. Nat. Genet. 2004;36:744–749. - PubMed
    1. Balaban GB, Herlyn M, Clark WH, Jr, Nowell PC. Karyotypic evolution in human malignant melanoma. Cancer Genet. Cytogenet. 1986;19:113–122. - PubMed
    1. Blank HM, Sheltzer JM, Meehl CM, Amon A. Mitotic entry in the presence of DNA damage is a widespread property of aneuploidy in yeast. Mol. Biol. Cell. 2015;26:1440–1451. - PMC - PubMed
    1. Boveri T. Concerning the origin of malignant tumours by Theodor Boveri. Harris Henry., translator. J. Cell Sci. 2008;121:1–84. and annotated. - PubMed

Publication types