

Tasting profile affects adoption of caloric beverage reduction in a randomized weight loss intervention
- PMID: 28090344
- PMCID: PMC5192544
- DOI: 10.1002/osp4.64
Tasting profile affects adoption of caloric beverage reduction in a randomized weight loss intervention
Abstract
Objective: The aim of this study was to examine differences in rates of non-caloric beverage adoption by participants classified as sweet likers (SLs) or sweet dislikers (measured using a behavioural tasting task).
Methods: Data are a sub-study from a 6-month, three-group, randomized weight loss trial (CHOICE) (body mass index 36.3 ± 5.8 kg m-2, 84% female, aged 42.2 ± 10.9 years, 53% African-American) comparing the replacement of caloric beverages with either non-caloric sweetened beverages (diet) or water (water) compared with a control group. This sub-study, which included participants within the water (n = 106) and diet (n = 103) groups only, examined whether SLs (n = 33 water; n = 37 diet) varied in their adherence to caloric beverage recommendations compared with sweet dislikers (n = 73 water; n = 76 diet) over the 6-month study.
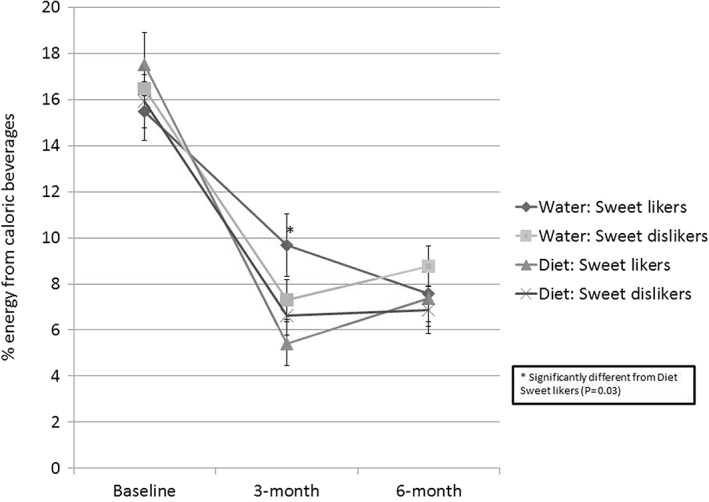
Results: Diet intake and sweet-liking data collected on 190 (3 months) and 169 participants (6 months) were used for analysis. The interaction between SL status and beverage group (diet vs. water) approached significance (P = 0.06) at 3 months but not 6 months. Caloric beverage intake (% energy) at 3 months was significantly higher in SLs within the water group (9.7 ± 1.4%) compared with SLs in the diet group (5.4 ± 1.0%, P = 0.03).
Conclusions: Results suggest that SL status may affect the rate in reduction of caloric beverages when water is the recommended substitution. Future studies should explore tailoring beverage recommendations to tasting profile.
Keywords: Beverages; dietary adherence; tasting preference; water.
Figures
References
-
- Davis C, Patte K, Levitan R, Reid C, Tweed S, Curtis C. From motivation to behaviour: a model of reward sensitivity, overeating, and food preferences in the risk profile for obesity. Appetite 2007; 48: 12–9. - PubMed
-
- Kampov‐Polevoy AB, Alterman A, Khalitov E, Garbutt JC. Sweet preference predicts mood altering effect of and impaired control over eating sweet foods. Eat Behav 2006; 7: 181–7. - PubMed
-
- Donaldson LF, Bennett L, Baic S, Melichar JK. Taste and weight: is there a link? Am J Clin Nutr 2009; 90: 800S–3S. - PubMed
-
- Drewnowski A. Taste preferences and food intake. Annu Rev Nutr 1997; 17: 237–53. - PubMed
Grants and funding
LinkOut - more resources
Full Text Sources
Other Literature Sources