. 2016 May 5;2(5):584-604.
doi: 10.1016/j.jcmgh.2016.04.007. eCollection 2016 Sep.

Hepatocyte Toll-Like Receptor 5 Promotes Bacterial Clearance and Protects Mice Against High-Fat Diet-Induced Liver Disease

Affiliations

Hepatocyte Toll-Like Receptor 5 Promotes Bacterial Clearance and Protects Mice Against High-Fat Diet-Induced Liver Disease

Lucie Etienne-Mesmin et al. Cell Mol Gastroenterol Hepatol. .

Abstract

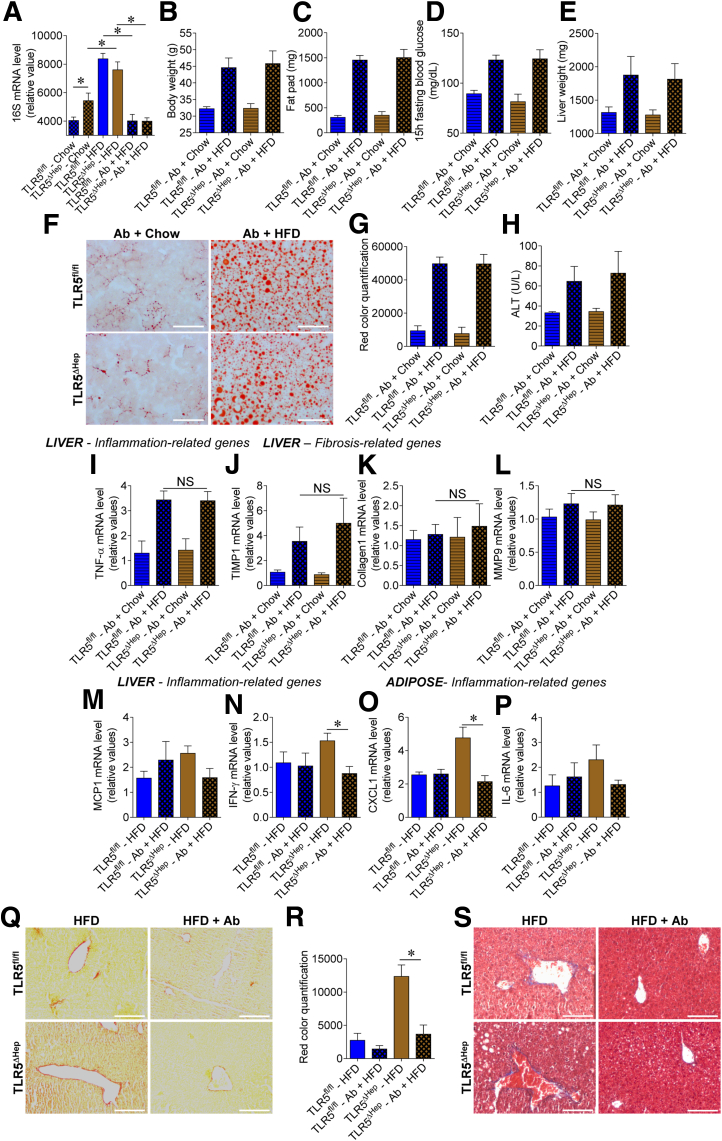
Background & aims: Innate immune dysfunction can promote chronic inflammatory diseases of the liver. For example, mice lacking the flagellin receptor Toll-like receptor 5 (TLR5) show microbial dysbiosis and predisposition to high-fat diet (HFD)-induced hepatic steatosis. The extent to which hepatocytes play a direct role in detecting bacterial products in general, or flagellin in particular, is poorly understood. In the present study, we investigated the role of hepatocyte TLR5 in recognizing flagellin, policing bacteria, and protecting against liver disease.

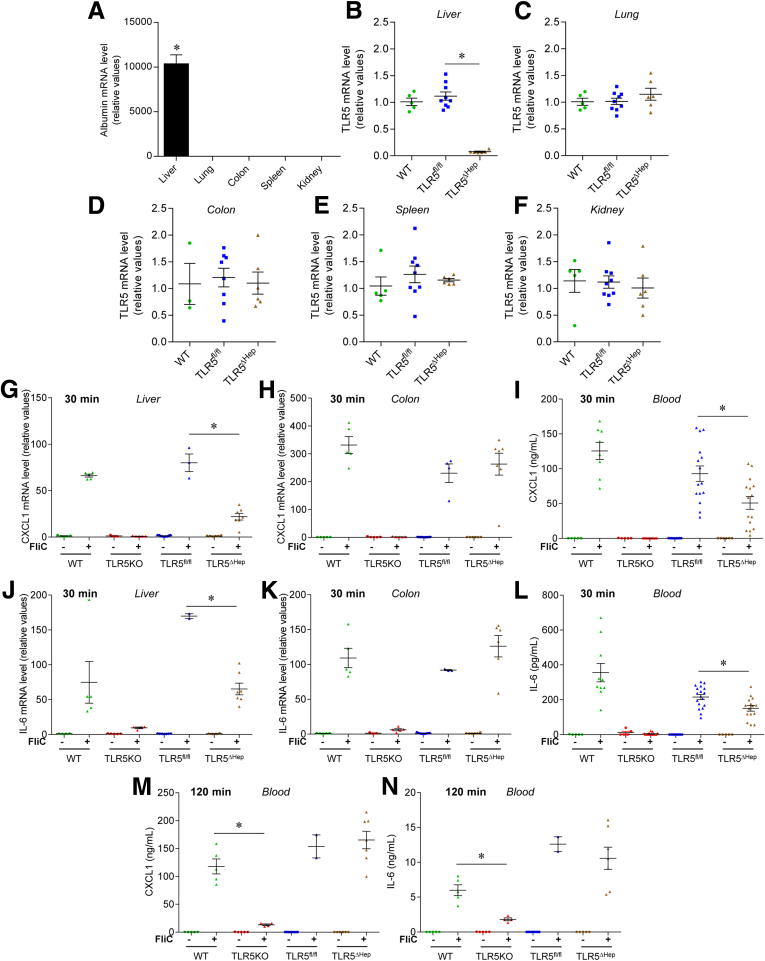
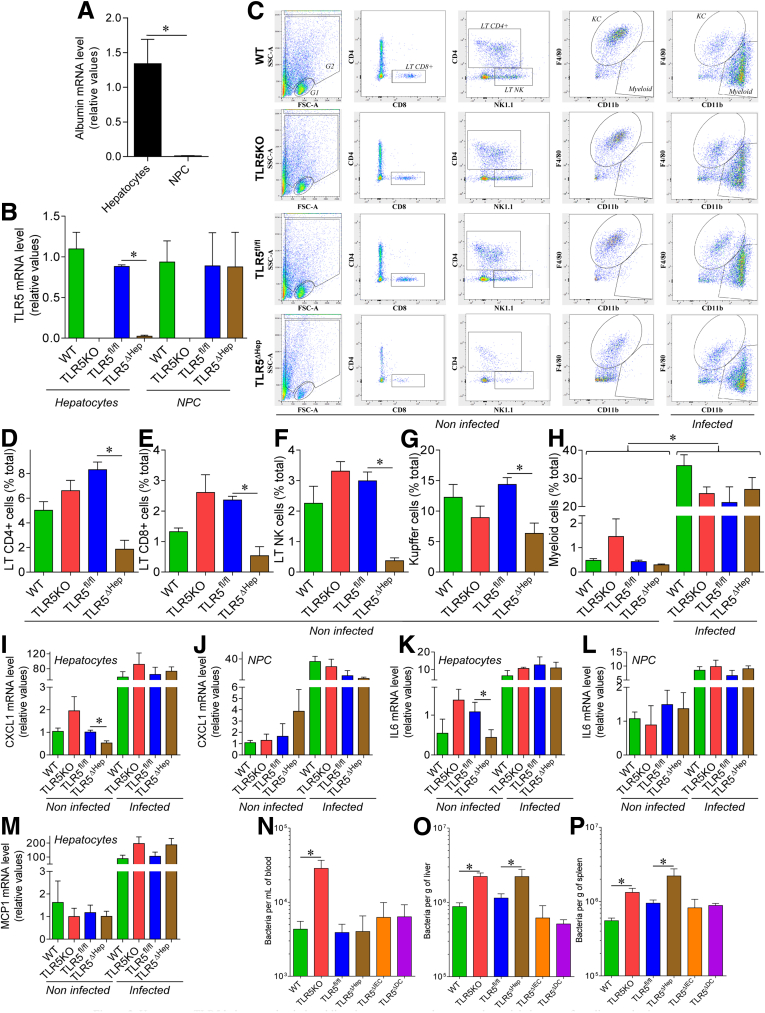
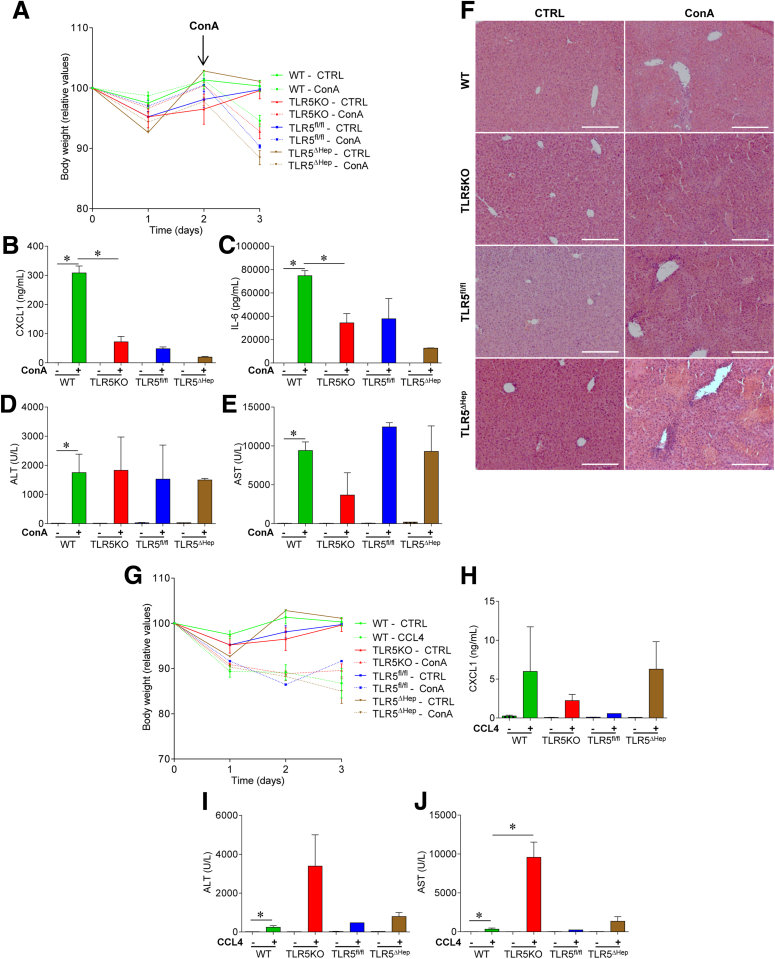
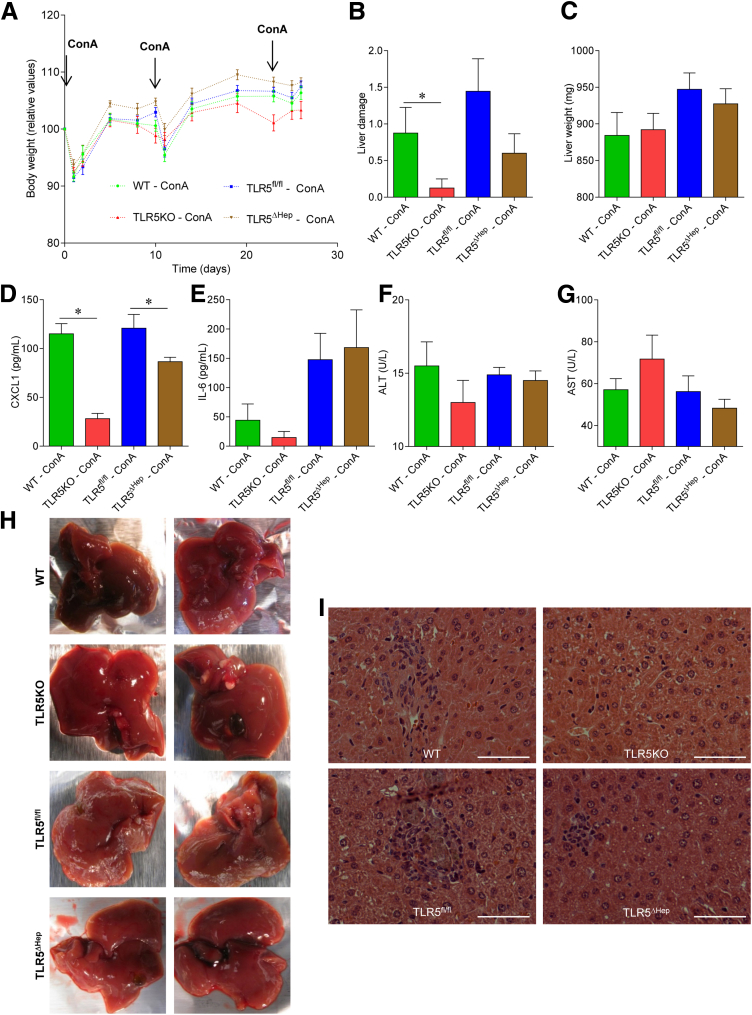
Methods: Mice were engineered to lack TLR5 specifically in hepatocytes (TLR5ΔHep) and analyzed relative to sibling controls (TLR5fl/fl). TLR5 messenger RNA levels, responses to exogenous flagellin, elimination of circulating motile bacteria, and susceptibility of liver injury (concanavalin A, carbon tetrachloride, methionine- and choline-deficient diet, and HFD) were measured.

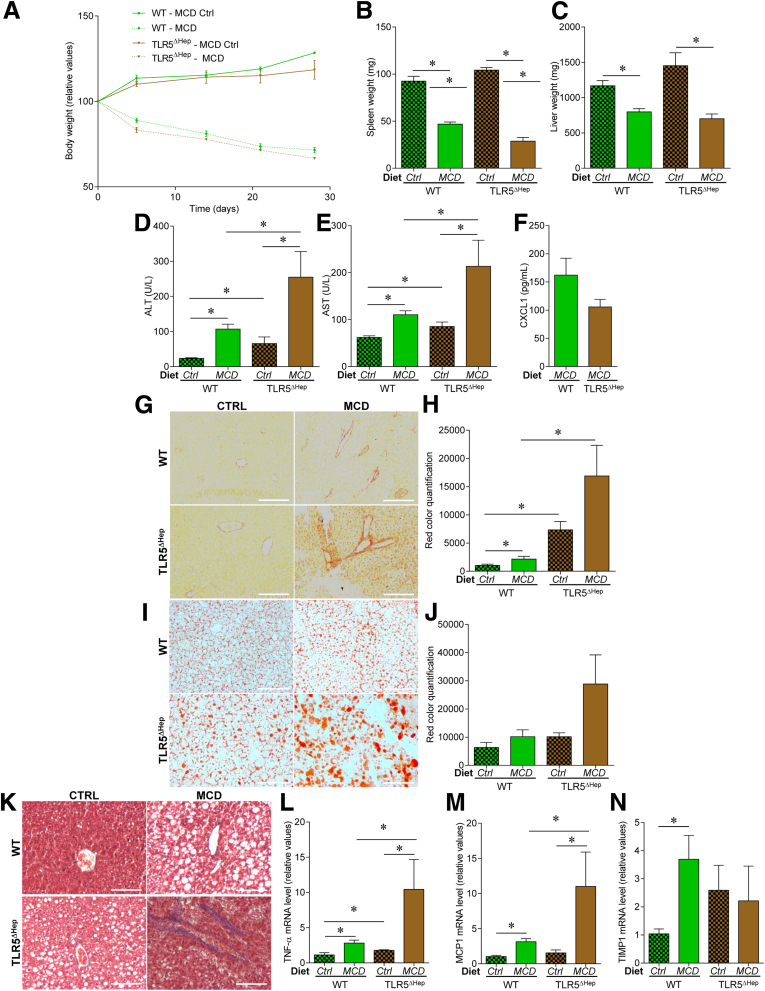
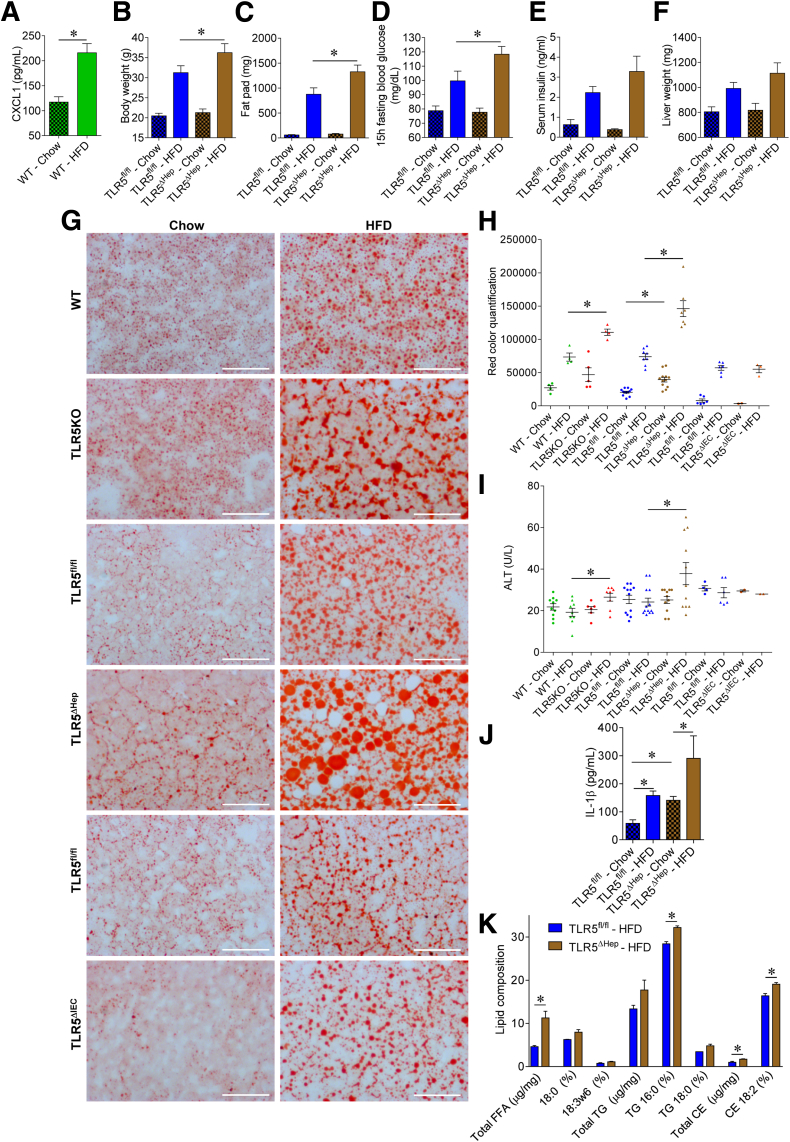
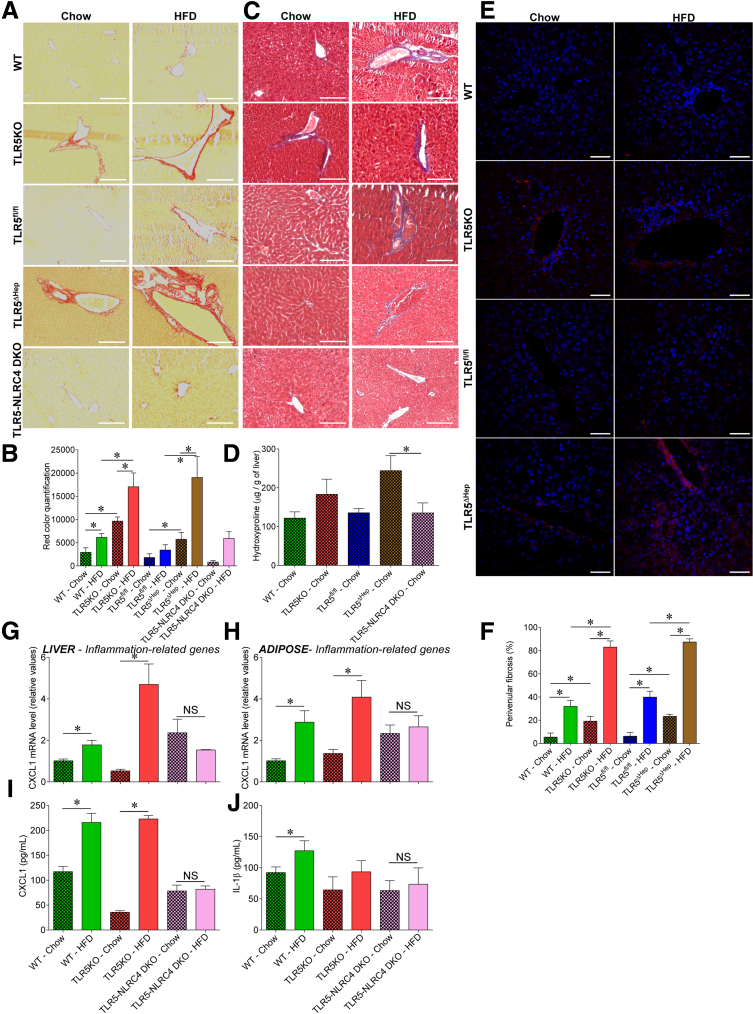
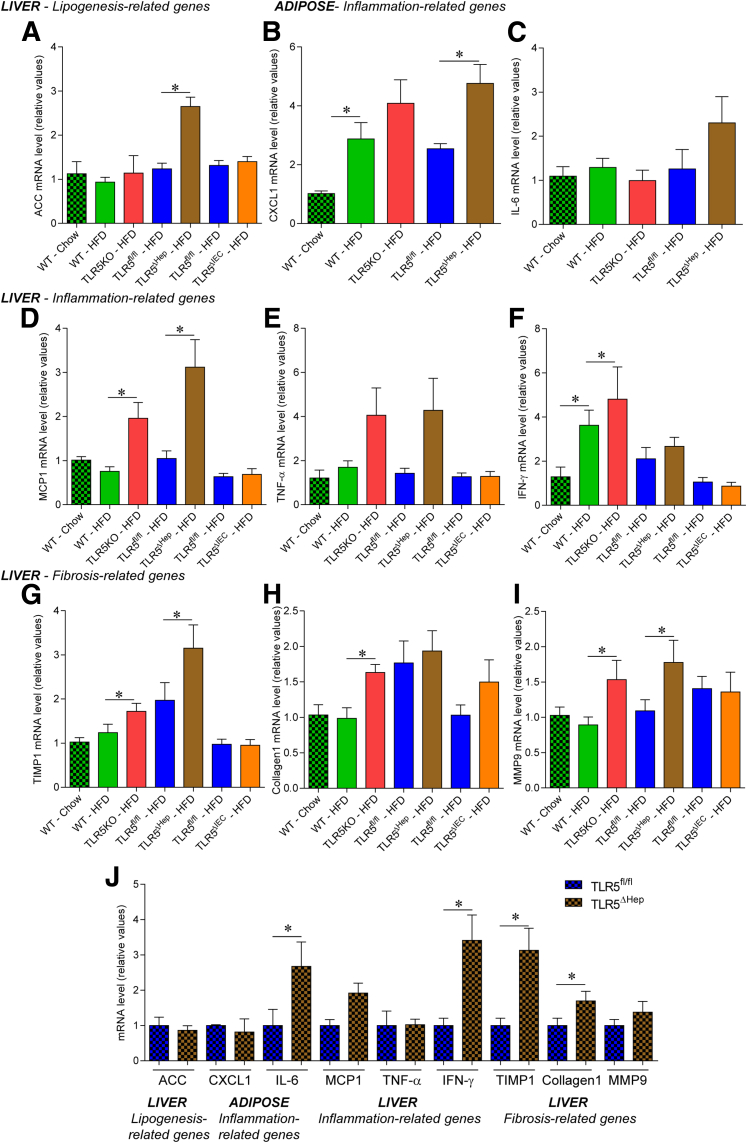
Results: TLR5ΔHep expressed similar levels of TLR5 as TLR5fl/fl in all organs examined, except in the liver, which showed a 90% reduction in TLR5 levels, indicating that hepatocytes accounted for the major portion of TLR5 expression in this organ. TLR5ΔHep showed impairment in responding to purified flagellin and clearing flagellated bacteria from the liver. Although TLR5ΔHep mice did not differ markedly from sibling controls in concanavalin A or carbon tetrachloride-induced liver injury models, they showed exacerbated disease in response to a methionine- and choline-deficient diet and HFD. Such predisposition of TLR5ΔHep to diet-induced liver pathology was associated with increased expression of proinflammatory cytokines, which was dependent on the Nod-like-receptor C4 inflammasome and rescued by microbiota ablation.

Conclusions: Hepatocyte TLR5 plays a critical role in protecting liver against circulating gut bacteria and against diet-induced liver disease.

Keywords: ALT, alanine aminotransferase; AST, aspartate aminotransferase; CCL4, carbon tetrachloride; CFU, colony-forming unit; CXCL, chemokine (C-X-C motif) ligand 1; ConA, concanavalin A; DC, dendritic cell; HFD, high-fat diet; Hep, hepatocyte; Hepatocytes; IEC, intestinal epithelial cell; IL, interleukin; Inflammation; Innate Immunity; KO, knock-out; LPS, lipopolysaccharide; MCD, methionine- and choline-deficient diet; NAFLD, nonalcoholic fatty liver disease; NASH, nonalcoholic steatohepatitis; NLR, nod-like receptor; NPC, nonparenchymal cell; PBS, phosphate-buffered saline; RT-PCR, reverse-transcription polymerase chain reaction; Steatosis; TLR, Toll-like receptor; TLR5; WT, wild-type; mRNA, messenger RNA.


Figures

Figure 1
Figure 1
Generation and characterization of mice lacking TLR5 in the liver. (A) Analysis of albumin mRNA expression by quantitative RT-PCR in multiple organs of WT mice. (B–F) Analysis of TLR5 mRNA expression by quantitative RT-PCR in the (B) liver, (C) lung, (D) colon, (E) spleen, and (F) kidney of WT, TLR5fl/fl, and TLR5ΔHep mice. Results are expressed as relative values compared with the WT group, defined as 1. (G–L) Mice were injected intraperitoneally with 20 μg of purified flagellin (+) or vehicle (200 μL of sterile PBS [-]). Thirty minutes later, serum and organs were isolated. (G and H) Analysis of CXCL1 mRNA expression by quantitative RT-PCR in (G) liver and (H) colonic mucosa of WT, TLR5KO, TLR5fl/fl, and TLR5ΔHep mice. (I) Analysis of CXCL1 protein expression level by enzyme-linked immunosorbent assay in sera of WT, TLR5KO, TLR5fl/fl, and TLR5ΔHep mice. (J and K) Analysis of IL6 mRNA expression by quantitative RT-PCR in (J) liver and (K) colonic mucosa of WT, TLR5KO, TLR5fl/fl, and TLR5ΔHep mice. (L) Analysis of IL6 protein expression level by enzyme-linked immunosorbent assay in the serum of WT, TLR5KO, TLR5fl/fl, and TLR5ΔHep mice. (M and N) WT, TLR5KO, TLR5fl/fl, and TLR5ΔHep mice were injected intraperitoneally with 20 μg of purified flagellin (+) or vehicle (200 μL of sterile PBS [-]), and serum were collected 120 minutes after. (M) Analysis of CXCL1 protein expression level by enzyme-linked immunosorbent assay in the serum of WT, TLR5KO, TLR5fl/fl, and TLR5ΔHep mice. (N) Analysis of IL6 protein expression level by enzyme-linked immunosorbent assay in the serum of WT, TLR5KO, TLR5fl/fl, and TLR5ΔHep mice. (B–N) Points are from individual mice, with bars representing means ± SEM. (A) Data are the means ± SEM. N = 2–6, except for panels I and L, with N = 5–15. Significance was determined by the Student t test. *P < .05.
Figure 2
Figure 2
Hepatocyte TLR5 helps to maintain basal liver immune state and promotes bacterial clearance from liver and spleen. (A and B) Hepatic parenchymal (hepatocytes) and NPCs were isolated from WT, TLR5KO, TLR5fl/fl, and TLR5ΔHep mice. (A) Analysis of albumin mRNA expression in WT animals by quantitative RT-PCR. (B) Analysis of TLR5 mRNA expression by quantitative RT-PCR. Results are expressed as relative values compared with (A) hepatocyte or (B) WT groups, defined as 1. (C–P) Eight-week-old WT, TLR5KO, TLR5fl/fl, TLR5ΔHep, TLR5ΔIEC, and TLR5ΔDC mice were administered intravenously 107 live flagellated E coli strain MG1655. Hepatic parenchymal (hepatocytes) and NPCs were isolated from noninfected and infected WT, TLR5KO, TLR5fl/fl, and TLR5ΔHep mice. Liver NPCs were immunophenotyped and quantified by flow cytometry. (C) Representative flow cytometry dot plots. (D) Lymphocyte T CD4+ (LT CD4+), (E) lymphocyte T CD8+ (LT CD8+), (F) lymphocyte T natural killer (LT NK), (G) Kupffer cell, and (H) myeloid cell quantification, expressed as the percentage of total cells, with 20,000 cells being analyzed. Analysis of (I and J) CXCL1, (K and L) IL6, and (M) MCP1 mRNA expression by quantitative RT-PCR in (I, K, and M) purified hepatocytes and (J and L) purified NPC. Results are expressed as relative values compared with noninfected WT and TLR5fl/fl groups, defined as 1. (N–P) Six hours after inoculation, CFUs in (N) blood, (O) liver homogenate, and (P) spleen homogenate were enumerated on selective media. Data are the means ± SEM. No CFUs were detected in mice not administered E coli. N = 5–10. Significance was determined by the Student t test. *P < .05.
Figure 3
Figure 3
Hepatocyte TLR5 does not play a major role in protecting against acute concanavalin A or CCL4 treatments. (A–F) WT, TLR5KO, TLR5fl/fl, and TLR5ΔHep mice were injected intravenously with 200 μL of sterile PBS containing (+) or not (-) ConA (15 mg/kg of body weight), and then euthanized 24 hours after injection. (A) Body weight over time. (B) Analysis of CXCL1 protein expression level by enzyme-linked immunosorbent assay in the serum. (C) Analysis of IL6 protein expression level by enzyme-linked immunosorbent assay in the serum. (D) Serum ALT concentrations. (E) Serum AST concentrations. (F) H&E staining of liver sections. (G–J) WT, TLR5KO, TLR5fl/fl, and TLR5ΔHep mice were injected intraperitoneally with 200 μL of sterile olive oil containing (+) or not (-) CCL4 (1 μL/g of body weight), and euthanized 72 hours after injection. (G) Body weight over time. (H) Analysis of CXCL1 protein expression level by intraperitoneally in the serum. (I) Serum ALT concentrations. (J) Serum AST concentrations. Scale bar: 50 μm. Data are the means ± SEM. N = 3–5. Significance was determined by the Student t test. *P < .05. CTRL, control.
Figure 4
Figure 4
Hepatocyte TLR5 does not play a major role in protecting against chronic concanavalin A treatment. WT, TLR5KO, TLR5fl/fl, and TLR5ΔHep mice were injected intravenously with 200 μL of sterile PBS containing ConA (5 mg/kg of body weight) every week for 3 weeks, for a total of 3 injections. Forty-eight hours after the last injection, mice were euthanized. (A) Body weight over time, (B) macroscopic liver damage, and (C) liver weight were measured. (D) Analysis of CXCL1 protein expression level by enzyme-linked immunosorbent assay in the serum. (E) Analysis of IL6 protein expression level by enzyme-linked immunosorbent assay in the serum. (F) Serum ALT concentrations. (G) Serum AST concentrations. (H) Macroscopic picture of livers from ConA-treated WT, TLR5KO, TLR5fl/fl, and TLR5ΔHep mice. (I) H&E staining of liver sections from ConA-treated WT, TLR5KO, TLR5fl/fl, and TLR5ΔHep mice. Scale bar: 25 μm. Data are the means ± SEM. N = 3–5. Significance was determined by the Student t test. *P < .05.
Figure 5
Figure 5
Liver TLR5 protects against NASH induced by a methionine- and choline-deficient diet. WT and TLR5ΔHep mice were fed with a methionine-and choline-sufficient control diet (Ctrl) or a MCD, for 4 weeks. (A) Body weight over time, (B) spleen weights, (C) liver weights, (D) serum ALT concentrations, (E) serum AST concentrations, and (F) serum CXCL1 concentrations. (G and H) Liver fibrosis estimation using Sirius red staining, with (G) representative images and (H) quantification shown. (I and J) Liver steatosis estimation using Oil Red O staining, with (I) representative images and (J) quantification shown. (K) Liver fibrosis estimation using Masson's trichrome staining, with representative images shown. (L–N) Liver mRNAs were isolated and quantitated for expression of genes involved in inflammation and fibrosis: (L) tumor necrosis factor (TNF)-α, (M) MCP1, and (N) TIMP metallopeptidase inhibitor 1. Results are expressed as relative values compared with WT mice fed with control diet group, defined as 1. Scale bar: 50 μm. Data are the means ± SEM. N = 5. Significance was determined by the Student t test. *P < .05.
Figure 6
Figure 6
Liver TLR5 protects against high-fat diet–induced metabolic syndrome and steatosis. (A) Analysis of CXCL1 protein expression level by enzyme-linked immunosorbent assay in sera of WT mice fed with a regular chow diet or a HFD, comprising 60% fat, for 8 weeks. (B–K) TLR5fl/fl and TLR5ΔHep mice were fed with a regular chow diet or a HFD, comprising 60% fat, for 8 weeks. (B) Body weight, (C) fat-pad weights, (D) 15-hour fasting blood glucose concentration, (E) 5-hour fasting insulinemia, and (F) liver weights were measured. (G and H) Liver lipid staining using Oil Red O, with (G) representative images and (H) quantification shown. (I) Serum ALT concentrations. (J) Serum IL1β concentrations. (K) Lipid composition in the liver. FFA, free-fatty acid; TG, triglyceride; CE, cholesterol ester. Scale bar: 50 μm. Data are the means ± SEM. (H and I) Points are from individual mice, with bar representing means ± SEM. N = 5–15. Significance was determined by the Student t test. *P < .05.
Figure 7
Figure 7
Liver TLR5 protects against high-fat diet–induced fibrosis. WT, TLR5KO, TLR5fl/fl, TLR5ΔHep, and TLR5-NLRC4 double knock-out (DKO) mice were fed with a regular chow diet or a HFD, comprising 60% fat, for 8 weeks. (A and B) Liver fibrosis estimation using Sirius red staining, with (A) representative images and (B) quantification shown. (C) Liver fibrosis estimation using Masson's trichrome staining, with representative images shown. (D) Hydroxyproline quantification. (E and F) Liver fibrosis estimation using collagen immunostaining and confocal microscopy analysis, with (E) representative images (staining of collagen in red and DNA in blue), and (F) quantification (percentage of vein presenting collagen accumulation, determined through the examination of 10 veins per slide) shown. (G) Liver and (H) adipose tissue mRNA were isolated and quantitated for expression of the CXCL1 gene, involved in inflammation. Results are expressed as relative values compared with WT mice fed with regular chow, defined as 1. (I) Analysis of CXCL1 protein expression level by enzyme-linked immunosorbent assay in the serum. (J) Analysis of IL1β protein expression level by enzyme-linked immunosorbent assay in the serum. Scale bar: 50 μm. Data are the means ± SEM. N = 5. Significance was determined by the Student t test. *P < .05.
Figure 8
Figure 8
Loss of hepatocyte TLR5 potentiates high-fat diet–induced proinflammatory gene expression in liver. WT, TLR5KO, TLR5fl/fl, TLR5ΔHep, and TLR5ΔIEC mice were fed with a regular chow diet or a HFD, comprising 60% fat, for 8 weeks. (A) Liver mRNAs were isolated and quantitated for expression of the acetyl-coenzyme A carboxylase gene, involved in lipogenesis. (B and C) Adipose tissue mRNAs were isolated and quantitated for expression of genes involved in inflammation: (B) CXCL1 and (C) IL6. (D–I) Liver mRNAs were isolated and quantitated for expression of genes involved in inflammation and fibrosis: (D) MCP1, (E) tumor necrosis factor (TNF)-α, (F) interferon (IFN)-γ, (G) TIMP1, (H) collagen 1, and (I) matrix metalloprotease 9. Results are expressed as relative values compared with (A–I) WT or (J) TLR5fl/fl mice fed with regular chow, defined as 1. Data are the means ± SEM. N = 5–15. Significance was determined by the Student t test. *P < .05.
Figure 9
Figure 9
Antibiotic treatment prevents the exacerbation of high-fat diet–induced metabolic syndrome, steatosis, and fibrosis that resulted from loss of hepatocyte TLR5. TLR5fl/fl and TLR5ΔHep mice were fed with a regular chow diet or a HFD, comprising 60% fat, for 8 weeks, with or without broad-spectrum antibiotics (ampicillin/neomycin), administered via drinking water. (A) Analysis of 16S mRNA expression by quantitative RT-PCR in the liver of TLR5fl/fl and TLR5ΔHep mice. (B) Body weight, (C) fat-pad weights, (D) 15-hour fasting blood glucose concentration, and (E) liver weights were measured. (F and G) Liver lipid staining using Oil Red O with (F) representative images and (G) quantification shown. (H) Serum ALT concentrations. (I–L) Liver mRNAs were isolated and quantitated for expression of genes involved in inflammation and fibrosis: (I) tumor necrosis factor (TNF)-α, (J) TIMP1, (K) collagen 1, and (L) matrix metalloprotease 9. (M and N) Liver mRNAs were isolated and quantitated for expression of genes involved in inflammation: (M) MCP1 and (N) interferon (IFN)-γ. (O and P) Adipose tissue mRNAs were isolated and quantitated for expression of genes involved in inflammation: (O) CXCL1 and (P) IL6. Results are expressed as relative values compared with TLR5fl/fl mice fed a high-fat diet, defined as 1. (Q and R) Liver fibrosis estimation using Sirius red staining with (Q) representative images and (R) quantification shown. (S) Liver fibrosis estimation using Masson's trichrome staining with representative images shown. Scale bar: 50 μm. Data are the means ± SEM. N = 3–5. Significance was determined by the Student t test. *P < .05.

References

    1. Hooper L.V., Macpherson A.J. Immune adaptations that maintain homeostasis with the intestinal microbiota. Nat Rev Immunol. 2010;10:159–169. - PubMed
    1. Chassaing B., Darfeuille-Michaud A. The commensal microbiota and enteropathogens in the pathogenesis of inflammatory bowel diseases. Gastroenterology. 2011;140:1720–1728. - PubMed
    1. Xavier R.J., Podolsky D.K. Unravelling the pathogenesis of inflammatory bowel disease. Nature. 2007;448:427–434. - PubMed
    1. Sartor R.B. Microbial influences in inflammatory bowel diseases. Gastroenterology. 2008;134:577–594. - PubMed
    1. Cader M.Z., Kaser A. Recent advances in inflammatory bowel disease: mucosal immune cells in intestinal inflammation. Gut. 2013;62:1653–1664. - PubMed