. 2016 Dec 13:1:26.
doi: 10.12688/wellcomeopenres.10299.1.

ultraLM and miniLM: Locator tools for smart tracking of fluorescent cells in correlative light and electron microscopy

Affiliations

ultraLM and miniLM: Locator tools for smart tracking of fluorescent cells in correlative light and electron microscopy

Elisabeth Brama et al. Wellcome Open Res. .

Abstract

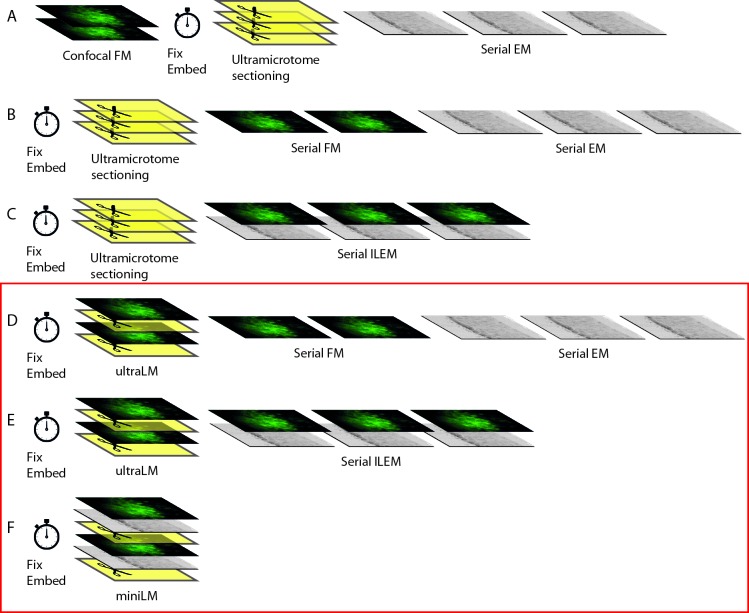
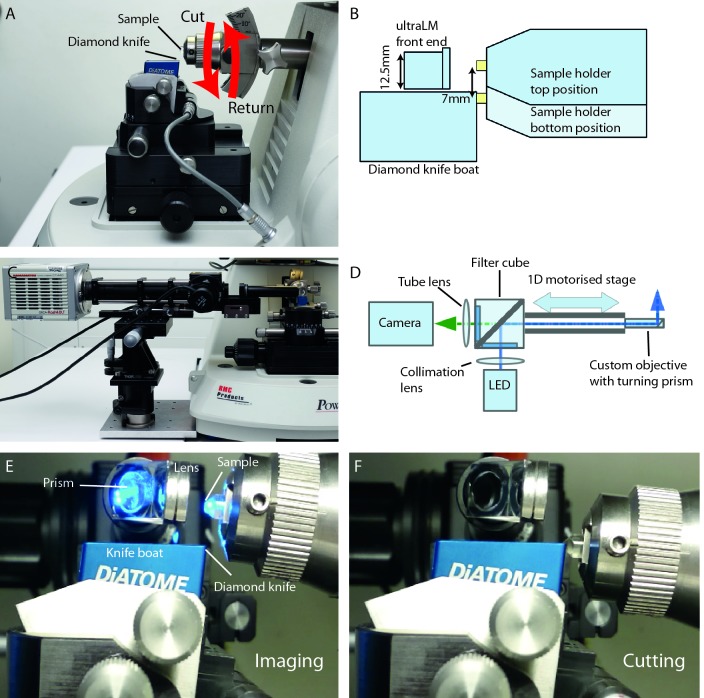
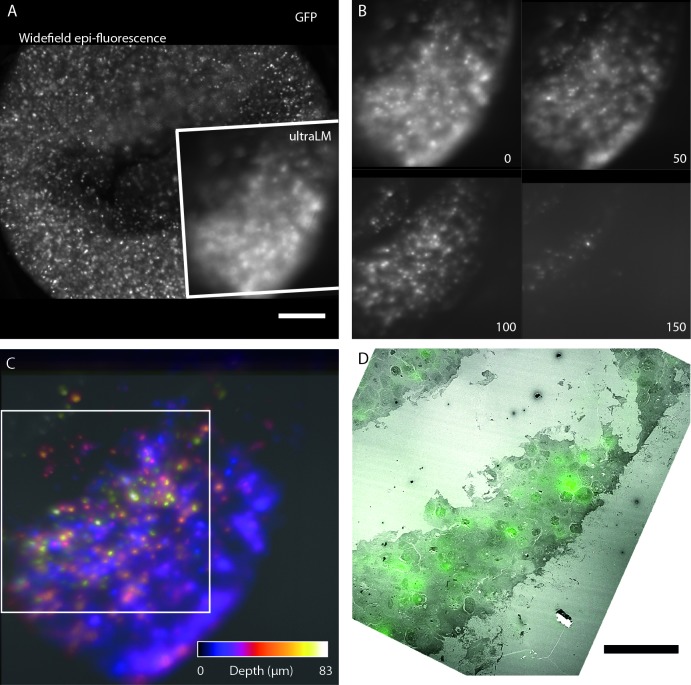
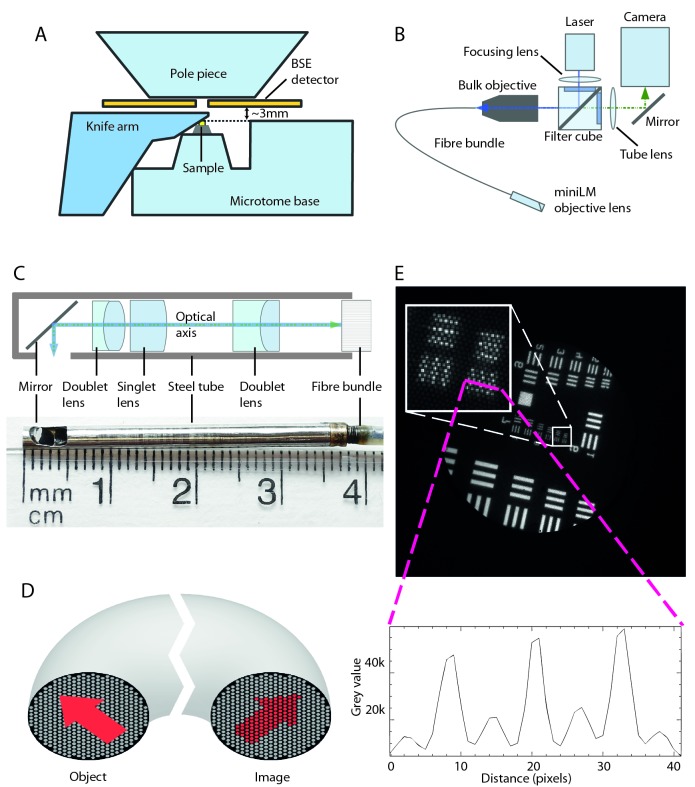
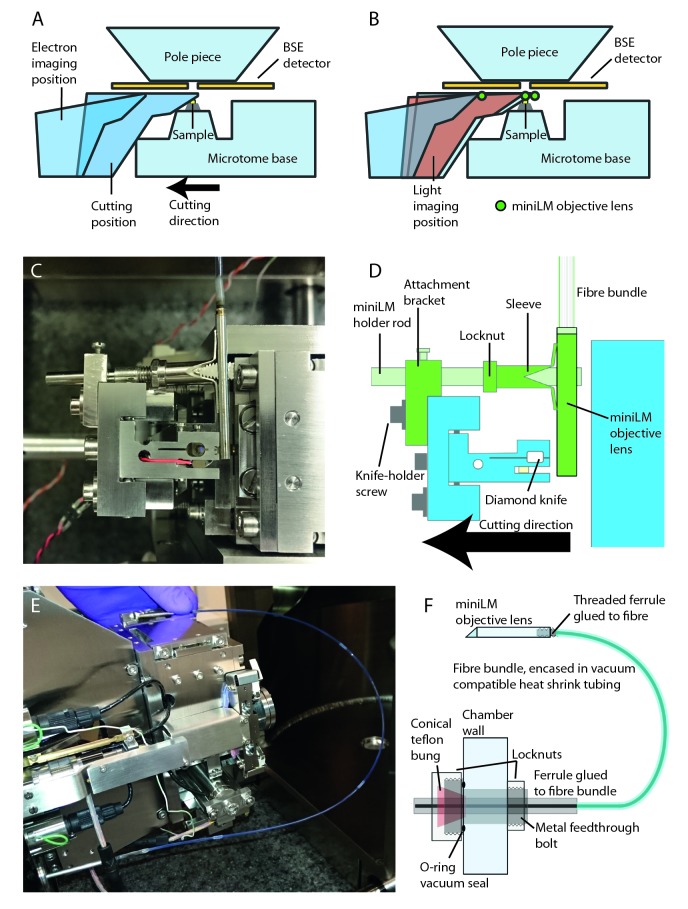
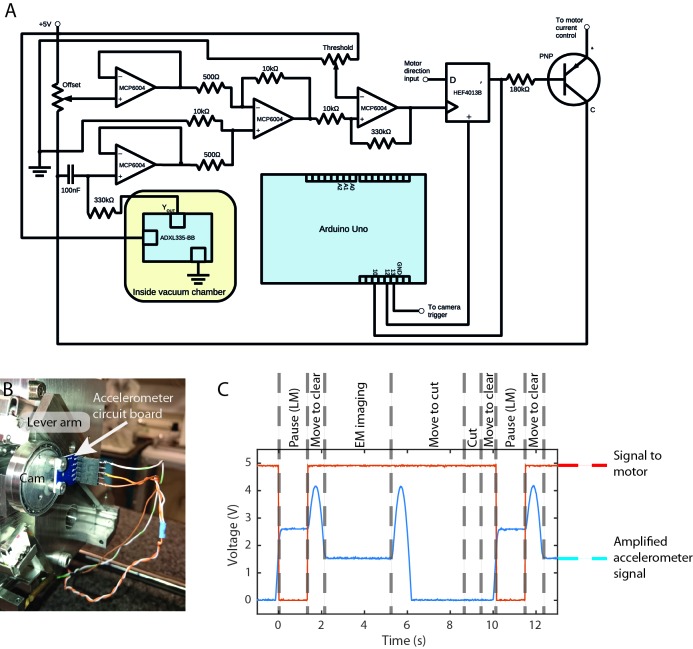
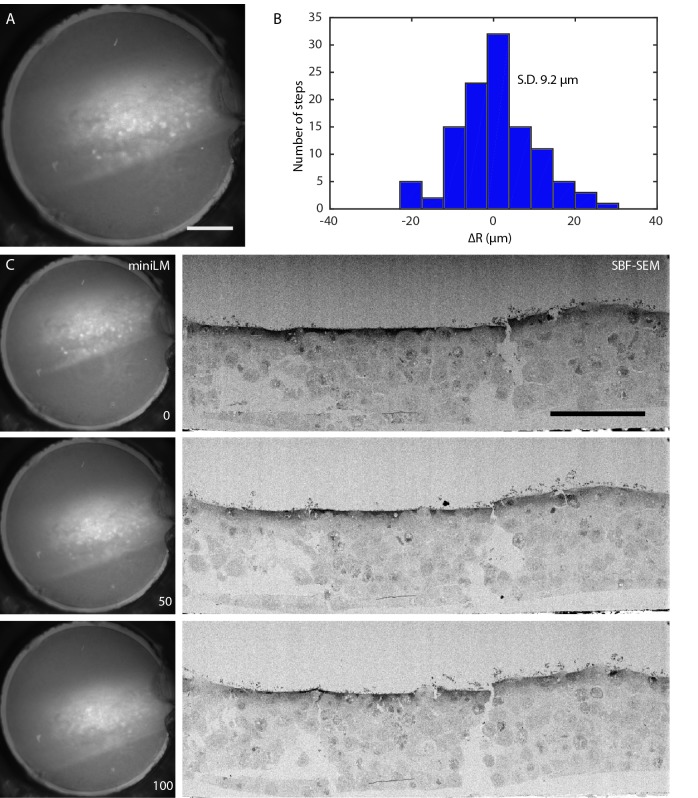
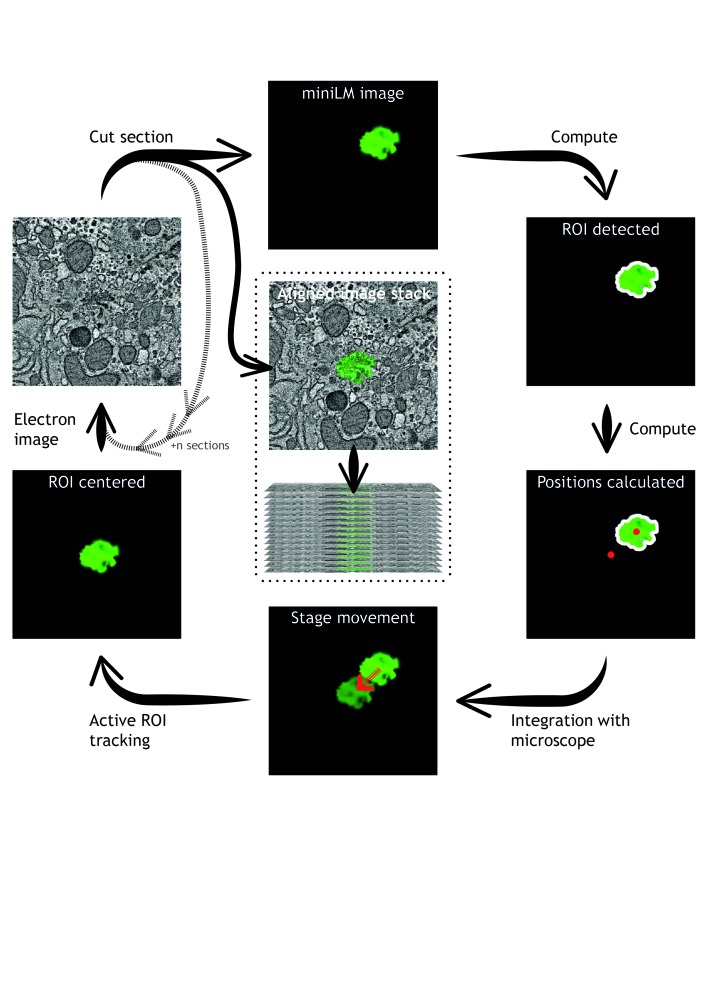
In-resin fluorescence (IRF) protocols preserve fluorescent proteins in resin-embedded cells and tissues for correlative light and electron microscopy, aiding interpretation of macromolecular function within the complex cellular landscape. Dual-contrast IRF samples can be imaged in separate fluorescence and electron microscopes, or in dual-modality integrated microscopes for high resolution correlation of fluorophore to organelle. IRF samples also offer a unique opportunity to automate correlative imaging workflows. Here we present two new locator tools for finding and following fluorescent cells in IRF blocks, enabling future automation of correlative imaging. The ultraLM is a fluorescence microscope that integrates with an ultramicrotome, which enables 'smart collection' of ultrathin sections containing fluorescent cells or tissues for subsequent transmission electron microscopy or array tomography. The miniLM is a fluorescence microscope that integrates with serial block face scanning electron microscopes, which enables 'smart tracking' of fluorescent structures during automated serial electron image acquisition from large cell and tissue volumes.

Keywords: CLEM; Correlative; GFP; In-resin fluorescence; Integrated; Locator tool; Serial block face SEM; Smart tracking; Ultramicrotome; miniLM; ultraLM.


Conflict of interest statement

No competing interests were disclosed.

Figures

Figure 1.
Figure 1.. Strategic development of fluorescent cell locator tools for automated correlative workflows.
New techniques presented in this manuscript are delineated by a red box. ( A) Pre-embedding CLEM workflow uses FM of hydrated cells/tissues, followed by resin-embedding and ultrathin sectioning and EM imaging. ( B) The IRF workflow preserves fluorophores, allowing post-embedding FM and EM on the same ultrathin section, thereby improving overlay accuracy. ( C) Correlation of fluorescent macromolecules to cellular structure can be further improved and automated by collecting FM and EM images sequentially, and without moving the sample, within an integrated microscope. ( DE) Integration of the ultraLM into an ultramicrotome enables ‘smart collection’ of sections containing fluorescent cells/tissues, for subsequent imaging in separate ( D) or integrated ( E) light and electron microscopes. Automated ‘smart tracking’ of fluorescent cells/tissues is achieved by integration of the miniLM into a SBF SEM ( F).
Figure 2.
Figure 2.. Build and integration of the ultraLM into an ultramicrotome.
( A) Side view of an ultramicrotome showing the relative positions of the sample and diamond knife. The motion of the sample is indicated with red arrows. Each time the sample goes through the ‘cut’ motion, an ultrathin section is removed from the blockface and floats onto water. ( B) Schematic of the FM imaging position showing the space limitations around the knife and sample, and the position of the ultraLM customised lens. ( C) Front view of the ultraLM microscope showing the mounting of the apparatus onto a custom plate bolted to the base of the microtome. ( D) Schematic highlighting the main components and the optical path of the ultraLM. ( EF) Close-up side view of the ultraLM during operation, showing the imaging ( E) and cutting positions ( F).
Figure 3.
Figure 3.. Fluorescence imaging during ultramicrotomy with the ultraLM.
Proof-of-principle ultraLM operation was demonstrated using IRF blocks containing HeLa cells expressing GFP-H2B. ( A) Low magnification widefield epi-fluorescence image of the blockface before sectioning, with inset showing the region imaged by the ultraLM. Scale bar 200 µm. ( B) Blockface images acquired with the ultraLM, from a serial imaging and cutting run. Every 50 th image is shown, at a Z separation of 25 µm. Sectioning was performed at 500 nm thickness with a diamond knife. ( C) Depth-coded maximum intensity projection of image stack shown in panel B, indicating positions of cells within the resin. White box delineates region of overlay of the final blockface image of GFP-H2B expressing cells (green) onto the last section cut from the block and imaged in a TEM ( D), showing that the ultraLM image can be used to locate fluorescent cells during sectioning. Scale bar 100 µm.
Figure 4.
Figure 4.. Miniaturisation of FM to create the miniLM for SBF SEM integration.
( A) Schematic of the interior of the 3View SBF SEM chamber showing relative positions of major components and the location of the 3 mm gap between the top of the sample and the bottom of the BSE detector. ( B) Schematic of the optical arrangement of the miniLM. ( C) Schematic of the custom lens in the miniLM alongside a photograph showing the physical dimensions. The miniature microscope objective is attached to the end of a coherent fibre bundle, which serves to feed the image out of the vacuum chamber. ( D) Schematic of the coherent fibre bundle. An image presented to the proximal end of the fibre is relayed in a spatially coherent manner to the distal end. Note the resultant pixellation of the image due to the finite number of fibre cores. ( E) Transmission image of a USAF target to demonstrate the resolution of the miniLM. The smallest lines on the target are 2.18 µm wide with equal separation distance, which we were able to resolve. The inset shows a line profile taken through the lines of Group 7, Element 6 of the USAF resolution target, confirming a resolution of better than 2.18 µm. The smaller background peaks were caused by the pixellation due to the discrete fibre cores. The target was illuminated with a white light LED through an objective of similar NA to the miniature objective.
Figure 5.
Figure 5.. Physical integration of the miniLM with the SBF SEM.
( A) Schematic of the interior of the SBF SEM showing the knife arm in the cutting position and the electron imaging position. ( B) Addition of an intermediate position at which the motion is paused to enable FM imaging with the miniLM, which is denoted by a green circle, as viewed in cross-section. ( C) Photograph of the SBF SEM knife-holder region viewed from above, described further in schematic ( D), indicating the SBF SEM microtome parts (in blue) and the custom miniLM parts (in green). ( E) Photograph showing the custom vacuum feedthrough and fibre bundle in-situ, described further in schematic ( F). The airtight vacuum feedthrough is based around a modified Swagelok style compression fitting inserted into an existing bolt hole in the SBF SEM door.
Figure 6.
Figure 6.. Electronic integration of the miniLM with the SBF SEM.
( A) Circuit diagram of the electronic circuit and Arduino interface used to integrate the miniLM into the SBF SEM. ( B) Accelerometer chip mounted on the microtome cam. ( C) Signal behaviour during the cutting and imaging cycle for the accelerometer and motor current. Note that the accelerometer signal has been amplified for increased sensitivity in the region of motion of interest, causing saturation and clipping at 0 V for part of the cycle.
Figure 7.
Figure 7.. Automated in vacuo serial LM-EM imaging using the miniLM.
( A) Low magnification raw image of the distal end of the fibre bundle, showing that the miniLM resolves individual GFP-H2B expressing HeLa cells. Scale bar 100 µm. ( B) Histogram showing the distribution of the inter-step deviation of the miniLM acquisition position, with a standard deviation of 9.2 µm. ( C) Sequence of raw miniLM images and matching electron images of the cell layer, showing every 50 th image from an automated serial LM-EM imaging and cutting run, demonstrating that the miniLM can detect fluorescent cells in vacuo during an SBF SEM data acquisition. Scale bar 100 µm.
Figure 8.
Figure 8.. Automation of integrated 3D light and electron microscopy using the miniLM.
Advances in automated algorithms that detect fluorescent cells in miniLM images will enable smart tracking of regions of interest during an SBF SEM data acquisition.

References

    1. Abraham ER, Cornell EA: Teflon feedthrough for coupling optical fibers into ultrahigh vacuum systems. Appl Opt. 1998;37(10):1762–1763. 10.1364/AO.37.001762 - DOI - PubMed
    1. Agronskaia AV, Valentijn JA, van Driel LF, et al. : Integrated fluorescence and transmission electron microscopy. J Struct Biol. 2008;164(2):183–189. 10.1016/j.jsb.2008.07.003 - DOI - PubMed
    1. Bell K, Mitchell S, Paultre D, et al. : Correlative imaging of fluorescent proteins in resin-embedded plant material. Plant Physiol. 2013;161(4):1595–1603. 10.1104/pp.112.212365 - DOI - PMC - PubMed
    1. Brama E, Peddie CJ, Wilkes G, et al. : X, Y displacement in miniLM [Data set]. Zenodo. 2016a. Data Source - DOI
    1. Brama E, Peddie CJ, Wilkes G, et al. : ultraLM and miniLM: Locator tools for smart tracking of fluorescent cells in correlative light and electron microscopy [Data set]. Zenodo. 2016b. Data Source - DOI - PMC - PubMed

LinkOut - more resources