. 2017 Nov;78(5):1767-1780.
doi: 10.1002/mrm.26575. Epub 2017 Jan 16.

Analysis of the effects of noise, DWI sampling, and value of assumed parameters in diffusion MRI models

Affiliations

Analysis of the effects of noise, DWI sampling, and value of assumed parameters in diffusion MRI models

Elizabeth B Hutchinson et al. Magn Reson Med. 2017 Nov.

Abstract

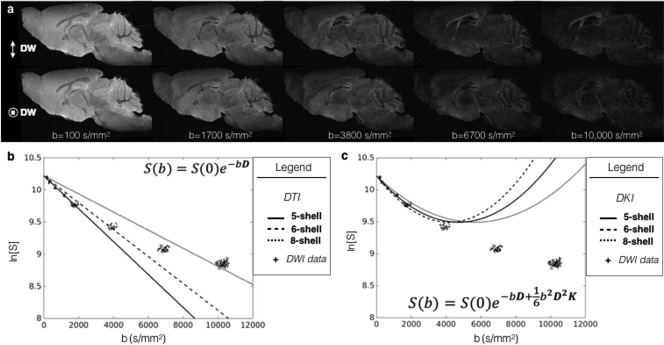
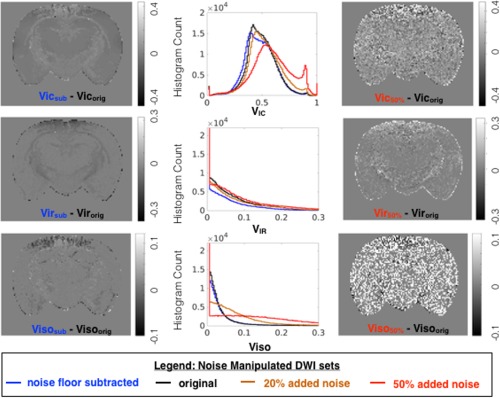
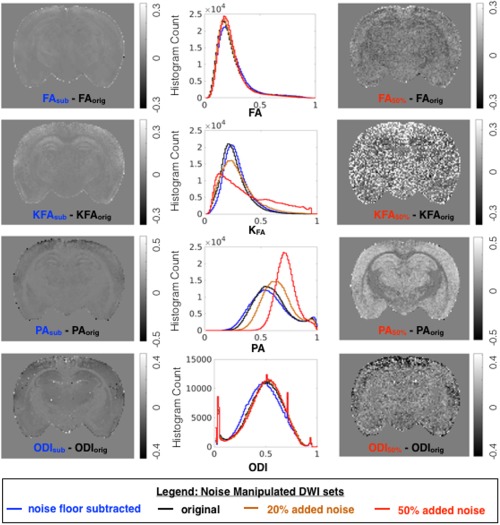
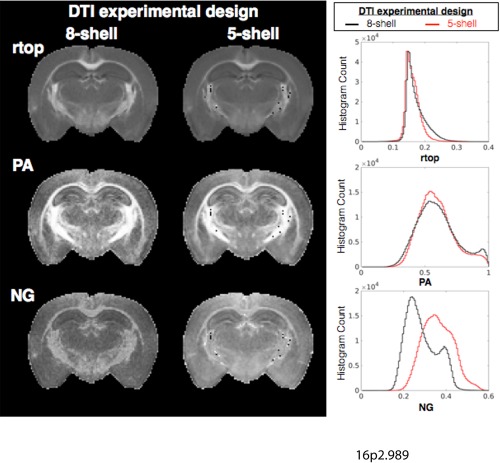
Purpose: This study was a systematic evaluation across different and prominent diffusion MRI models to better understand the ways in which scalar metrics are influenced by experimental factors, including experimental design (diffusion-weighted imaging [DWI] sampling) and noise.

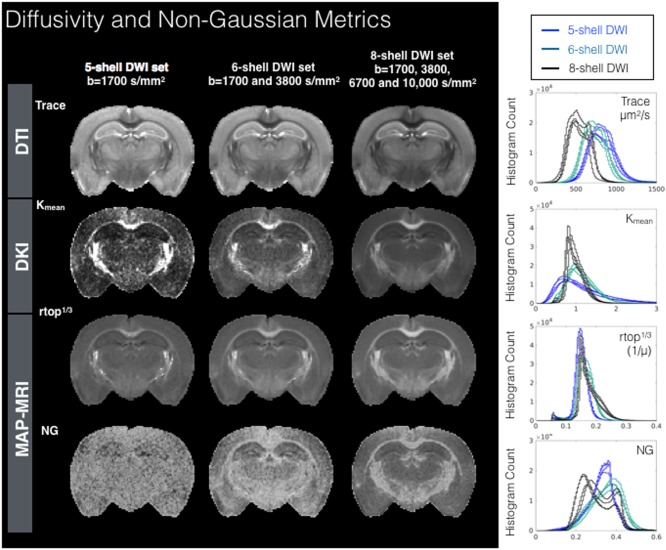
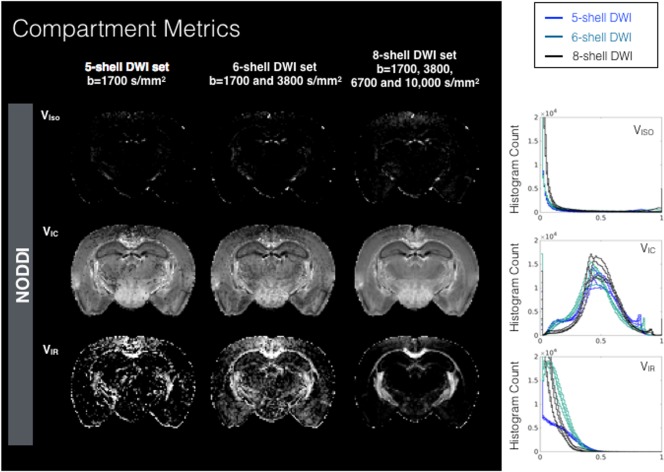
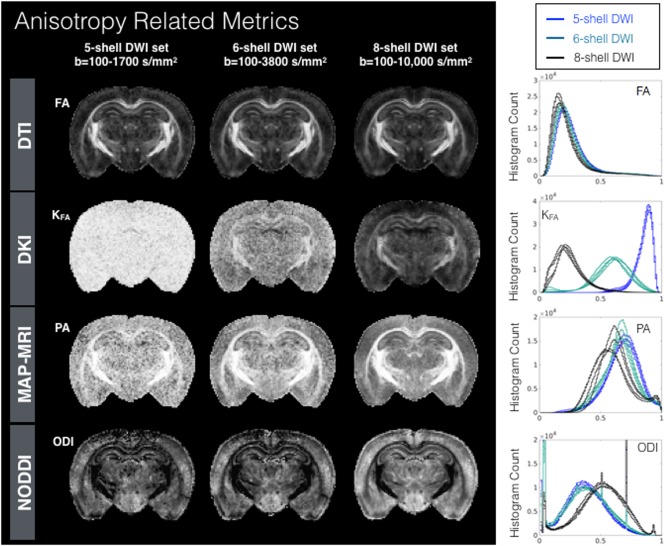
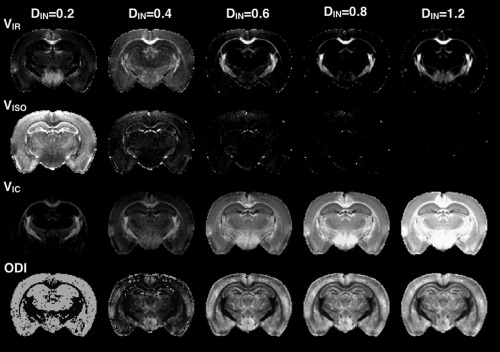
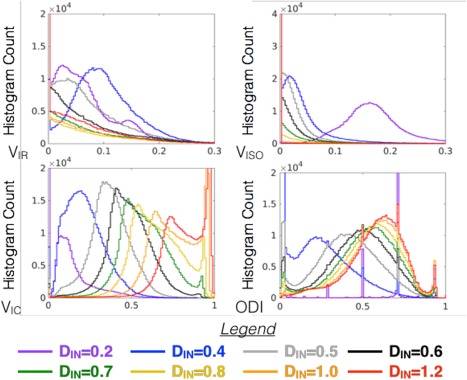
Methods: Four diffusion MRI models-diffusion tensor imaging (DTI), diffusion kurtosis imaging (DKI), mean apparent propagator MRI (MAP-MRI), and neurite orientation dispersion and density imaging (NODDI)-were evaluated by comparing maps and histogram values of the scalar metrics generated using DWI datasets obtained in fixed mouse brain with different noise levels and DWI sampling complexity. Additionally, models were fit with different input parameters or constraints to examine the consequences of model fitting procedures.

Results: Experimental factors affected all models and metrics to varying degrees. Model complexity influenced sensitivity to DWI sampling and noise, especially for metrics reporting non-Gaussian information. DKI metrics were highly susceptible to noise and experimental design. The influence of fixed parameter selection for the NODDI model was found to be considerable, as was the impact of initial tensor fitting in the MAP-MRI model.

Conclusion: Across DTI, DKI, MAP-MRI, and NODDI, a wide range of dependence on experimental factors was observed that elucidate principles and practical implications for advanced diffusion MRI. Magn Reson Med 78:1767-1780, 2017. © 2017 International Society for Magnetic Resonance in Medicine.

Keywords: DWI sampling; diffusion kurtosis imaging; diffusion tensor imaging; mean apparent propagator MRI; neurite orientation dispersion and density imaging; noise floor bias.


Figures

Figure 1
Figure 1
Diffusion weighting and the MRI signal for the fixed mouse brain. (a) Diffusion‐weighted images are shown for a representative sagittal slice in the fixed mouse brain across a range of b‐values (b = 100‐10,000 s/mm2) with gradient directions along the dorsal‐ventral axis (top row) and left‐right axis (bottom row). (b) To demonstrate the relationship between DWI data and the diffusion model, the mean signal value within a region of gray matter is plotted for each DWI volume against the b‐value at which the image was acquired. Theoretical curves are also plotted for the diffusion model fit with the five‐, six‐, and eight‐shell DWI sampling schemes used in this study. (c) The same DWI data as in panel b is plotted with the theoretical curves for diffusion kurtosis imaging fit with each of the DWI sampling scheme sets.
Figure 2
Figure 2
Metric maps and histograms for DTI, DKI, and MAP‐MRI models fit using diffusion weighted data from three sampling schemes having five, six, and eight shells. Maps are shown for a representative slice for each DWI sampling scheme and whole brain density histogram plots are shown (right column) for each of four mouse brain samples. Abbreviations: Kmean, mean kurtosis; NG, non‐Gaussianity; rtop, return to the origin probability.
Figure 3
Figure 3
Metric maps and histograms for compartmental fractions from the NODDI model fit using DWIs from different sampling schemes having five, six, and eight shells. Maps are shown for representative slice for each DWI sampling scheme and whole brain density histogram plots (right column) for each of the four mouse brain samples are shown. Abbreviations: VIC, intracellular volume fraction; VIR, intracellular “restricted” volume fraction; VISO, isotropic volume fraction.
Figure 4
Figure 4
Metric maps and histograms to probe water anisotropy for DTI, DKI, MAP‐MRI, and NODDI models fit using diffusion‐weighted data from three sampling schemes having five, six, and eight shells and density histogram plots (right column) for each metric in four mouse brain samples show the distribution of metric values. PDF histograms are normalized bin counts of metric values (x‐axis) and CDF histograms are the cumulative normalized bin counts for the metric value. Abbreviations: FA, fractional anisotropy; KFA, kurtosis FA; ODI, orientation dispersion index; PA, propagator anisotropy.
Figure 5
Figure 5
Effects of signal transformation and added noise for metric maps related to diffusivity and non‐Gaussianity. For each metric, whole brain histograms are shown for modeling of the original DWI dataset (black) and of the same dataset following noise floor subtraction (blue), addition of 20% or 50% rectified noise (orange and red, respectively). To visualize the localization of metric differences resulting from noise manipulation, difference maps are shown for the same slice.
Figure 6
Figure 6
Effects of signal transformation and added noise for metric maps for compartmental fractions from the NODDI model. For each metric, whole brain histograms are shown for modeling of the original DWI dataset (black) and of the same dataset following noise floor subtraction (blue), addition of 20% or 50% rectified noise (orange and red, respectively). To visualize the localization of metric differences resulting from noise manipulation, difference maps are shown for the same slice.
Figure 7
Figure 7
Effects of modeling DWI data after signal transformation (blue) and added noise (orange, 20%; red, 50%) were compared with modeling of the original DWI dataset (black) across anisotropy metrics from DTI, DKI, MAP‐MRI, and NODDI. Whole brain histograms report the distribution of each metric generated from datasets, and difference maps are shown to compare and localize metric value changes due to noise manipulation.
Figure 8
Figure 8
Effects of the fixed parameter Din on the NODDI metrics maps of VIR, VISO, VIC, and ODI are shown by representative slices from metric maps generated for the same DWI dataset following NODDI modeling with different values for DIN.
Figure 9
Figure 9
Whole brain histograms for compartmental and orientation compare the distribution of metric values generated by NODDI modeling over a range of DIN values corresponding to the maps shown in Figure 8.
Figure 10
Figure 10
The effects of initial tensor estimation on MAP‐MRI metrics. Maps of rtop, PA, and NG are shown for the same slice after MAP modeling performed using an estimate for the diffusion tensor based on all DWIs (eight‐shell, left column) or based on only low b‐value DWIs (five‐shell, right column). Whole brain histograms are also shown to report systematic differences in MAP‐MRI metrics that are the consequence of the initial tensor fitting. Abbreviations: NG, non‐Gaussianity; PA, propagator anisotropy; rtop, return to the origin probability.

References

    1. Basser PJ, Mattiello J, LeBihan D. MR diffusion tensor spectroscopy and imaging. Biophys J 1994;66:259–267. - PMC - PubMed
    1. Pierpaoli C, Jezzard P, Basser PJ, Barnett A, Di Chiro G. Diffusion tensor MR imaging of the human brain. Radiology 1996;201:637–648. - PubMed
    1. Jensen JH, Helpern JA, Ramani A, Lu H, Kaczynski K. Diffusional kurtosis imaging: the quantification of non‐Gaussian water diffusion by means of magnetic resonance imaging. Magn Reson Med 2005;53:1432–1440. - PubMed
    1. Tabesh A, Jensen JH, Ardekani BA, Helpern JA. Estimation of tensors and tensor‐derived measures in diffusional kurtosis imaging. Magn Reson Med 2011;65:823–836. - PMC - PubMed
    1. Tournier JD, Calamante F, Gadian DG, Connelly A. Direct estimation of the fiber orientation density function from diffusion‐weighted MRI data using spherical deconvolution. NeuroImage 2004;23:1176–1185. - PubMed

Publication types

LinkOut - more resources