. 2017 Nov;37(11):3599-3614.
doi: 10.1177/0271678X16685573. Epub 2017 Jan 16.

Functional deficits induced by cortical microinfarcts

Affiliations

Functional deficits induced by cortical microinfarcts

Philipp M Summers et al. J Cereb Blood Flow Metab. 2017 Nov.

Abstract

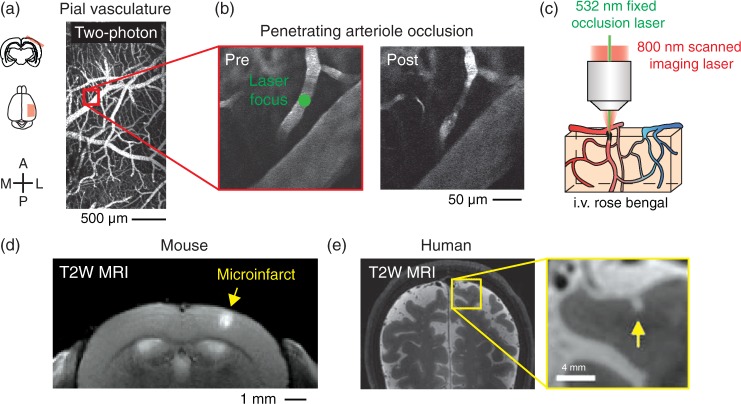
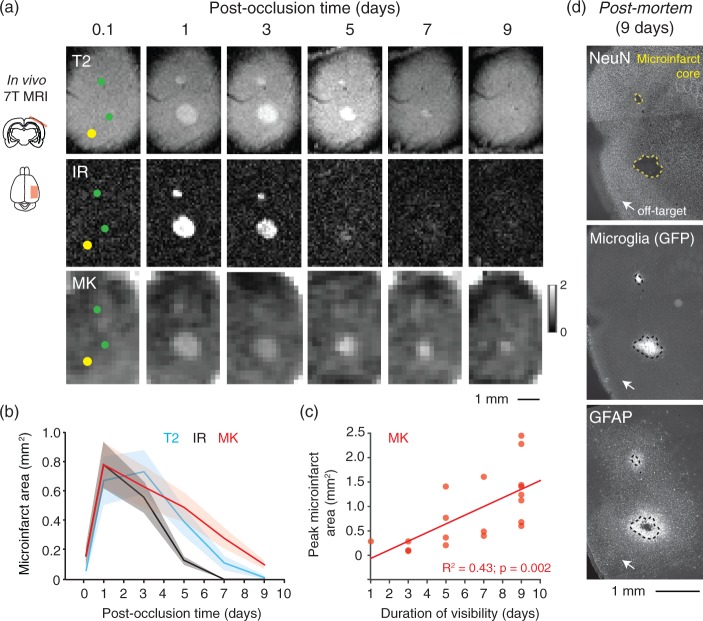
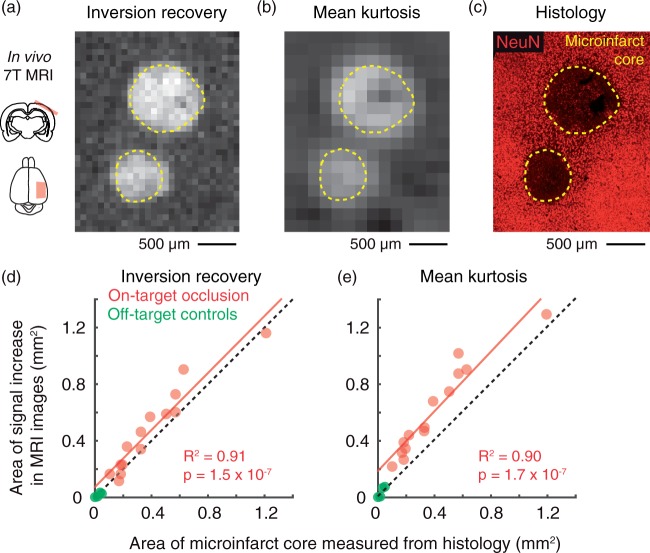
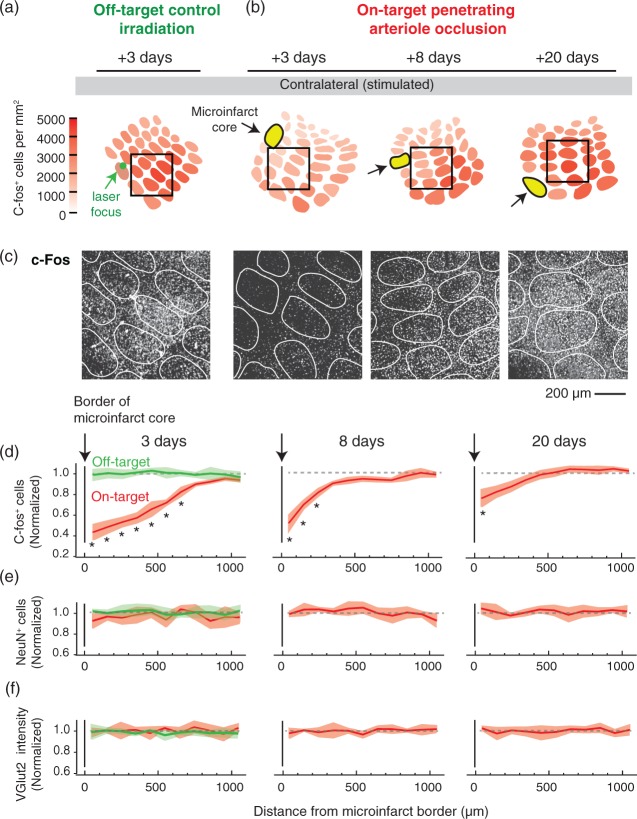
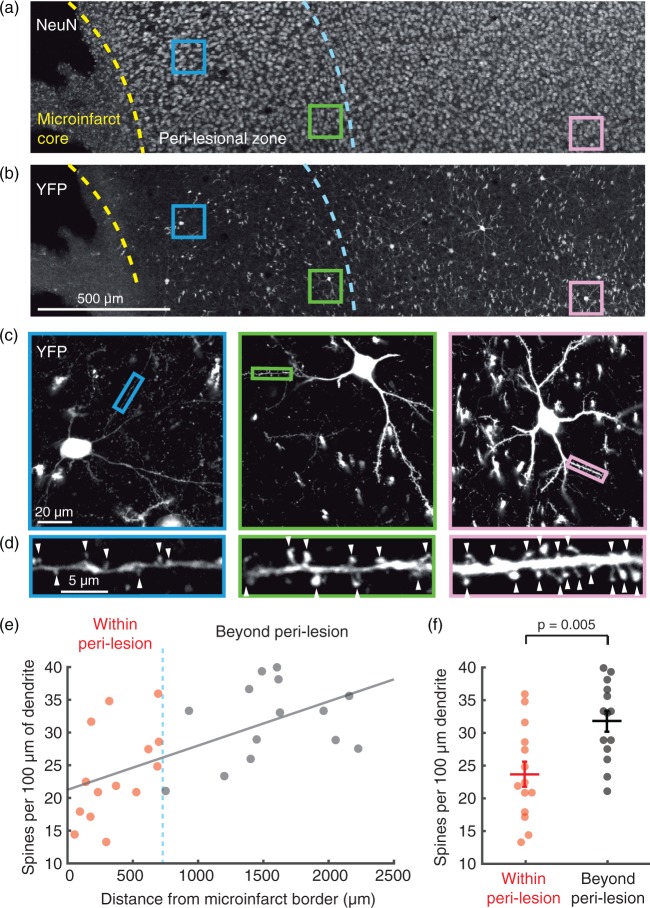
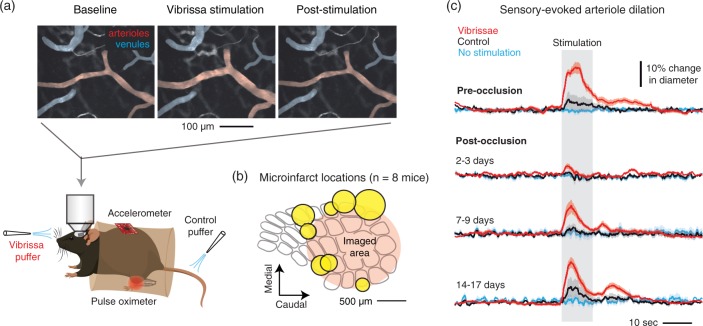
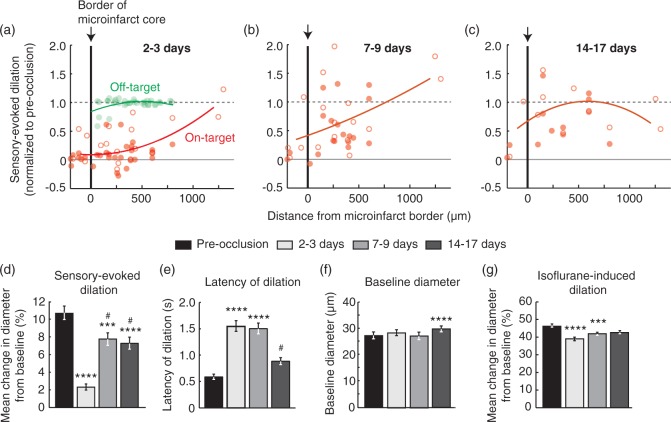
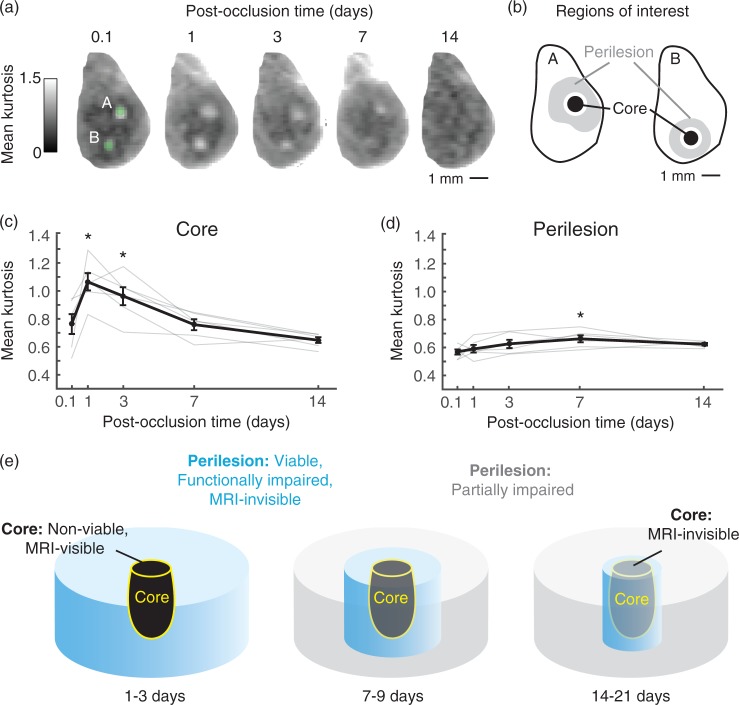
Clinical studies have revealed a strong link between increased burden of cerebral microinfarcts and risk for cognitive impairment. Since the sum of tissue damage incurred by microinfarcts is a miniscule percentage of total brain volume, we hypothesized that microinfarcts disrupt brain function beyond the injury site visible to histological or radiological examination. We tested this idea using a mouse model of microinfarcts, where single penetrating vessels that supply mouse cortex were occluded by targeted photothrombosis. We found that in vivo structural and diffusion MRI reliably reported the acute microinfarct core, based on spatial co-registrations with post-mortem stains of neuronal viability. Consistent with our hypothesis, c-Fos assays for neuronal activity and in vivo imaging of single vessel hemodynamics both reported functional deficits in viable peri-lesional tissues beyond the microinfarct core. We estimated that the volume of tissue with functional deficit in cortex was at least 12-fold greater than the volume of the microinfarct core. Impaired hemodynamic responses in peri-lesional tissues persisted at least 14 days, and were attributed to lasting deficits in neuronal circuitry or neurovascular coupling. These data show how individually miniscule microinfarcts could contribute to broader brain dysfunction during vascular cognitive impairment and dementia.

Keywords: Microinfarcts; microcirculation; neurovascular coupling; two-photon microscopy; vascular cognitive impairment.


Figures

Figure 1.
Figure 1.
Modeling of microinfarcts in mice by optical occlusion of single cortical penetrating arterioles in vivo. (a) Wide-field two-photon imaging of the pial vasculature through a thinned-skull cranial window. A = anterior, L = lateral, P = posterior, M = medial. (b) High-resolution imaging and focal photothrombotic occlusion of a single penetrating arteriole. Green circle shows location of focused 532 nm laser irradiation. (c) Cartoon describing focal 532 nm laser activation of circulating Rose Bengal dye in targeted arterioles. Imaging is performed with an 800 nm scanned Ti-sapphire laser. (d) Coronal view of microinfarct resulting from occlusion of a single penetrating arteriole, viewed with T2-weighted 7 T MRI 24 h post-occlusion. (e) A cortical microinfarct identified in the living human brain using T2-weighted 7 T MRI. Data reproduced with permission from van Veluw et al.
Figure 2.
Figure 2.
MRI signals associated with evolution of microinfarct pathology. (a) Longitudinal imaging of two microinfarcts using IR, T2 and DKI (MK) sequences. Lower green circle shows location of a penetrating arteriole occlusion. Upper green circle shows location of penetrating venule occlusion. Yellow circle is the location of a control off-target irradiation. (b) Area of microinfarcts plotted as function of post-occlusion time. We detected a statistically significant difference between imaging sequences (p = 0.01 main effect F(2,38) = 5.2; two-way ANOVA with repeated measures). Tukey post hoc analysis revealed differences between T2 versus IR at three days (p = 0.003) and five days (p < 0.001), MK versus T2 at seven days (p = 0.003), and MK and IR at five days (p < 0.001) and seven days (p < 0.001). Data are mean ± SEM. Panels b and c comprise data from n = 12 penetrating arteriole and n = 8 penetrating venule occlusions over seven mice. (c) Larger microinfarcts exhibit longer durations of visibility with DKI (p = 0.002, R2 = 0.43, Pearson’s correlation). (d) Post-mortem histology of mouse shown in panel (a). NeuN immunostaining shows the extent of the microinfarct core (yellow dotted line). GFP-labeled microglia intrinsic to the transgenic mouse used (CX3CR1-GFP+/−) and GFAP immunostain show the extent of neuroinflammation in surrounding tissues.
Figure 3.
Figure 3.
MRI reports the acute microinfarct core. (a,b) IR and MK image of two microinfarcts 24 h after penetrating vessel occlusion. The upper and lower microinfarcts have resulted from arteriole and venular occlusions, respectively. (c) Mice were sacrificed for post-mortem histology immediately following MRI. NeuN staining was performed to identify the extent of the microinfarct core (yellow dotted line). (d, e) Scatterplot of microinfarct area measured in histology versus area of the same microinfarct measured in vivo with IR (p = 1.5 × 10−7, R2 = 0.91; Pearson’s correlation) or DKI (p = 1.7 × 10−7, R2 = 0.90; Pearson’s correlation). Data are from n = 8 penetrating arteriole and n = 6 penetrating venule occlusions over eight mice. Green data points correspond to microinfarcts generated by off-target control irradiations.
Figure 4.
Figure 4.
Disruption of neural activity in the peri-lesional tissues surrounding microinfarcts. (a, b) Focal photothrombosis is targeted away from a penetrating arteriole (green; off-target) or directly atop a penetrating arteriole (red; on-target). C-Fos expression in response to whisker stimulation was examined 3, 8, and 20 days following microinfarct induction. Microinfarcts were strategically placed such that their peri-lesional region overlapped with the primary barrel cortex. (c) Example images of c-Fos staining in barrel cortex. The relative location of each image is shown in insets of panels (a) and (b) (black square, 800 × 800 µm area). (d) The number of c-Fos-positive cells decreased in peri-lesional tissues, with the greatest change in the acute time-frame of three days after occlusion (p = 0.002 main effect, F(1.97,3.93) = 135.6, one-way ANOVA with repeated measures; *p < 0.05, compared to 1000 µm bin with Tukey post hoc analysis). This decrease in c-Fos is not seen with off-target control irradiations (green). While gradual recovery of activity was observed, persistent deficits were detected eight days (p = 0.006 main effect, F(1.38, 2.76) = 59.73, one-way ANOVA with repeated measures) and 20 days after onset (p = 0.006 main effect, F(1.67, 3.34) = 34.56, one-way ANOVA with repeated measures). For all data, c-Fos-positive cell counts were normalized to the averaged cell counts obtained from the barrel cortex of three stimulated, but sham treated C57BL/6 mice (no Rose Bengal but laser irradiation). Data are mean ± SEM. Panels (d) to (f) comprise data from n = 3 mice (each with one penetrating arteriole occlusion) for each post-occlusion time-point and the off-target control. (e, f) No change in NeuN-positive cell number or VGlut2 intensity was detected in peri-lesional tissues. Data is mean ± SEM.
Figure 5.
Figure 5.
Dendritic spine density is decreased in peri-lesional tissues. (a) Two days post-occlusion, absence of NeuN staining demarcates the microinfarct core, the border of which is traced with a yellow dashed line. Viable neurons exist beyond the microinfarct core, evidenced by robust NeuN staining, but C-fos studies in Figure 4 demonstrated functional deficits up to 700 um beyond the core (blue dashed line). (b) In the same slice, YFP brightly labels layer 2/3 cortical neurons and their processes. Colored squares highlight example YFP and NeuN-positive pyramidal neurons that were selected for high resolution imaging of dendrites. (c) High resolution confocal microscopy of dendrites. Images shown are 30 µm average intensity projections. Small colored rectangles indicate a typical dendritic segment used for spine counting. (d) Individual spines were manually counted along isolated dendritic segments (arrowheads), and divided by the length of dendritic segment analyzed to provide a measure of spine density. An average spine density for each neuron (n = 28 neurons in total) was calculated from several dendritic segments. (e) Mean spine density per neuron versus the neuron’s distance from the microinfarct core. Spine density decreases closer to the microinfarct core (Pearson, R2 = 0.38, p = 0.0005). (f) Cells within the peri-lesional region show a significant ∼25% decrease in spine density compared to cells beyond the peri-lesional region (n = 14 neurons/group compiled over two mice, p = 0.005 by Wilcoxon Rank-sum test). Data are mean ± SEM.
Figure 6.
Figure 6.
Arteriole reactivity following strategic placement of microinfarcts in barrel cortex. (a) Awake, head-fixed mice were imaged with two-photon microscopy to examine pial and penetrating arteriole dilation in response to whisker stimulation, i.e. functional hyperemia. As a control for general arousal, air puffs were delivered to the tail. (b) In each mouse (n = 8), a single microinfarct was strategically placed to flank the primary barrel cortex. The positions of all eight microinfarcts (yellow) are shown as a composite. (c) Sensory-evoked arteriole dilation pre-occlusion and at various periods following penetrating arteriole occlusion. N = 36 arterioles (15 surface arterioles, 21 penetrating arterioles) over eight mice. Data are mean ± SEM.
Figure 7.
Figure 7.
Disruption of single-vessel hemodynamics in peri-lesional tissues surrounding microinfarcts. (a–c) Sensory-evoked dilation as a function of distance from the microinfarct core (red; n = 50, 36, and 24 arterioles over six mice for panels a, b, and c, respectively). Open circles represent surface arterioles, and filled circles represent penetrating arterioles. An off-target control group showed no change in dilatory function beyond the region of photothrombotic irradiation (green in panel a; n = 33 arterioles over three mice). Lines correspond to second order polynomial regression fits of the data. (d) Mean change in diameter during whisker stimulation over a group of arterioles that could be measured repeatedly over all time-points (p < 0.0001 main effect, Friedman statistic = 82.1, Friedman test with repeated measures; Dunn’s post hoc yields ****p < 0.0001 or ***p < 0.001, compared to pre-occlusion, and #p < 0.05, compared to 2 to 3 days; n = 36 arterioles over six mice). Data are mean ± SEM. (e) Latency to peak dilation after onset of stimulation (p < 0.0001 main effect, Friedman statistic = 82.6, Friedman test with repeated measures; Dunn’s post hoc yields ****p < 0.0001, compared to pre-occlusion, and #p < 0.05, compared to 2 to 3 days and 7 to 9 days). (f) Baseline diameter of arterioles prior to stimulation. (p < 0.0001 main effect, F(2.42,84.58) = 8.96, one-way ANOVA with repeated measures; Tukey’s post hoc yields ****p < 0.0001, compared to pre-occlusion). (g) Mean change in diameter after inhalation of vasodilating anesthetic isoflurane (3% MAC in air) (p < 0.0001 main effect, Friedman statistic = 39.9, Friedman test with repeated measures; Dunn’s post hoc yields ****p < 0.0001 or ***p < 0.001, compared to pre-occlusion).
Figure 8.
Figure 8.
Core versus peri-lesional changes and relation to MRI signal. (a) Two arteriole microinfarcts imaged with DKI over a span of 14 days post-occlusion. (b) MK was quantified in core and peri-lesional regions. The regions of interest were selected from a time-point of peak microinfarct visibility (typically one day post-occlusion) and applied to all other time-points. See Materials and Methods for additional details. (c) MK of the microinfarct core plotted as a function of post-occlusion time (p = 0.0001 main effect, F(4, 20) = 15.86, one-way ANOVA with repeated-measures; Tukey post hoc yields *p < 0.05, compared to 0.1, 7, and 14 days; n = 6 arteriole microinfarcts over three mice). Data = mean ± SEM. (d) Mean kurtosis of peri-lesional tissues for the same microinfarcts plotted as a function of post-occlusion time. (*p = 0.02 main effect, F(4, 20) = 3.59, one-way ANOVA with repeated-measures; Tukey post hoc yields *p < 0.05, compared to 0.1 day). Data = mean ± SEM. (e) Evolution of acute microinfarct pathology. At 1–3 days post-occlusion, the non-viable core is visible to both structural (T2/IR) and diffusion MRI. Peri-lesional tissues remain viable, but are functionally impaired and insufficiently detected by MRI. At 7–9 days, the core is detectable only to diffusion MRI. The peri-lesional tissues begin to recover in function, and show a modest increase in MK relative to earlier time-points. At 14–21 days, the core is no longer visible to MRI, and peri-lesional tissues exhibit only partial responsiveness to sensory input.

References

    1. Gorelick PB, Scuteri A, Black SE, et al. Vascular contributions to cognitive impairment and dementia: A statement for healthcare professionals from the American Heart Association/American Stroke Association. Stroke 2011; 42: 2672–713. - PMC - PubMed
    1. Iadecola C. The pathobiology of vascular dementia. Neuron 2013; 80: 844–866. - PMC - PubMed
    1. Brundel M, de Bresser J, van Dillen JJ, et al. Cerebral microinfarcts: A systematic review of neuropathological studies. J Cereb Blood Flow Metab 2012; 32: 425–436. - PMC - PubMed
    1. Smith EE, Schneider JA, Wardlaw JM, et al. Cerebral microinfarcts: The invisible lesions. Lancet Neurol 2012; 11: 272–282. - PMC - PubMed
    1. Kapasi A, Schneider JA. Vascular contributions to cognitive impairment, clinical Alzheimer's disease, and dementia in older persons. Biochim Biophys Acta 2016; 1862: 878–886. - PMC - PubMed

MeSH terms

Substances

LinkOut - more resources