. 2017 Jan 16:7:40381.
doi: 10.1038/srep40381.

Binding of N-methylscopolamine to the extracellular domain of muscarinic acetylcholine receptors

Affiliations

Binding of N-methylscopolamine to the extracellular domain of muscarinic acetylcholine receptors

Jan Jakubík et al. Sci Rep. .

Abstract

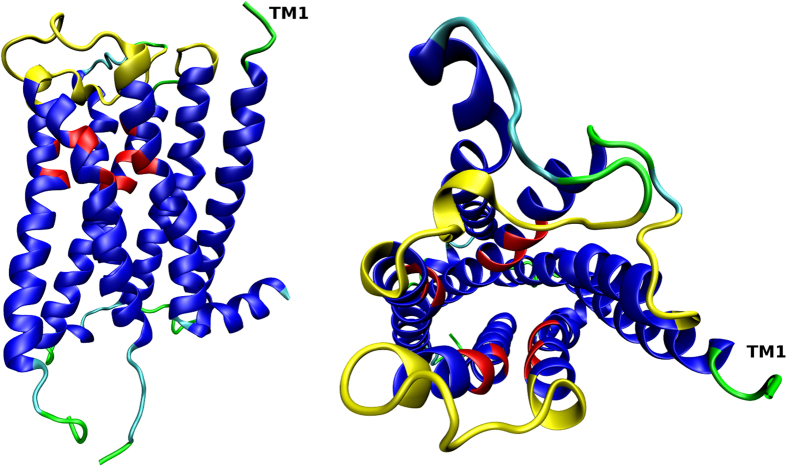
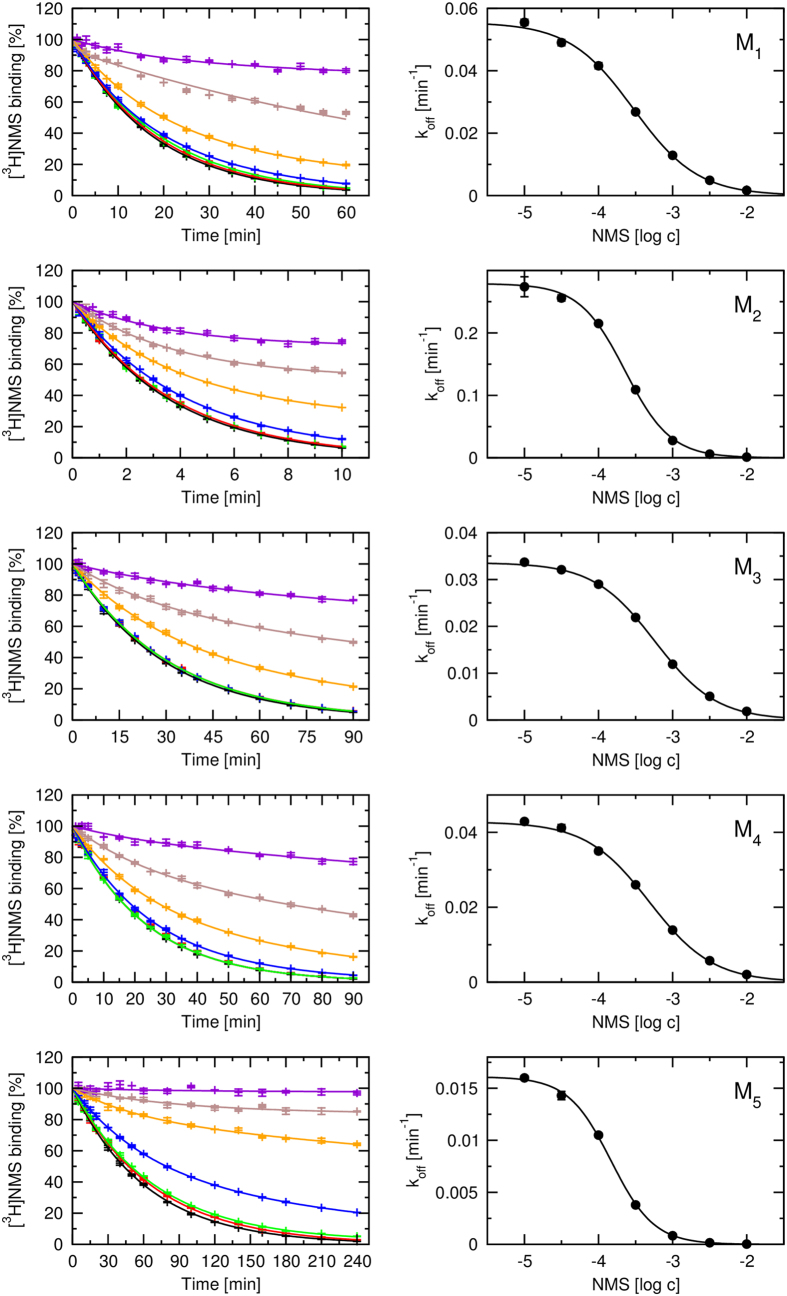
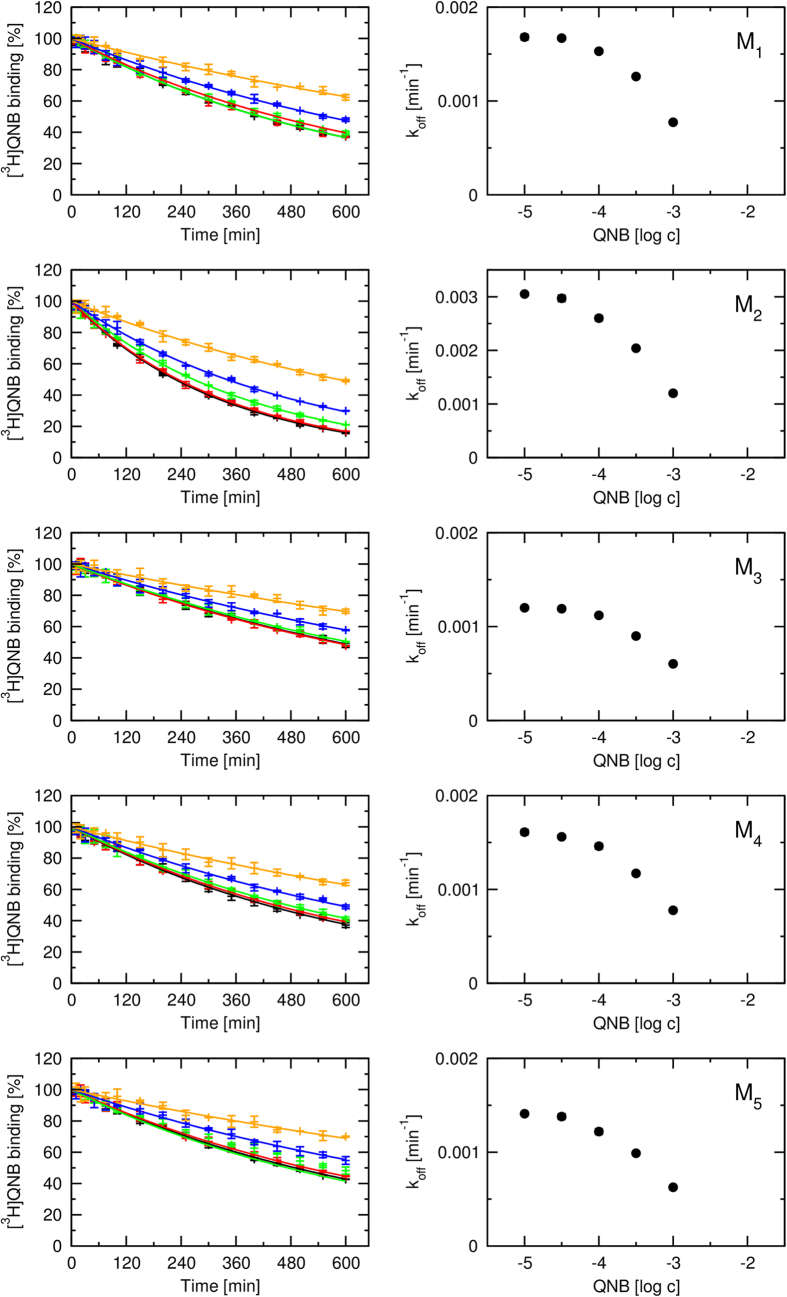
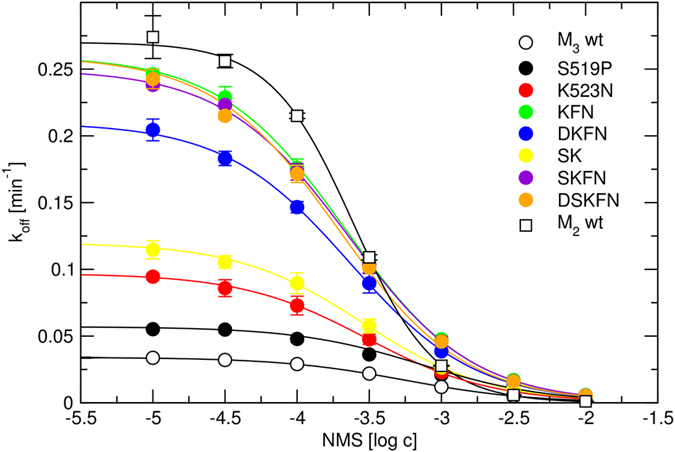
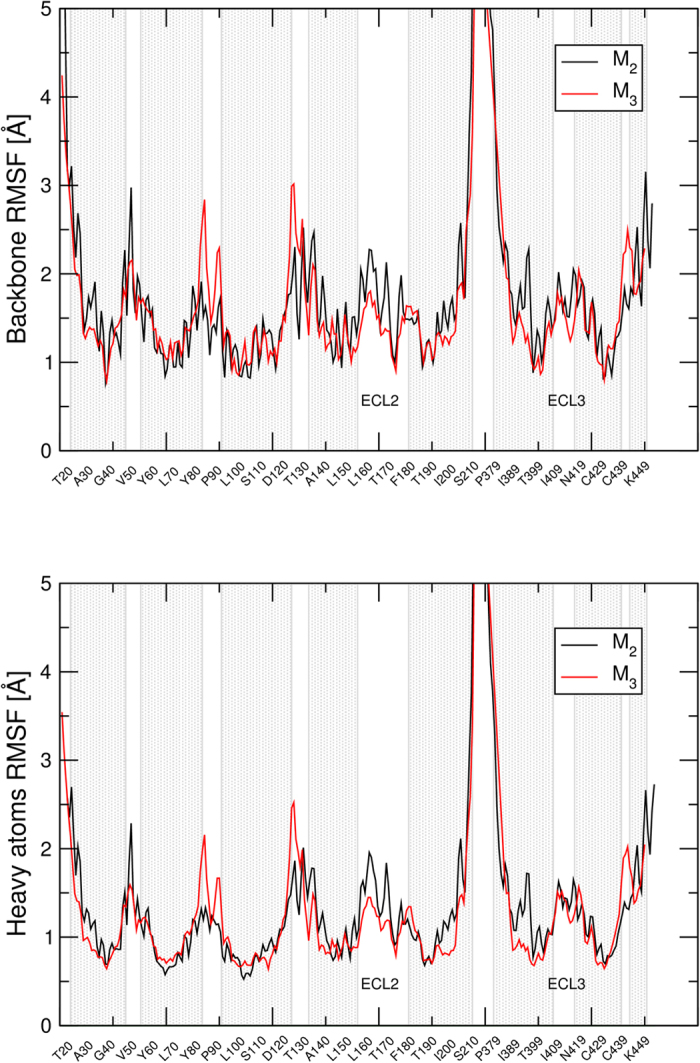
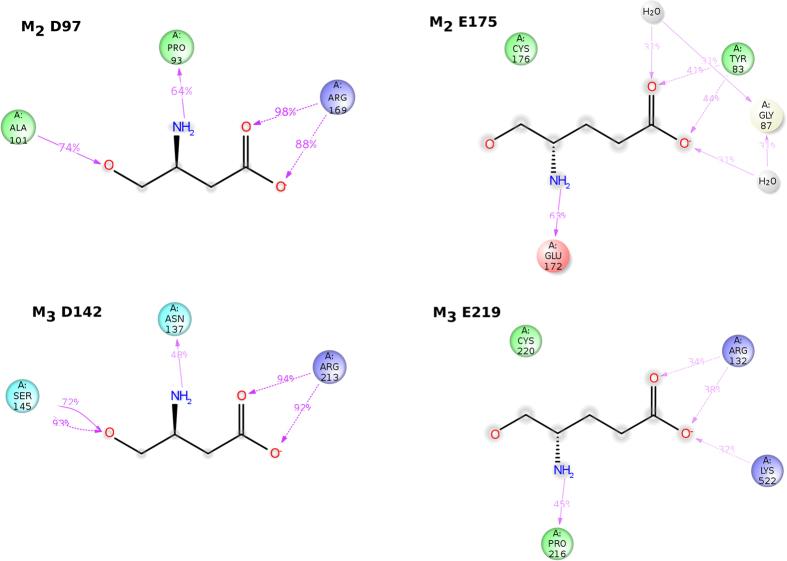
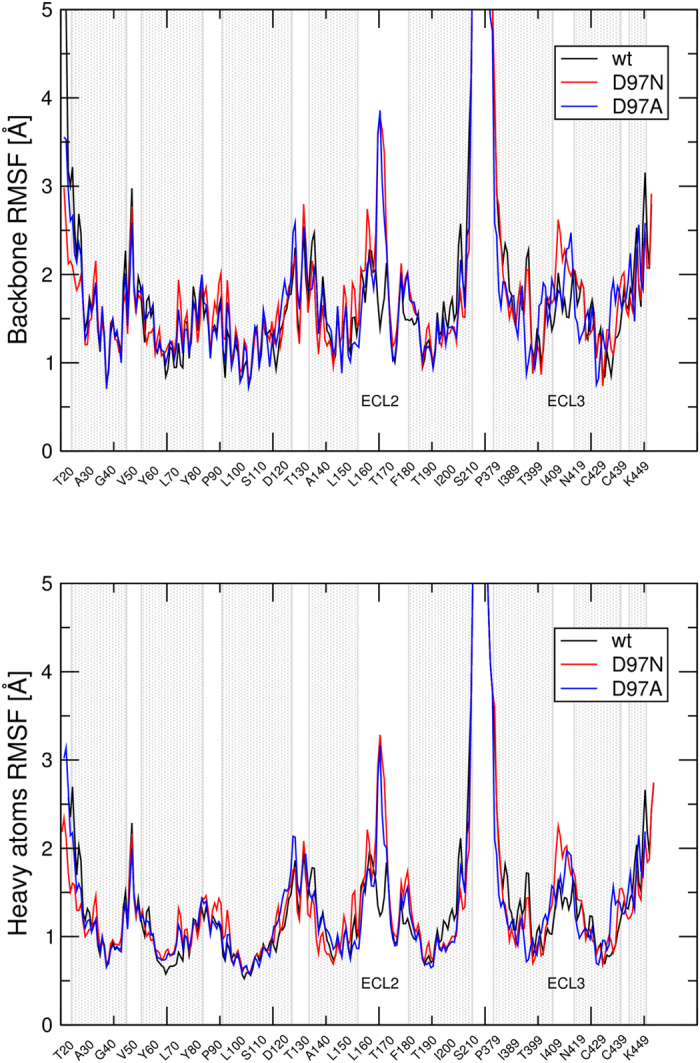
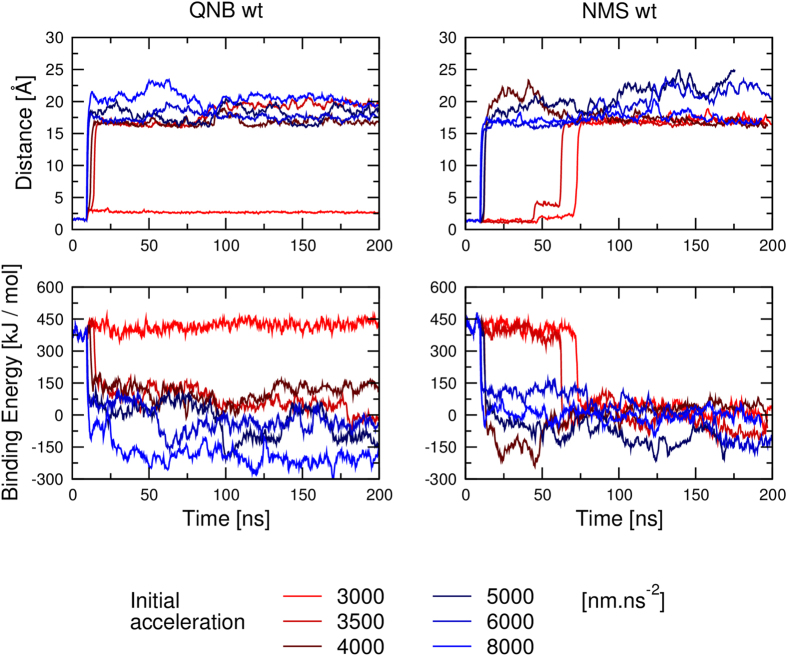
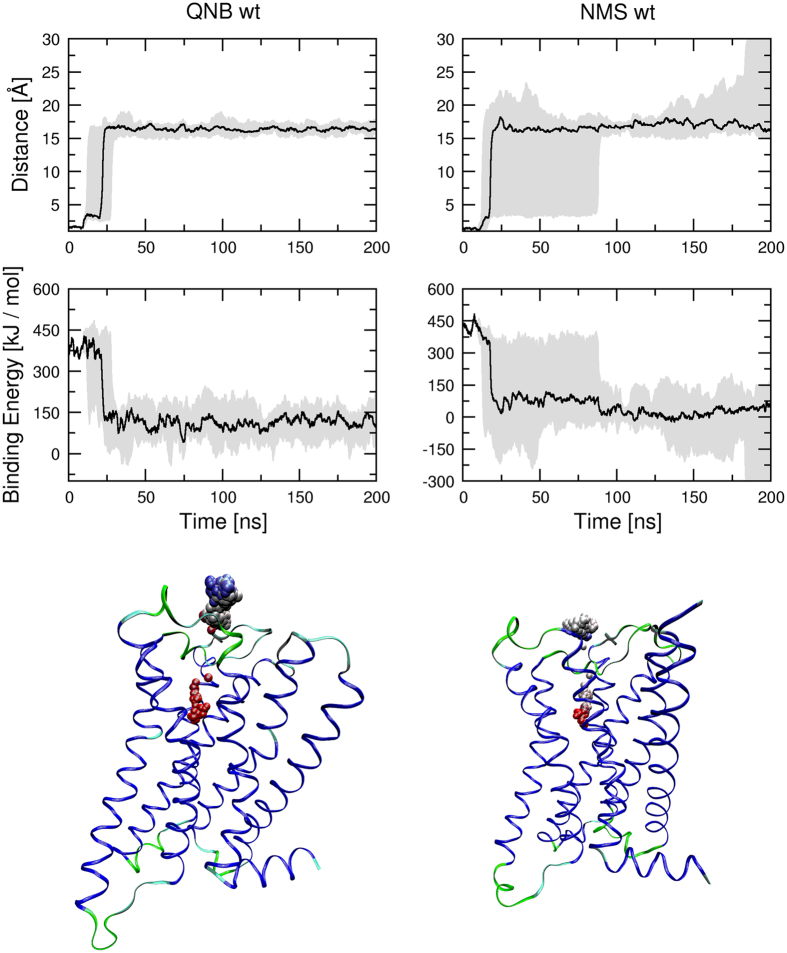
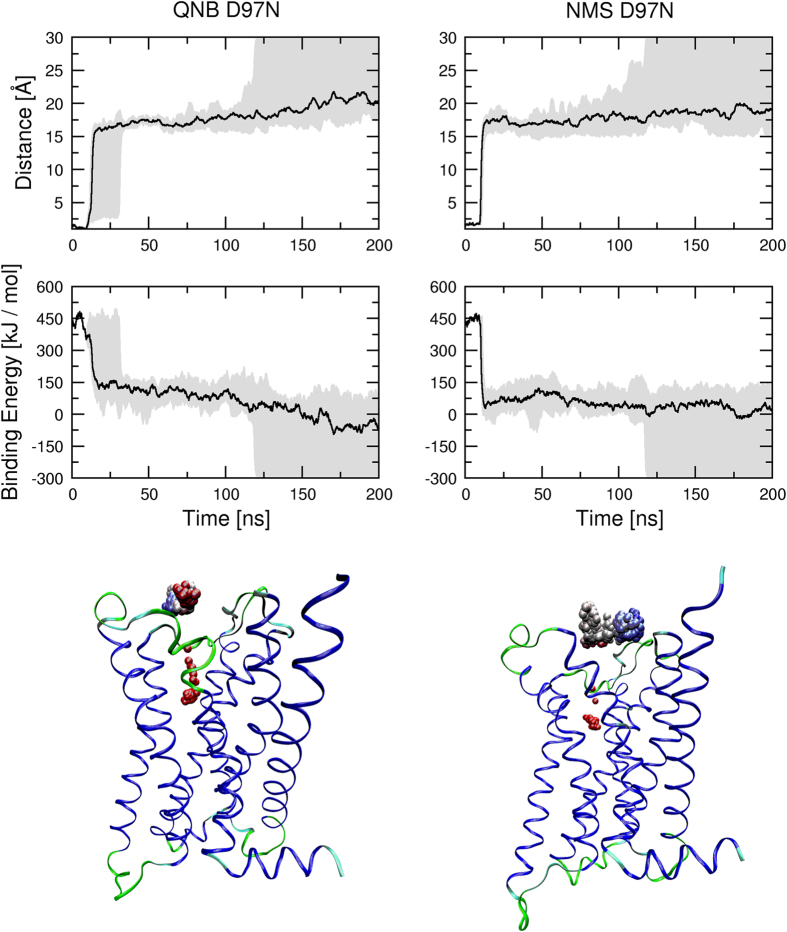
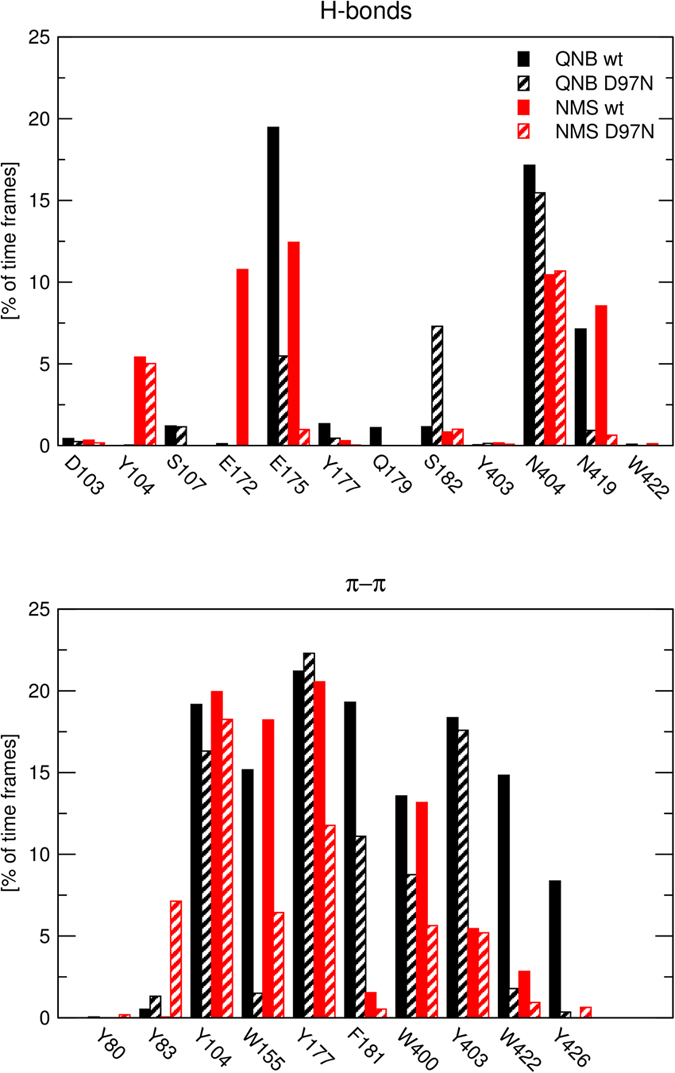
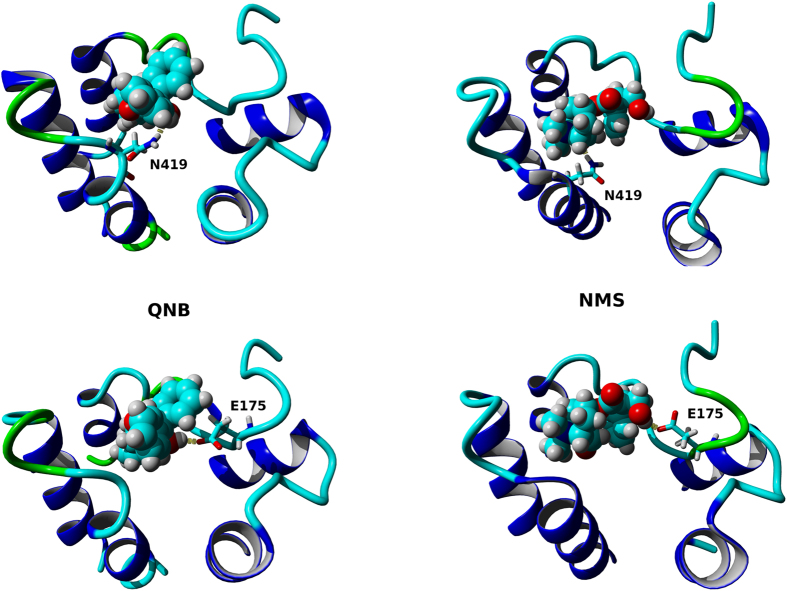
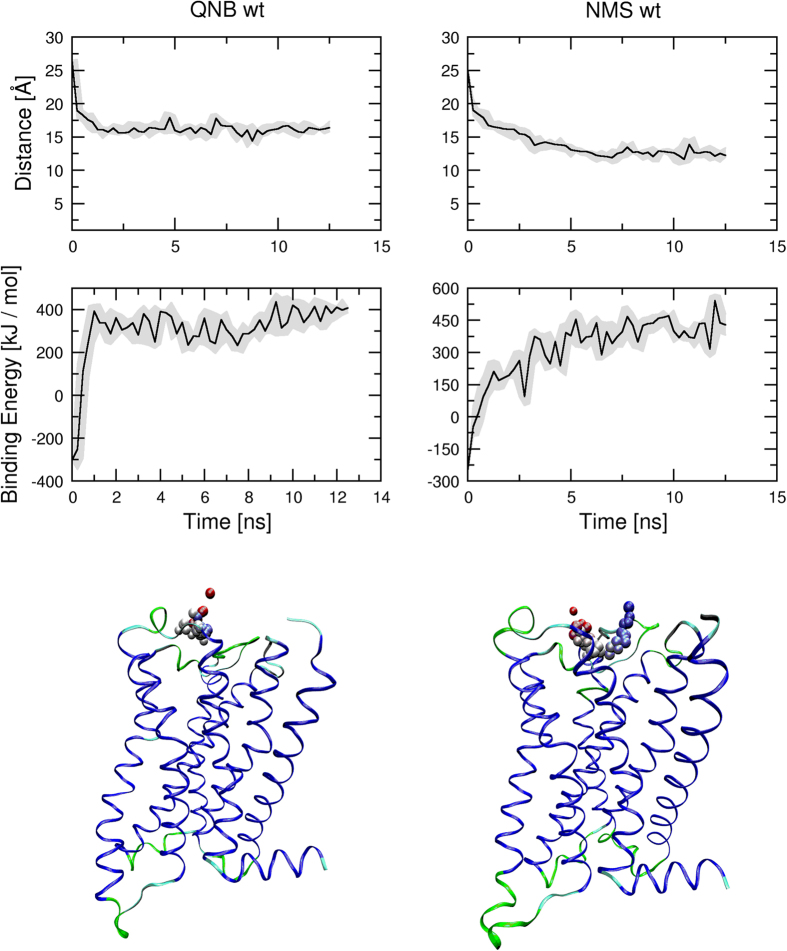
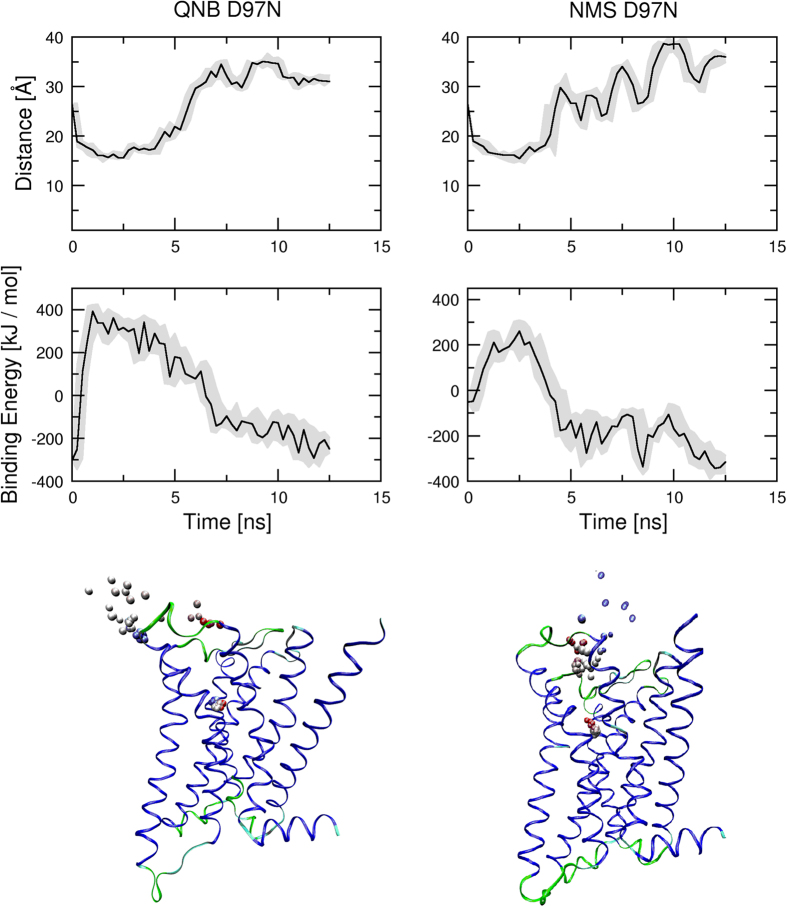
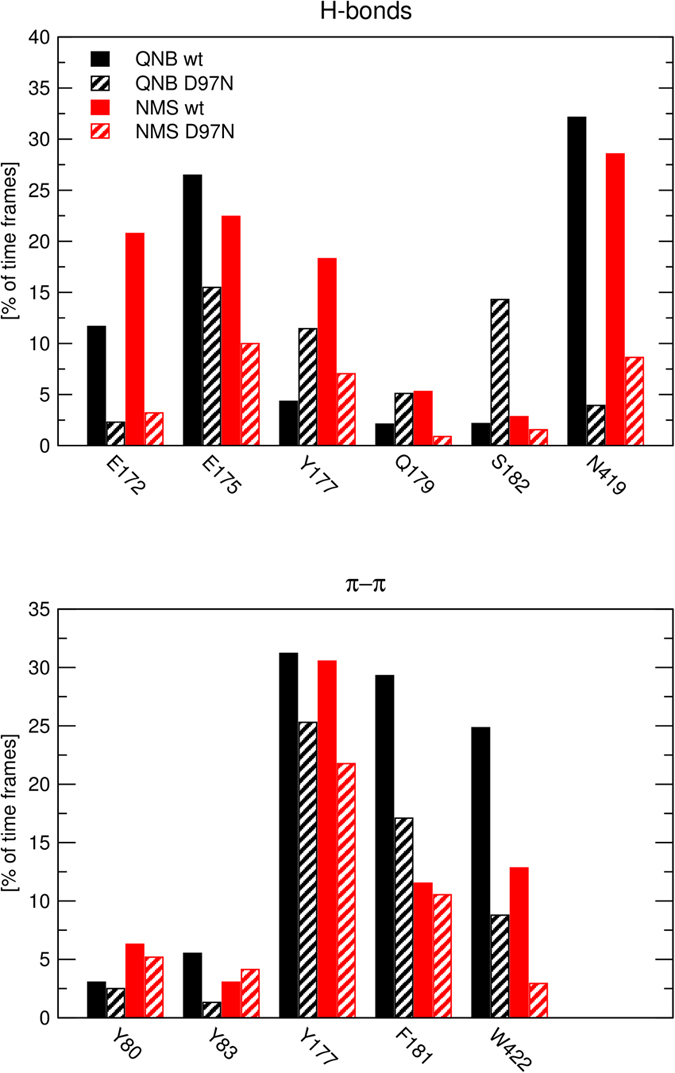
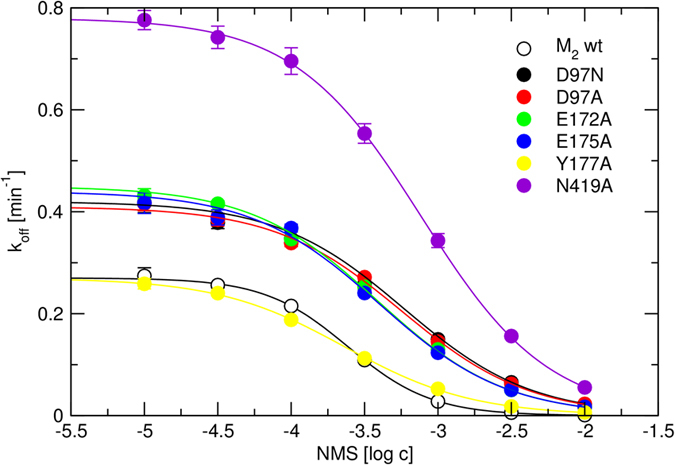
Interaction of orthosteric ligands with extracellular domain was described at several aminergic G protein-coupled receptors, including muscarinic acetylcholine receptors. The orthosteric antagonists quinuclidinyl benzilate (QNB) and N-methylscopolamine (NMS) bind to the binding pocket of the muscarinic acetylcholine receptor formed by transmembrane α-helices. We show that high concentrations of either QNB or NMS slow down dissociation of their radiolabeled species from all five subtypes of muscarinic acetylcholine receptors, suggesting allosteric binding. The affinity of NMS at the allosteric site is in the micromolar range for all receptor subtypes. Using molecular modelling of the M2 receptor we found that E172 and E175 in the second extracellular loop and N419 in the third extracellular loop are involved in allosteric binding of NMS. Mutation of these amino acids to alanine decreased affinity of NMS for the allosteric binding site confirming results of molecular modelling. The allosteric binding site of NMS overlaps with the binding site of some allosteric, ectopic and bitopic ligands. Understanding of interactions of NMS at the allosteric binding site is essential for correct analysis of binding and action of these ligands.


Figures

Figure 1
Figure 1. M2 muscarinic receptor.
Vestibule (yellow) to the binding pocket with the orthosteric site (red) of the M2 receptor as viewed from side (left, extracellular side up) and from the extracellular side (right). Structures: blue – α-helix, cyan – coil; green – turn.
Figure 2
Figure 2. Dissociation of [3H]NMS.
Time course of dissociation of 1 nM [3H]NMS from individual receptor subtypes (left) initiated by the addition of NMS at final concentrations varying from 10 μM (black) to 10 mM (violet) was followed for the time points indicated on the abscissa. Binding of [3H]NMS (ordinate) is expressed as per cent of binding at the beginning of dissociation. Dissociation rates (koff) calculated from time-courses according to Eq. 2 or Eq. 3 are plotted against the concentration of cold NMS used to initiate [3H]NMS dissociation (right). Eq. 4 or Eq. 5 was fitted to data to estimate KA (Table 1). Data are means ± S.E.M. from 4 independent experiments performed in duplicates.
Figure 3
Figure 3. Dissociation of [3H]QNB.
Time course of dissociation of 500 pM [3H]QNB from individual receptor subtypes (left) initiated by the addition of QNB at final concentrations varying from 10 μM (black) to 1 mM (yellow) was followed for the time periods indicated on the abscissa. Binding of [3H]QNB (ordinate) is expressed as per cent of binding at the beginning of dissociation. Dissociation rates (koff) calculated from time-courses according to Eq. 2 are plotted against the concentration of cold QNB used to initiate [3H]QNB dissociation (right). Data are means ± S.E.M. from 4 independent experiments performed in duplicates.
Figure 4
Figure 4. Dissociation rate constants of [3H]NMS from mutated M3 receptors.
Dissociation rate constants (koff) of [3H]NMS from mutated M3 receptors calculated from time-courses according to Eq. 2 or Eq. 3 are plotted against the concentration of cold NMS used to initiate [3H]NMS dissociation. Eq. 4 was fitted to data to estimate KA (Table 2). Data are means ± S.E.M. from 4 independent experiments performed in duplicates.
Figure 5
Figure 5. The Root Mean Square Fluctuation (RMSF) of the M2 and M3 receptor.
The RMSF of backbone atoms (top) and heavy atoms (bottom) of individual amino acids of the M2 (black) and M3 (red) receptors during simulation of molecular dynamics are plotted. Grey regions represent α-helices. The second and third extracellular loops are labelled ECL2 and ECL3, respectively.
Figure 6
Figure 6. Intramolecular interactions of D97 and E175 of the M2 receptor and D142 and E220 of the M3 receptor.
A schematic of detailed atom interactions of D97 (top left) and E175 (top right) of the M2 receptor and D147 (bottom left) and E220 (bottom right) of the M3 receptor with other protein residues. Interactions that occur more often than 30% of the simulation time are shown. Red – charged negative, blue – charged positive, cyan – polar, green – hydrophobic, dotted arrow – H-bond to side chain, full arrow – H-bond to backbone.
Figure 7
Figure 7. The Root Mean Square Fluctuation (RMSF) of wild type and mutated M2 receptor.
The RMSF of backbone atoms (top) and heavy atoms (bottom) of individual amino acids of the wild type (black), D97N (red) and D97A (blue) M2 receptors during simulation of molecular dynamics are plotted. Grey regions denote α-helices. The second and third extracellular loops are labelled ECL2 and ECL3, respectively.
Figure 8
Figure 8. Effect of acceleration magnitude on molecular dynamics of steered dissociation.
Acceleration inversely proportional to the distance of ligand centre from the bottom of the binding pocket (see Methods) was applied to QNB (left) or NMS (right) during steered molecular dynamics. Initial acceleration is indicated in the legend. Median distance of ligand centre from the bottom of binding pocket in Å (top) and ligand binding energies in kJ/mol (bottom) are plotted against simulation time.
Figure 9
Figure 9. Effect of acceleration direction on molecular dynamics of steered dissociation.
Acceleration inversely proportional to the distance of ligand centre from the bottom of binding pocket of the wild type M2 receptor (see Methods) was applied to QNB (left) or NMS (right) during MD of steered dissociation. Initial acceleration applied to ligand was 4000 nm.ns−2. Minimum to maximum (grey area) and median (black line) distance of ligand centre from the bottom of binding pocket in Å (top) and ligand binding energies in kJ/mol (middle) are plotted against simulation time. Bottom: Sample trajectory of steered dissociation of QNB (left) and NMS (right). Spheres representing the centre of ligand at individual time-frames are coloured according to time-frame in red to blue gradient. Videos of sample trajectories of QNB and NMS are available as Supplementary Video 1 and Supplementary Video 2, respectively.
Figure 10
Figure 10. Molecular dynamics of steered dissociation from the D97N mutant.
Acceleration inversely proportional to the distance of ligand centre from the bottom of binding pocket of D97N mutant M2 receptor (see Methods) was applied to QNB (left) or NMS (right) during MD of steered dissociation. Initial acceleration applied to ligand was 4000 nm.ns−2. Minimum to maximum (grey area) and median (black line) distance of ligand centre from the bottom of binding pocket in Å (top) and ligand binding energies in kJ/mol (middle) are plotted against simulation time. Bottom: Sample trajectory of steered dissociation of QNB (left) and NMS (right). Spheres representing the centre of ligand at individual time-frames are coloured according to time-frame in red to blue gradient. Videos of sample trajectories of QNB and NMS are available as Supplementary Video 3 and Supplementary Video 4, respectively.
Figure 11
Figure 11. Ligand-receptor interactions during molecular dynamics of steered dissociation.
Interactions of QNB (black) and NMS (red) via hydrogen bonds (top) and π-π stacking (bottom) with wild type (solid bars) or D97N mutated (hatched bars) M2 receptor normalized over the course of the trajectory are shown for individual amino acids. Values over 100 are possible as ligand may make multiple contacts with the receptor.
Figure 12
Figure 12. Key interactions at vestibule of the binding pocket of the M2 receptor.
Typical placements of QNB (left) and NMS (right) interacting with key amino acids N419 (top) and E175 (bottom) at the vestibule of binding pocket of the M2 receptor are shown as being viewed from the extracellular side. TM 6, ECL3 and TM 7 are on the left-hand side, ECL2 is at top, TM 2, ECL1 and TM 3 are on the right-hand side. Colors: Atoms: cyan – carbon, red – oxygen, blue – nitrogen, white – hydrogen; Structures: blue – α-helix, cyan – coil; green – turn; Interactions: yellow – hydrogen bonds. QNB makes hydrogen bonds to N419 and E175, respectively, by its hydroxy group. NMS makes hydrogen bonds with N419 by its oxygen in azatricycle group, and with E175 by its hydroxy group.
Figure 13
Figure 13. Molecular dynamics of steered association with the wild type receptor.
The second molecule of QNB (left) or NMS (right) was placed to the vestibule of the binding pocket by simulation of 2.5 ns MD of steered association. Acceleration proportional to the distance of ligand centre from the bottom of binding pocket (see Methods) was applied to the second molecule of the ligand. Initial acceleration applied to ligand was 500 nm.ns−2. Then 10 ns of free MD followed. Minimum to maximum (grey area) and median (black line) distance of ligand centre from the bottom of binding pocket in Å (top) and ligand binding energies in kJ/mol (middle) are plotted against simulation time. Bottom: Sample trajectory of steered association of QNB (left) and NMS (right). Spheres representing the centre of ligand at individual time-frames are coloured according to time-frame in red to blue gradient. Videos of sample trajectories of QNB and NMS are available as Supplementary Video 5 and Supplementary Video 6, respectively.
Figure 14
Figure 14. Molecular dynamics of steered association with the D97N mutant.
The second molecule of QNB (left) or NMS (right) was placed to the vestibule of the binding pocket by simulation of 2.5 ns MD of steered association. Acceleration proportional to the distance of ligand centre from the bottom of binding pocket (see Methods) was applied to the second molecule of the ligand. Initial acceleration applied to ligand was 500 nm.ns−2. Then 10 ns of free MD followed. Minimum to maximum (grey area) and median (black line) distance of ligand centre from the bottom of binding pocket in Å (top) and ligand binding energies in kJ/mol (middle) are plotted against simulation time. Bottom: Sample trajectory of steered association of QNB (left) and NMS (right). Spheres representing the centre of ligand at individual time-frames are coloured according to time-frame in red to blue gradient. Videos of sample trajectories of QNB and NMS are available as Supplementary Video 7 and Supplementary Video 8, respectively.
Figure 15
Figure 15. Ligand-receptor interactions during molecular dynamics of steered association.
Interactions of QNB (black) and NMS (red) via hydrogen bonds (top) and π-π stacking (bottom) with wild type (solid bars) or D97N mutated (hatched bars) M2 receptor normalized over the course of the trajectory are shown for individual amino acids. Values over 100 are possible as ligand may make multiple contacts with the receptor.
Figure 16
Figure 16. Dissociation rate constants of [3H]NMS from mutated M2 receptors.
Dissociation rate constants (koff) of [3H]NMS from mutated M2 receptors calculated from time-courses according Eq. 2 or Eq. 3 are plotted against the concentration of cold NMS used to initiate [3H]NMS dissociation. Eq. 4 or Eq. 5 was fitted to data to estimate KA (Table 3). Data are means ± S.E.M. from 4 independent experiments performed in duplicates.

Similar articles

Cited by

References

    1. Bonner T. I. The molecular basis of muscarinic receptor diversity. Trends Neurosci 12, 148–51 (1989). - PubMed
    1. Eglen R. M. Overview of Muscarinic Receptor Subtypes In Handb exp pharmacol (eds Fryer A. D., Christopoulos A. & Nathanson N. M.) pp. 3–28, Springer (2012). - PubMed
    1. Jakubík J. et al. Outline of therapeutic interventions with muscarinic receptor-mediated transmission. Physiol Res 63 Suppl 1, S177–89 (2014). - PubMed
    1. Kruse A. C. et al. Muscarinic acetylcholine receptors: novel opportunities for drug development. Nat Rev Drug Discov 13, 549–60 (2014). - PMC - PubMed
    1. Haga K. et al. Structure of the human M2 muscarinic acetylcholine receptor bound to an antagonist. Nature 482, 547–51 (2012). - PMC - PubMed

Publication types

MeSH terms

LinkOut - more resources