

Blood perfusion in osteomyelitis studied with [15O]water PET in a juvenile porcine model
- PMID: 28091979
- PMCID: PMC5237436
- DOI: 10.1186/s13550-016-0251-2
Blood perfusion in osteomyelitis studied with [15O]water PET in a juvenile porcine model
Abstract
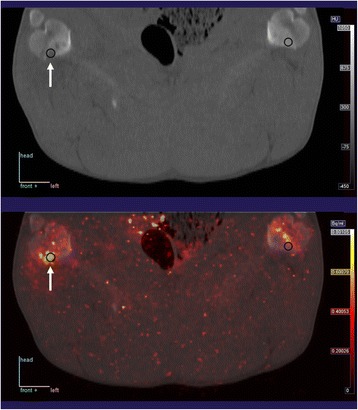
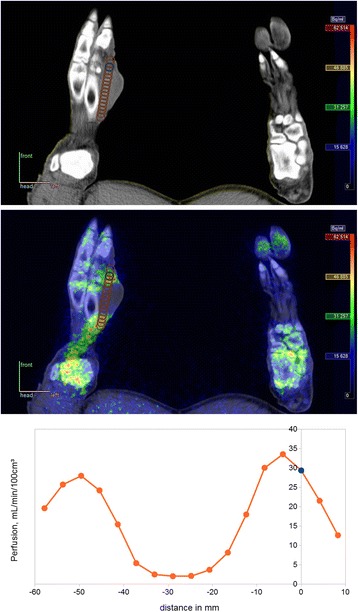
Background: Osteomyelitis is a serious disease which can be difficult to treat despite properly instituted antibiotic therapy. This appears to be related at least partly to degraded vascularisation in the osteomyelitic (OM) lesions. Studies of perfusion in OM bones are, however, few and not quantitative. Quantitative assessment of perfusion could aid in the selection of therapy. A non-invasive, quantitative way to study perfusion is dynamic [15O]water positron emission tomography (PET). We aim to demonstrate that the method can be used for measuring perfusion in OM lesions and hypothesize that perfusion will be less elevated in OM lesions than in soft tissue (ST) infection. The study comprised 11 juvenile pigs with haematogenous osteomyelitis induced by injection of Staphylococcus aureus into the right femoral artery 1 week before scanning (in one pig, 2 weeks). The pigs were dynamically PET scanned with [15O]water to quantify blood perfusion. OM lesions (N = 17) in long bones were studied, using the left limb as reference. ST lesions (N = 8) were studied similarly.
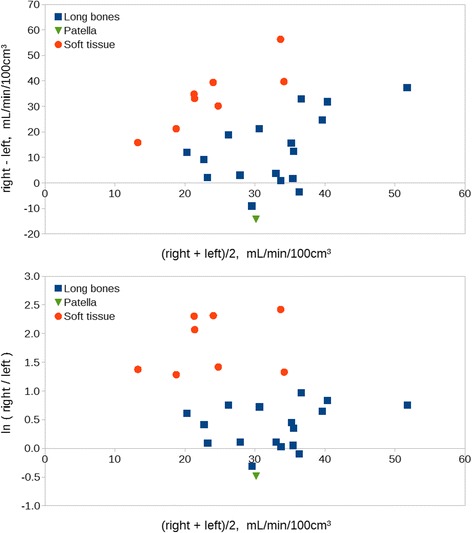
Results: Perfusion was quantitatively determined. Perfusion was elevated by a factor 1.5 in OM lesions and by a factor 6 in ST lesions.
Conclusions: Blood perfusion was successfully determined in pathological subacute OM lesions; average perfusion was increased compared to that in a healthy bone, but as hypothesized, the increase was less than in ST lesions, indicating that the infected bone has less perfusion reserve than the infected soft tissue.
Keywords: Bone infection; Osteomyelitis; Perfusion; Positron emission tomography; Swine; [15O]water.
Figures

References
-
- Berbari EF, Steckelberg JM, Osmon DR. Osteomyelitis. In: Bennett JE, Dolin R, Blaser MJ, editors. Principles and practice of infectious diseases. 6th ed. Philadelphia: Elsevier Churchill Livingstone; 2005.
-
- Johansen LK, Jensen HE. Animal models of hematogenous Staphylococcus aureus osteomyelitis in long bones: a review. Orthopedic Research and Reviews. 2013;5:51–64.
-
- Azam Q, Ahmad I, Abbas M, Syed A, Haque F. Ultrasound and colour Doppler sonography in acute osteomyelitis in children. Acta Orthop Belg. 2005;71:590–596. - PubMed
LinkOut - more resources
Full Text Sources
Other Literature Sources
