. 2017 May;283(2):381-390.
doi: 10.1148/radiol.2016161315. Epub 2017 Jan 16.

Machine Learning of Three-dimensional Right Ventricular Motion Enables Outcome Prediction in Pulmonary Hypertension: A Cardiac MR Imaging Study

Affiliations

Machine Learning of Three-dimensional Right Ventricular Motion Enables Outcome Prediction in Pulmonary Hypertension: A Cardiac MR Imaging Study

Timothy J W Dawes et al. Radiology. 2017 May.

Abstract

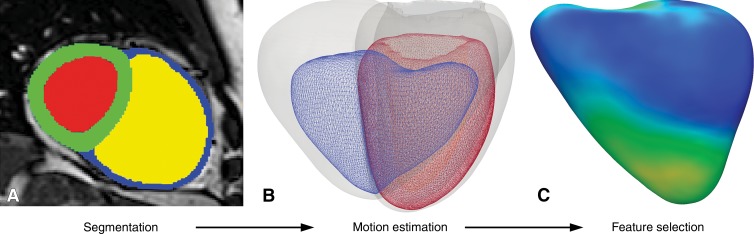
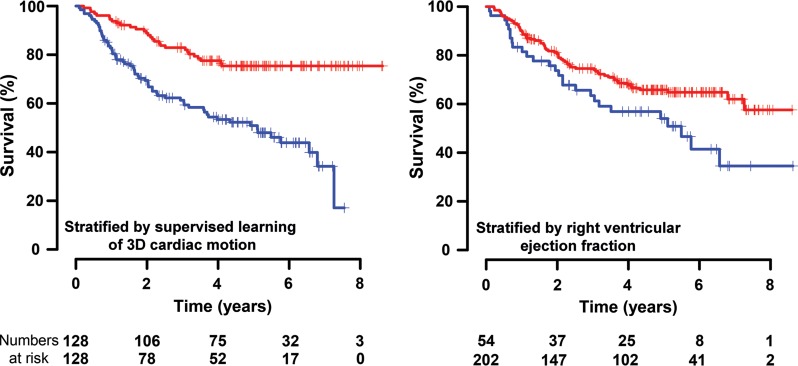
Purpose To determine if patient survival and mechanisms of right ventricular failure in pulmonary hypertension could be predicted by using supervised machine learning of three-dimensional patterns of systolic cardiac motion. Materials and Methods The study was approved by a research ethics committee, and participants gave written informed consent. Two hundred fifty-six patients (143 women; mean age ± standard deviation, 63 years ± 17) with newly diagnosed pulmonary hypertension underwent cardiac magnetic resonance (MR) imaging, right-sided heart catheterization, and 6-minute walk testing with a median follow-up of 4.0 years. Semiautomated segmentation of short-axis cine images was used to create a three-dimensional model of right ventricular motion. Supervised principal components analysis was used to identify patterns of systolic motion that were most strongly predictive of survival. Survival prediction was assessed by using difference in median survival time and area under the curve with time-dependent receiver operating characteristic analysis for 1-year survival. Results At the end of follow-up, 36% of patients (93 of 256) died, and one underwent lung transplantation. Poor outcome was predicted by a loss of effective contraction in the septum and free wall, coupled with reduced basal longitudinal motion. When added to conventional imaging and hemodynamic, functional, and clinical markers, three-dimensional cardiac motion improved survival prediction (area under the receiver operating characteristic curve, 0.73 vs 0.60, respectively; P < .001) and provided greater differentiation according to difference in median survival time between high- and low-risk groups (13.8 vs 10.7 years, respectively; P < .001). Conclusion A machine-learning survival model that uses three-dimensional cardiac motion predicts outcome independent of conventional risk factors in patients with newly diagnosed pulmonary hypertension. Online supplemental material is available for this article.


Figures

Figure 1:
Figure 1:
Example of computational modeling for a patient with idiopathic pulmonary arterial hypertension. A, Cine MR images were segmented by using prior knowledge from a set of disease-specific atlases. Here, the intensity image in the short-axis of the heart is overlaid with labels for left ventricular blood pool (red), myocardium (green), RV blood pool (yellow), and free wall (blue). B, A 3D model at end-diastole (gray) and end-systole (blue, right ventricle; and red, left ventricle) was used to determine the direction and magnitude of systolic excursion at each corresponding anatomic point in the mesh by using a deformable motion model. C, A statistical model of RV endocardial motion was used for feature selection to determine functional patterns associated with survival (relative weightings shown for the RV free wall).
Figure 2:
Figure 2:
Flow diagram for recruitment and analysis of patients with PH. Cardiac MR images were segmented and analyzed in 256 eligible patients. In the training phase, supervised machine learning was used to discover patterns of RV function associated with outcome. Predictive performance of multivariable risk models was assessed by using eightfold cross-validation to demonstrate the incremental value of computational phenotyping. CMR = cardiovascular MR.
Figure 3a:
Figure 3a:
A comparison of survival prediction for each parameter is shown. (a) Standardized hazard ratios (HRs) (for a 1.96 standard deviation difference) with 95% confidence intervals (CIs) are shown for 3D motion and conventional prognostic markers. (b) Kaplan-Meier curves and numbers at risk for the survival of patients with PH were used to compare risk stratification according to 3D motion versus RV ejection fraction (RVEF). mPAP = mean pulmonary artery pressure, mRAP = mean right atrial pressure, PVR = pulmonary vascular resistance, RAP = right atrial pressure, RVEDP = RV end-diastolic pressure, RVEDVI = indexed RV end-diastolic volume, RVESVI = indexed RV end-systolic volume, SV/ESV = stroke volume divided by end-systolic volume, 6MWD = 6-minute walk distance.
Figure 3b:
Figure 3b:
A comparison of survival prediction for each parameter is shown. (a) Standardized hazard ratios (HRs) (for a 1.96 standard deviation difference) with 95% confidence intervals (CIs) are shown for 3D motion and conventional prognostic markers. (b) Kaplan-Meier curves and numbers at risk for the survival of patients with PH were used to compare risk stratification according to 3D motion versus RV ejection fraction (RVEF). mPAP = mean pulmonary artery pressure, mRAP = mean right atrial pressure, PVR = pulmonary vascular resistance, RAP = right atrial pressure, RVEDP = RV end-diastolic pressure, RVEDVI = indexed RV end-diastolic volume, RVESVI = indexed RV end-systolic volume, SV/ESV = stroke volume divided by end-systolic volume, 6MWD = 6-minute walk distance.
Figure 4:
Figure 4:
Illustration of how features of RV motion are automatically selected for prognostic importance in patients with PH. A, Plot represents how the magnitude of systolic excursion in the right ventricle, derived from atlas-based cardiac segmentations, varies between survivors and nonsurvivors from the basal level to the apical level. B, Plot shows where supervised machine learning identifies features within these motion-based data that most accurately allow discrimination between low-risk and high-risk patients. The full model used for survival prediction took into account the prognostic importance of motion throughout a 3D representation of the right ventricle, resolved into orthogonal components.
Figure 5:
Figure 5:
Graph shows observed 5-year survival from the time of diagnosis according to predicted risk strata obtained by using model 3, as described in the Table.
Figure 6:
Figure 6:
A 3D model of the right ventricle shows the regional contributions to survival prediction in 256 patients with PH. The models show where reduced (red) or increased (blue) systolic motion is associated with death. This is shown by, A, the magnitude of excursion, as well as, B–D, each directional component. The right ventricle is shown in the anterior and septal views, with the left ventricle depicted as a mesh. A reduction in both longitudinal basal motion and transverse bellows contraction is associated with death, as is an increase in circumferential contraction.

References

    1. Galiè N, Humbert M, Vachiery JL, et al. . 2015 ESC/ERS guidelines for the diagnosis and treatment of pulmonary hypertension: The Joint Task Force for the Diagnosis and Treatment of Pulmonary Hypertension of the European Society of Cardiology (ESC) and the European Respiratory Society (ERS). Endorsed by: Association for European Paediatric and Congenital Cardiology (AEPC), International Society for Heart and Lung Transplantation (ISHLT). Eur Respir J 2015;46(4):903–975. - PubMed
    1. Benza RL, Miller DP, Gomberg-Maitland M, et al. . Predicting survival in pulmonary arterial hypertension: insights from the Registry to Evaluate Early and Long-Term Pulmonary Arterial Hypertension Disease Management (REVEAL). Circulation 2010;122(2):164–172. - PubMed
    1. Vonk-Noordegraaf A, Haddad F, Chin KM, et al. . Right heart adaptation to pulmonary arterial hypertension: physiology and pathobiology. J Am Coll Cardiol 2013;62(25 Suppl):D22–D33. - PubMed
    1. van de Veerdonk MC, Kind T, Marcus JT, et al. . Progressive right ventricular dysfunction in patients with pulmonary arterial hypertension responding to therapy. J Am Coll Cardiol 2011;58(24):2511–2519. - PubMed
    1. Naeije R, Ghio S. More on the right ventricle in pulmonary hypertension. Eur Respir J 2015;45(1):33–35. - PubMed

Publication types

MeSH terms