. 2017 Jan 16:6:e20782.
doi: 10.7554/eLife.20782.

Vocal development in a Waddington landscape

Affiliations

Vocal development in a Waddington landscape

Yayoi Teramoto et al. Elife. .

Abstract

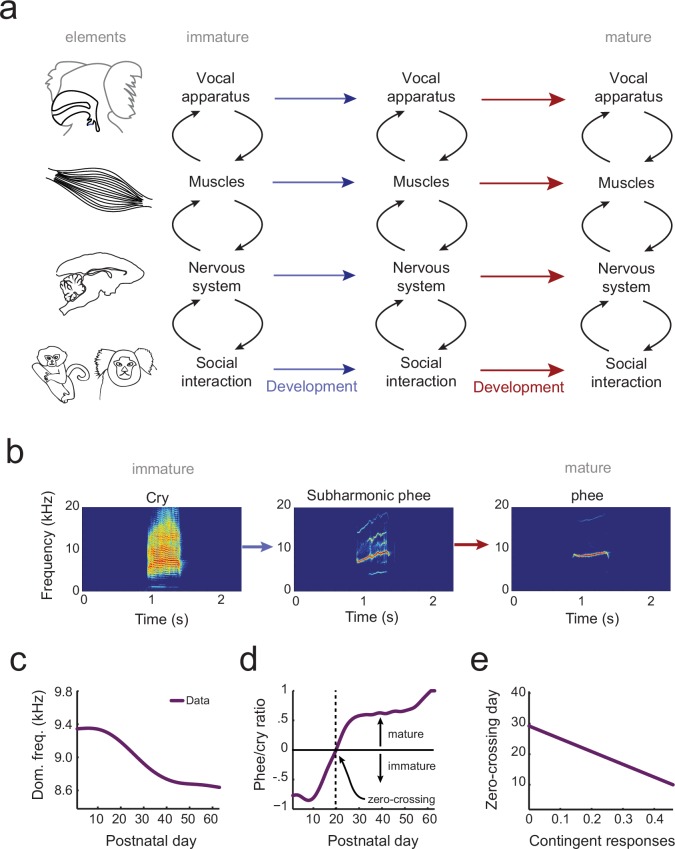
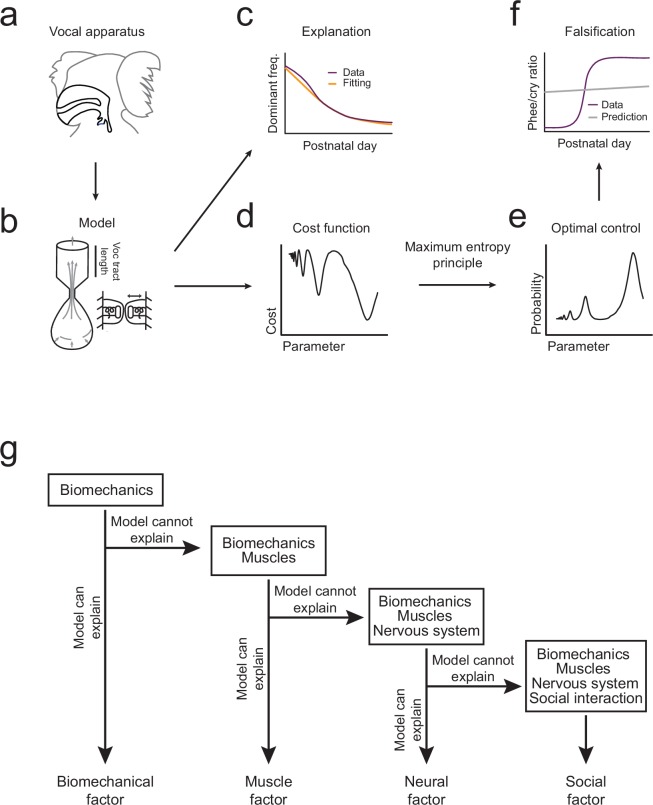
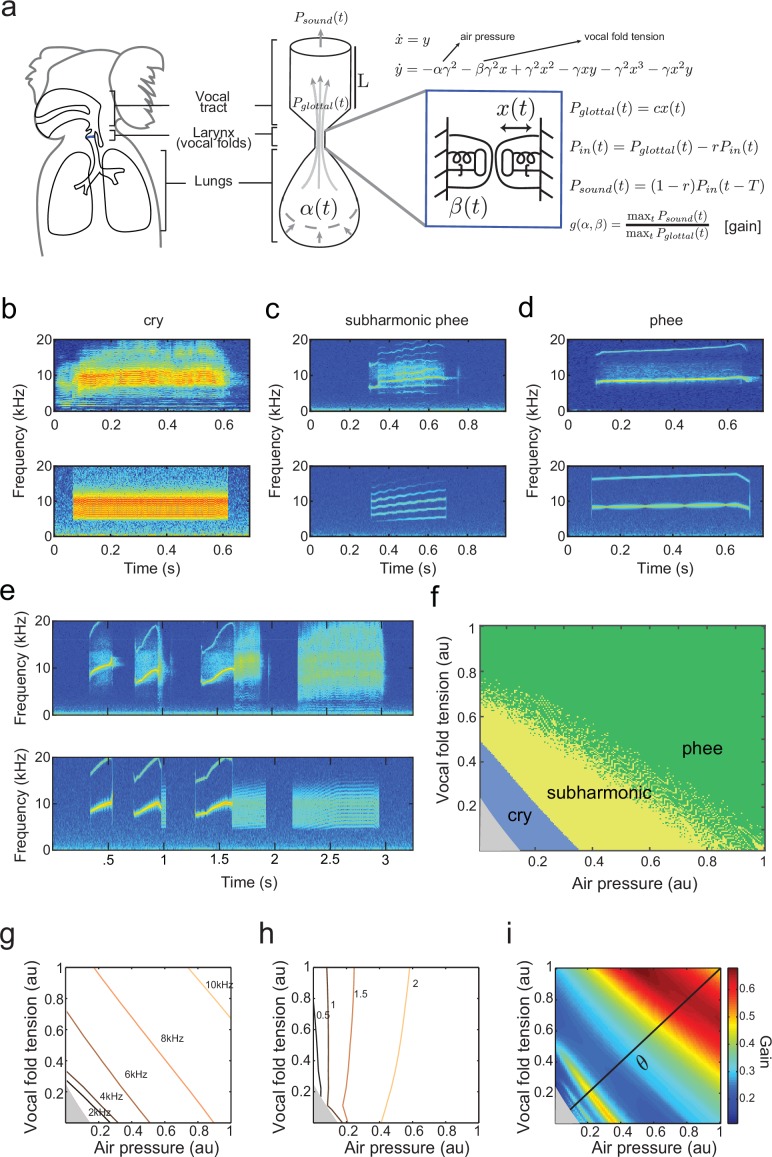
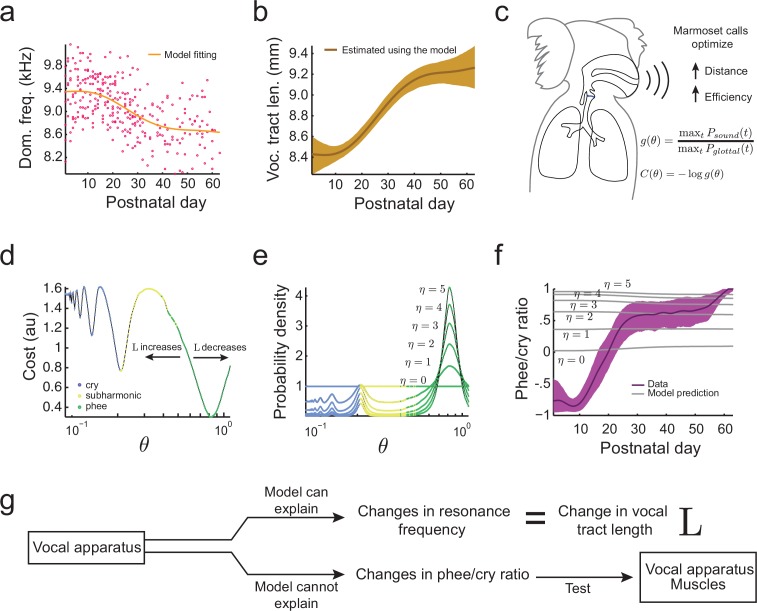
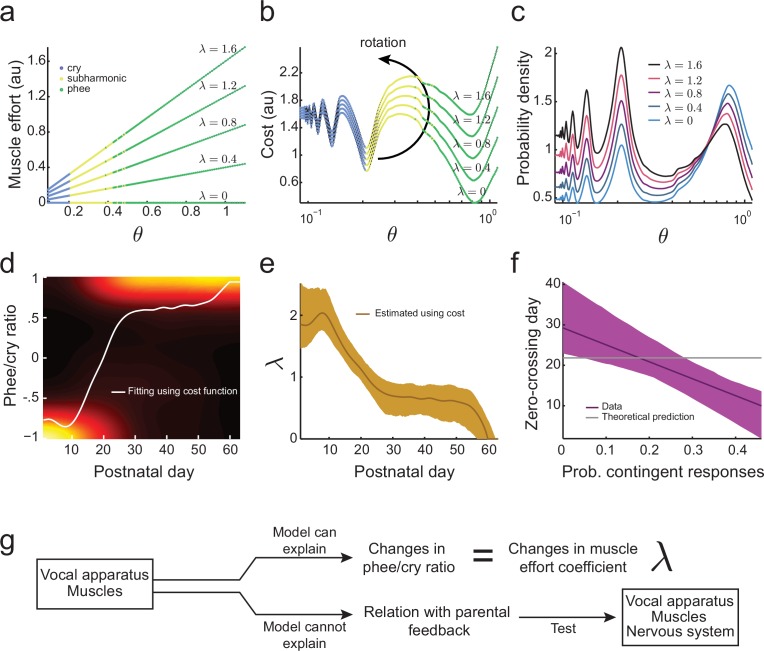
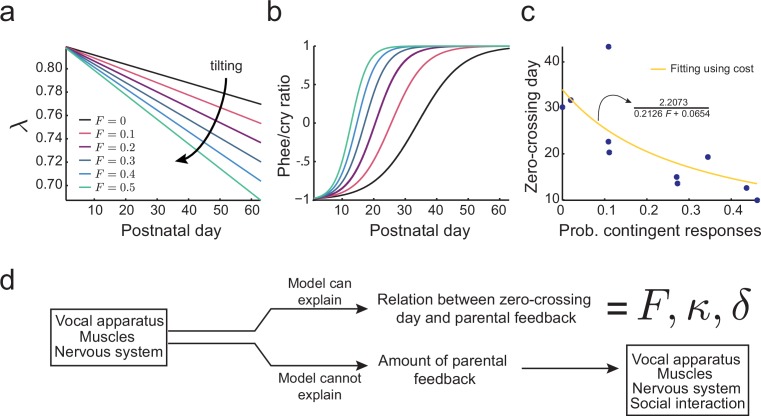
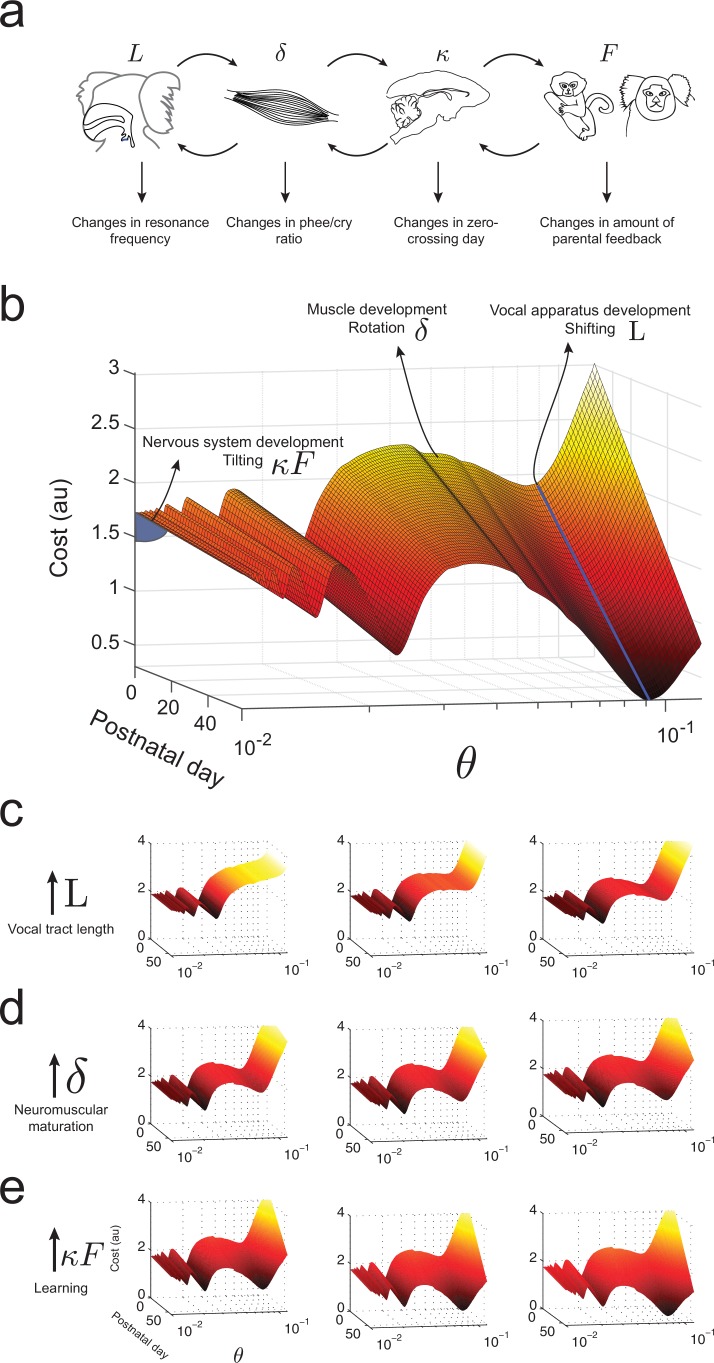
Vocal development is the adaptive coordination of the vocal apparatus, muscles, the nervous system, and social interaction. Here, we use a quantitative framework based on optimal control theory and Waddington's landscape metaphor to provide an integrated view of this process. With a biomechanical model of the marmoset monkey vocal apparatus and behavioral developmental data, we show that only the combination of the developing vocal tract, vocal apparatus muscles and nervous system can fully account for the patterns of vocal development. Together, these elements influence the shape of the monkeys' vocal developmental landscape, tilting, rotating or shifting it in different ways. We can thus use this framework to make quantitative predictions regarding how interfering factors or experimental perturbations can change the landscape within a species, or to explain comparative differences in vocal development across species.

Keywords: developmental systems; epigenetic landscape; marmoset monkey; neuromechanics; neuroscience; songbird; vocal tract resonance.


Conflict of interest statement

The authors declare that no competing interests exist.

Figures

Figure 1.
Figure 1.. The elements of vocal development and their interactions.
(a) Vocal development is the result of changes in, and interactions among, the vocal apparatus, muscles, nervous system, and social context. (b) Infant marmosets produce mostly immature calls (cries and subharmonics) during early postnatal days which are replaced by more adult-like calls (phees) during development. (c) Changes in vocal acoustics during development include a lowering of the dominant frequency. Purple curve shows a cubic spline fit to the data. (d) Change in the proportion of mature calls compared to immature calls (the phee/cry ratio). Purple curve shows a cubic spline fit to the data. The zero-crossing day is the postnatal day in which the number of cries and phees are the same, marking the transition from mature to immature vocalization. (e) Relationship between the probability of parental contingent responses and the zero-crossing day. Purple line shows the linear regression fit to the data. DOI: http://dx.doi.org/10.7554/eLife.20782.003
Figure 2.
Figure 2.. Illustration of the inferential process used in the study.
(a,b) A biomechanical model is made of the infant marmoset monkey vocal apparatus. (c) The model is used to simulate how the growth of the vocal tract lowers the dominant frequency of calls. Model data (yellow line) can be fitted to the real data (purple line). (d,e) Optimal control theory is used to generate a cost function for producing different call types and the maximum entropy principle is used to calculate a probability distribution. (f) Using the probability distribution, we can calculate the phee/cry ratios produced by the simulated vocal tract growth (gray line) and compare with the real marmoset phee/cry ratio data (purple line). (g) The contributions of other individual elements (see Figure 1a) are gradually added to the framework using a sequential inferential approach together with mathematical modeling. DOI: http://dx.doi.org/10.7554/eLife.20782.004
Figure 3.
Figure 3.. A biomechanical model of marmoset vocal apparatus.
(a) Representation of the biomechanical model of the vocal production apparatus. In our one-mass model x(t),y(t) are displacement and velocity of vocal folds; nondimensional lung air pressure, vocal fold tension and overall inverse timescale are represented by parameters α(t),β(t) and γ. Glottal exit air flow Pglottal is filtered by the vocal tract, modeled as a cylinder of length L with reflection coefficient r at the mouth, to produce vocal output PsoundT/2=L/csoundT/2=L/csound is the one way travel time with sound speed csound. (bd) Examples of real infant calls (top) and model simulation of the same calls (bottom). (e) Example of a sequence of infant calls (top) and model simulation (bottom). (f) Different values of air pressure and vocal fold tension produce distinct types of calls. Gray region represents parameter values that do not produce vocalization (i.e., self-sustained oscillation). (g) Isofrequency curves. Lines show air pressure and vocal fold tension values that produce glottal air flow that oscillates at the same frequencies; parameters in the gray region do not produce self-sustained oscillations. (h) Iso-amplitude curves. Lines show air pressure and vocal fold tension values that produce glottal air flow with same amplitudes. (i) Plot showing gains: the ratios between sound produced after the resonance (vocal output) and before the resonance (glottal air flow); warmer colors indicate higher ratios. The diagonal line (α=β) is parametrized by θ. au = arbitrary units. DOI: http://dx.doi.org/10.7554/eLife.20782.005
Figure 4.
Figure 4.. Growth of the vocal tract.
(a) Change in dominant frequency of infant marmoset calls during development. Yellow curve shows the value of resonant frequency fitted by the biomechanical model. Red dots are the mean dominant frequency of each postnatal day for all 10 infants (n=301 sessions). (b) Vocal tract length estimated by the model assuming a closed-closed cylindrical tube (brown curve); shaded region indicates 95% confidence interval. (c) Infant marmosets produce calls that maximize distance and efficiency. Therefore, the cost C(θ) of producing a call is inversely related to the gain g(θ). (d) Cost function to produce calls at different air pressure and vocal fold tension values (θ). Blue, yellow, and green dots indicate parameter regions for cry, subharmonic-phee, and phee production, respectively. Minimal cost is achieved for phees, which have glottal air flow oscillating at the natural frequency of the vocal cavity; θ-axis is in log-scale. (e) Probability density to produce calls at different θ values; color code is the same as in (d). Increasing η concentrates probability in the parameter range that produces phees. (f) Population and model phee/cry ratios. Purple line is the population value of phee/cry ratio for the real marmoset infant data; shaded region indicates 95% confidence interval (n=195 sessions). Gray lines indicate phee/cry ratios predicted by the model for different values of η. (g) Growth (lengthening) of the vocal tract can explain the lowering of the dominant frequency, but not the transition from cries to phees. DOI: http://dx.doi.org/10.7554/eLife.20782.006
Figure 5.
Figure 5.. Development of muscular control in the vocal apparatus.
(a) Muscular control necessary to produce different air pressure and vocal fold tension; higher values of λ imply a greater effort to produce given air pressure and vocal fold tension. Blue, yellow, and green dots indicate parameter regions for cry, subharmonic-phee, and phee production, respectively. (b) Cost functions for different values of λ. (c) Probability to produce calls at different air pressure and vocal fold tension. For higher values of λ, probability to produce phee diminishes and the probability to produce cries increases. (d) Phee/cry ratio fitted by the model (white curve). Colors indicate the probability density of the phee/cry ratio for the marmoset population (n=195 sessions); warmer colors indicate higher probability densities. (e) Estimated muscle effort coefficient (λ) during development (brown curve); shaded region indicates 95% confidence interval (n=195 sessions). (f) Relationships between the probability of contingent parental responses and zero-crossing day for real data (purple line) and the model (gray line); shaded region indicates 95% confidence interval (n=10 infants). (g) Changes in muscular control can explain the population change in the phee/cry ratio, but not the social feedback-influenced the individual timing of this transition. DOI: http://dx.doi.org/10.7554/eLife.20782.007
Figure 6.
Figure 6.. Learning in the developing nervous system.
(a) Developmental change of λ for different values of the probability of contingent parental response, F, with constant learning parameter κ=0.2126 (see Materials and methods: The full cost function and more parameter choices). Higher values of parental feedback cause faster decay of λ. (b) Predicted phee/cry ratios for different values of the probability of contingent parental responses. Higher values of parental feedback cause earlier and faster transitions from cries to phees. Color code is the same as in (a). (c) Relationship between the probability of contingent parental response and zero-crossing day; blue dots represent real data (n=10 infants) and yellow line is the model fit. (d) Changes in the nervous system can explain the relation between the rate of transition from cries to phees and the probability of contingent parental feedback, but not the amount of parental feedback. DOI: http://dx.doi.org/10.7554/eLife.20782.008
Figure 7.
Figure 7.. Relationship between parental feedback and infant growth.
(a) Relationship between rate of infant weight change W and the probability of parental responses F. Red circles represent data (n=10 infants). Line indicates linear fit; r= Pearson correlation. (b) Relationship between rate of infant phee call production N and probability of parental responses F; plot convention as in (a). DOI: http://dx.doi.org/10.7554/eLife.20782.009
Figure 8.
Figure 8.. Waddington landscape for vocal development.
(a) Developmental changes associated with each vocal component: vocal tract length L, neuromuscular maturation δ, learning rate κ, and parental feedback F. (b) Different components of vocal behavior change distinct features of the developmental landscape. Similar colors indicate regions with the same cost values; darker colors indicate lower costs. The blue solid line shows the natural frequency of the vocal tract, which depends upon its length L. Neuromuscular maturation parameter δ changes the shape of the landscape. The nervous system, influenced by parental feedback κF, changes the slope of the landscape, speeding up development as t increases; θ-axis represents values in logarithmic scale. (c) Change in landscape as vocal tract length L increases for fixed δ,κF (left to right). (d) Change in landscape as neuromuscular maturation δ increases for fixed L,κF (left to right). (e) Change in landscape as learning rate κ times amount of parental feedback F increases for fixed L,δ (left to right). See Table 2 for parameter values. DOI: http://dx.doi.org/10.7554/eLife.20782.010
Figure 9.
Figure 9.. Producing marmoset cries and phees with the model.
(a) Trajectories of x plotted vs. y for Equation (14) for a cry (left) and a phee (right). Parameter values (α,β)=(0.09364,0.088) for cry and (0.151,0.895) for phee respectively. (b) Glottal air flows Pglottal produced by the model and (c) vocalizations Psound produced after resonance in the vocal tract for a cry and a phee. (d) Cry and phee waveforms for calls recorded from infant marmosets; compare with model waveforms shown in (c). Note different vertical scales on left and right columns, indicating that phees are substantially louder than cries. DOI: http://dx.doi.org/10.7554/eLife.20782.012
Figure 10.
Figure 10.. Bifurcation set and phase portraits of the model (Equation (14)).
Top left panel shows the bifurcation set in the parameter space spanned by air pressure and muscle tension (α,β). Solid curves indicate saddle-node bifurcations in which pairs of fixed points disappear leaving regions II, III and IV, and Hopf bifurcations in which a stable limit cycle appears entering region I from region V and region III from region IV. Phase portraits in (x,y)-space illustrate vocal fold dynamics in regions I-V. Sustained oscillations surrounding a source produce calls in region I; a source, sink and saddle coexist with a small limit cycle in region III, but viable calls are not produced. A unique sink exists in region V, two sinks and a saddle in region IV, and a sink, saddle and source in region II; no sustained oscillations appear in these regions. Solid part of the line labeled θ starting at the Takens-Bogdanov point indicates the axis used in evaluating cost functions. Note that region of (α,β)-parameter space is smaller than that in Figure 3f–i. DOI: http://dx.doi.org/10.7554/eLife.20782.013
Figure 11.
Figure 11.. The larynx and glottis model.
The coordinate system is shown with fixed depth l, lateral displacement x(t) at midpoint, cross sectional areas a1,a2 at larynx entry and exit, ag at midpoint, air pressures P1,P2, and prephonatory widths x01,x02 at entry and exit. Adapted from Titze (1988). DOI: http://dx.doi.org/10.7554/eLife.20782.015

References

    1. Amador A, Mindlin GB. Beyond harmonic sounds in a simple model for birdsong production. Chaos: An Interdisciplinary Journal of Nonlinear Science. 2008;18:043123. doi: 10.1063/1.3041023. - DOI - PubMed
    1. Amador A, Perl YS, Mindlin GB, Margoliash D. Elemental gesture dynamics are encoded by song premotor cortical neurons. Nature. 2013;495:59–64. doi: 10.1038/nature11967. - DOI - PMC - PubMed
    1. Amador A. PhD thesis. University of Buenos Aires; 2009. Nonlinear effects in the generation of birdsong.
    1. Bezerra BM, Souto A. Structure and usage of the vocal repertoire of callithrix jacchus. International Journal of Primatology. 2008;29:671–701. doi: 10.1007/s10764-008-9250-0. - DOI
    1. Bird R, Stewart W, Lightfoot E. Transport phenomena. New York: John Wiley & Sons; 2007.

Publication types

LinkOut - more resources