. 2017 Jan 16:6:e24149.
doi: 10.7554/eLife.24149.

Cryo-EM structure of the ATP-sensitive potassium channel illuminates mechanisms of assembly and gating

Affiliations

Cryo-EM structure of the ATP-sensitive potassium channel illuminates mechanisms of assembly and gating

Gregory M Martin et al. Elife. .

Abstract

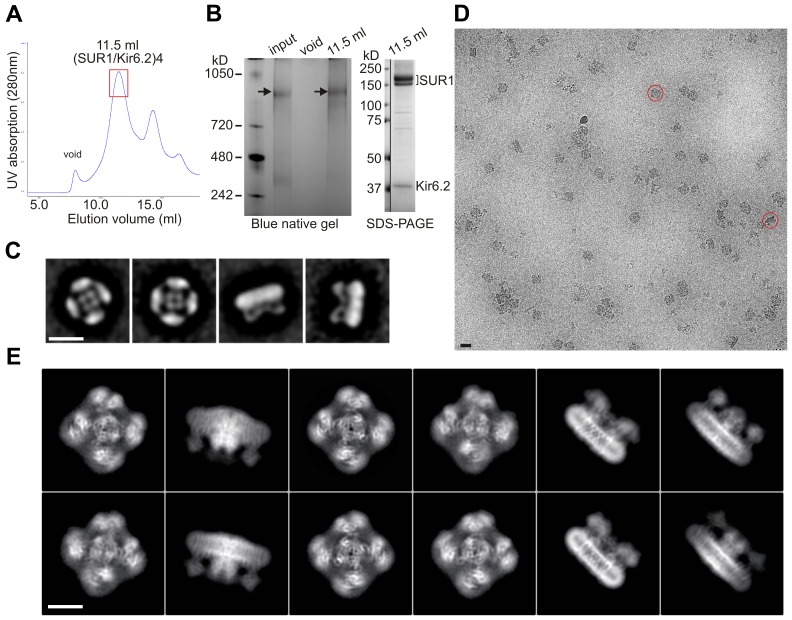
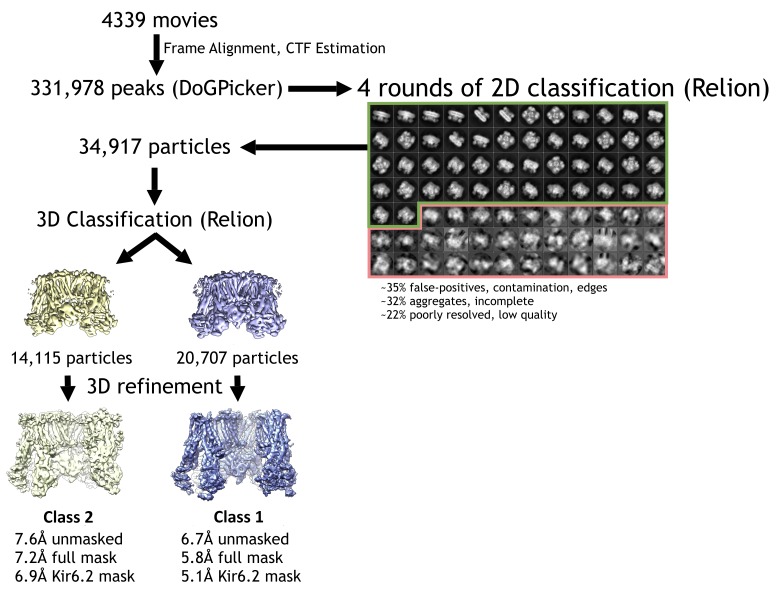
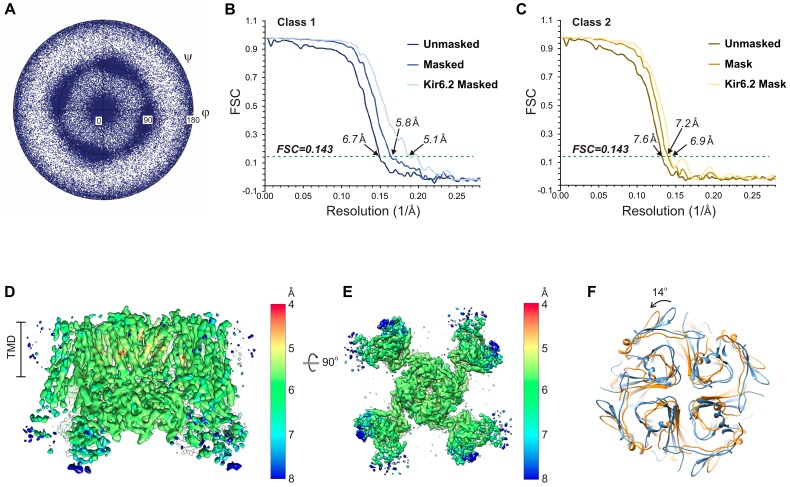
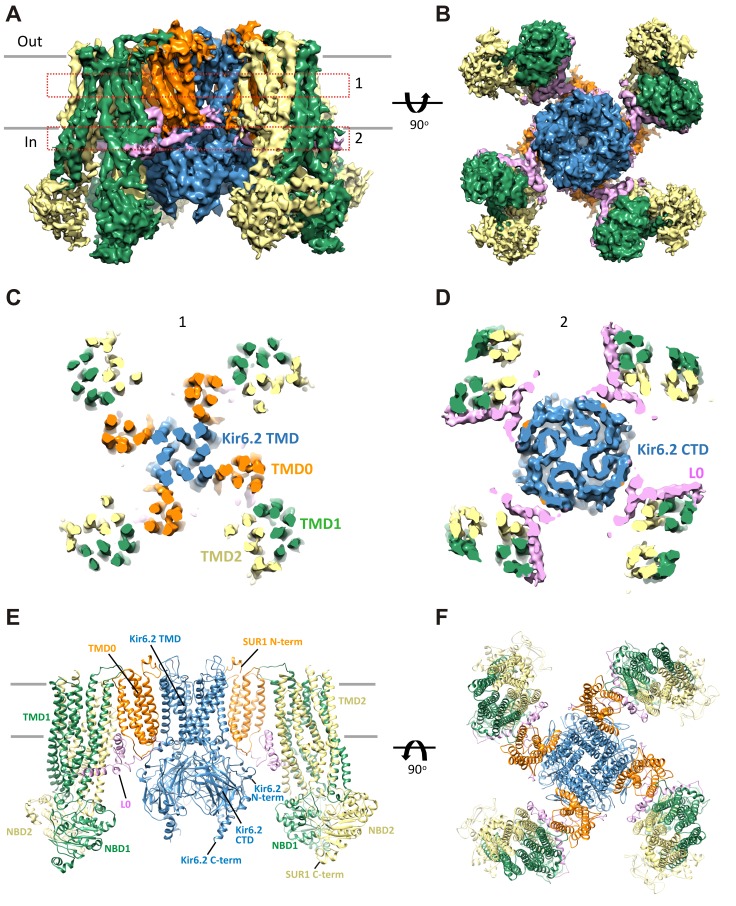
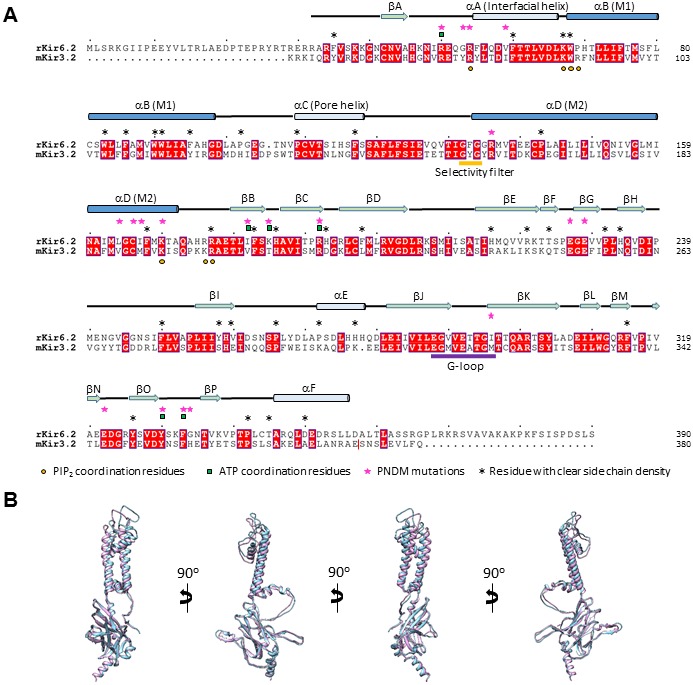
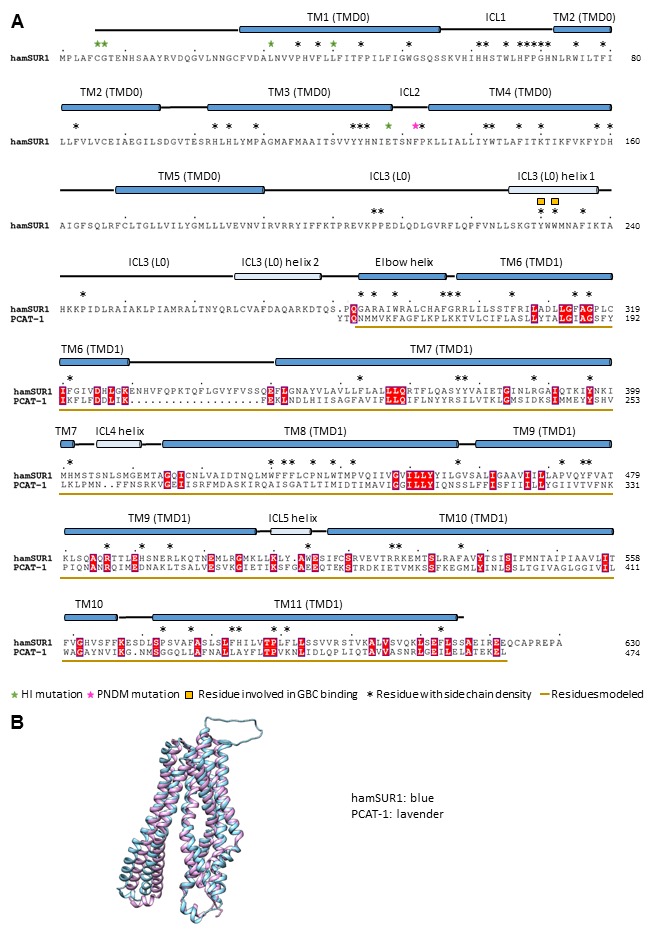
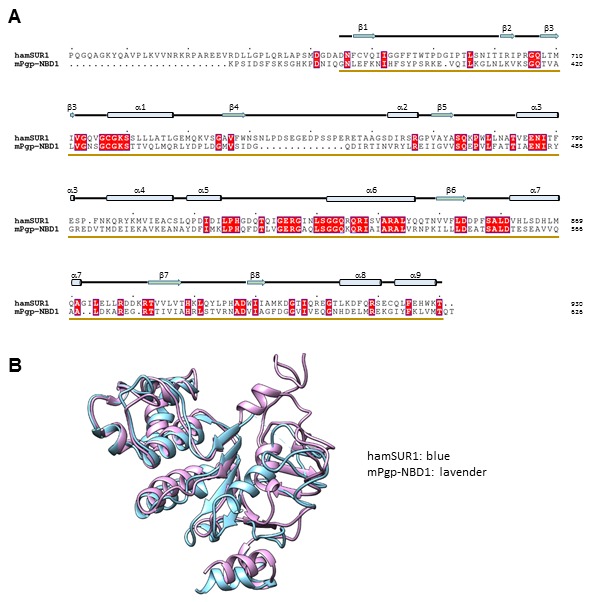
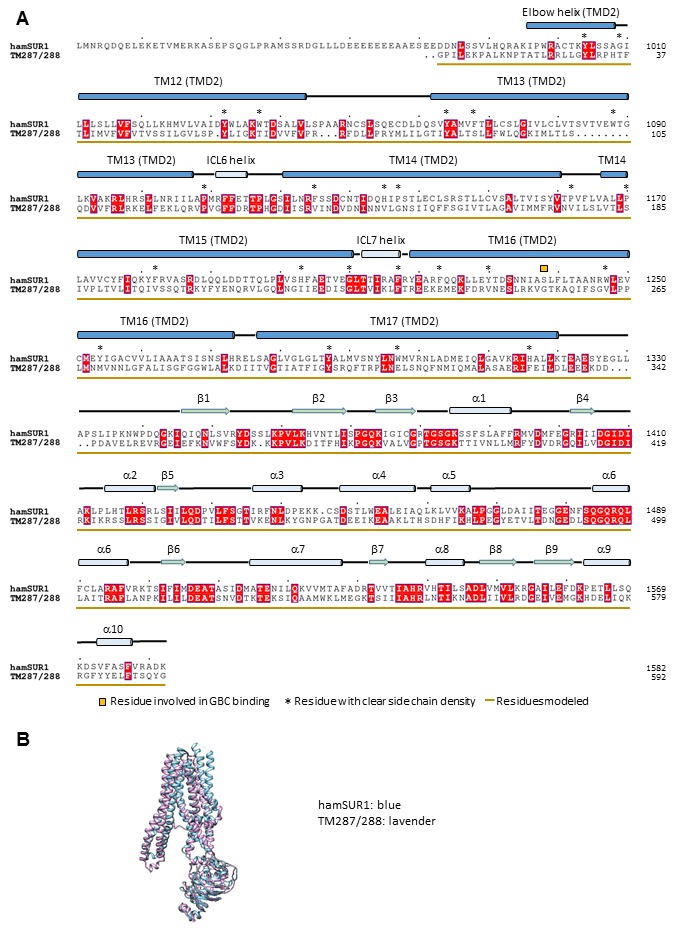
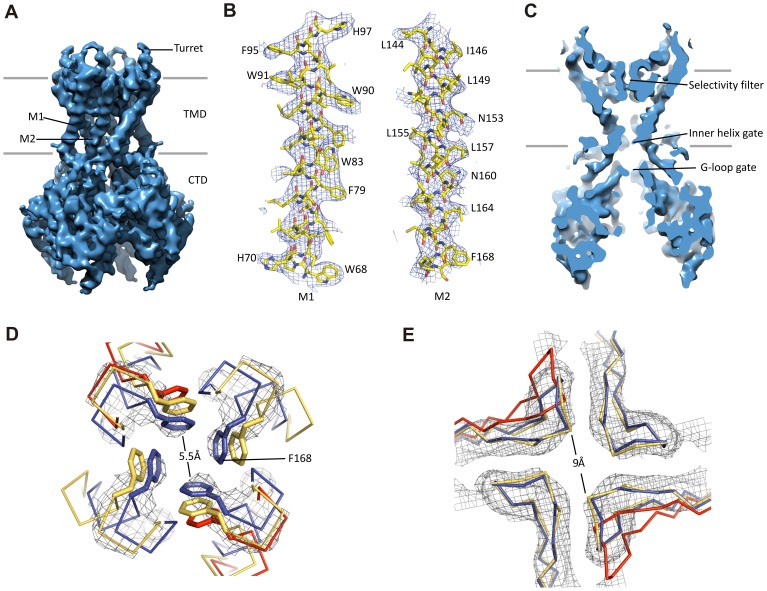
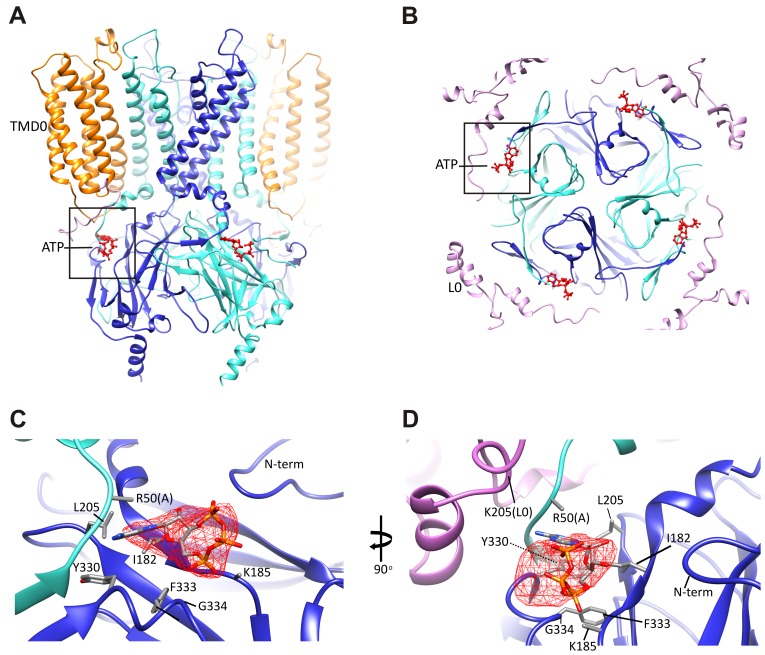
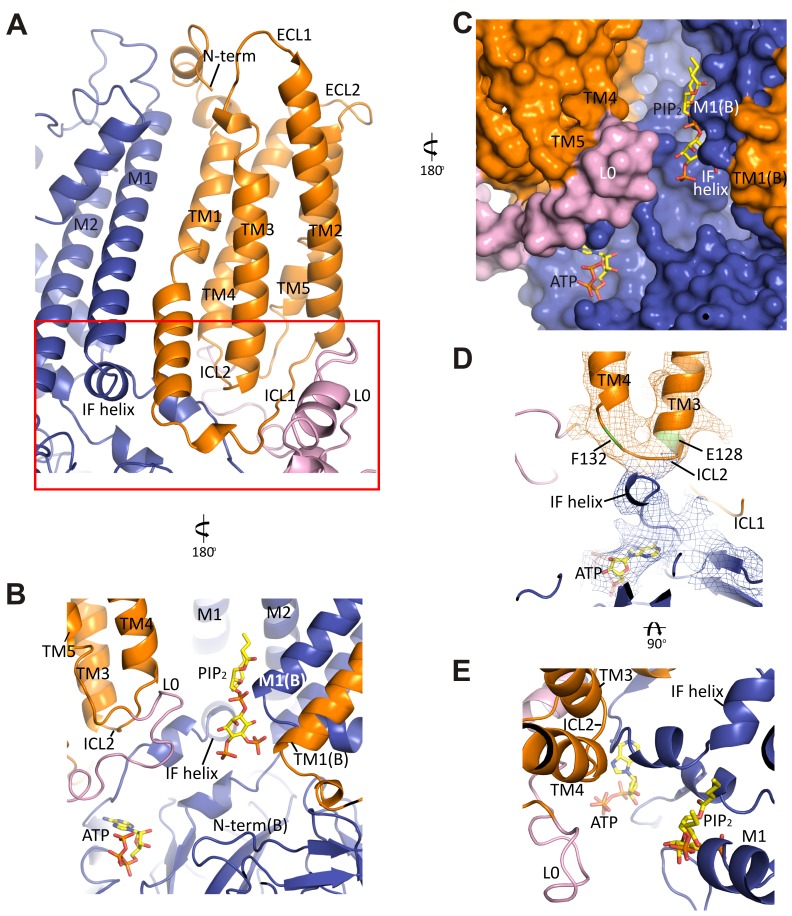
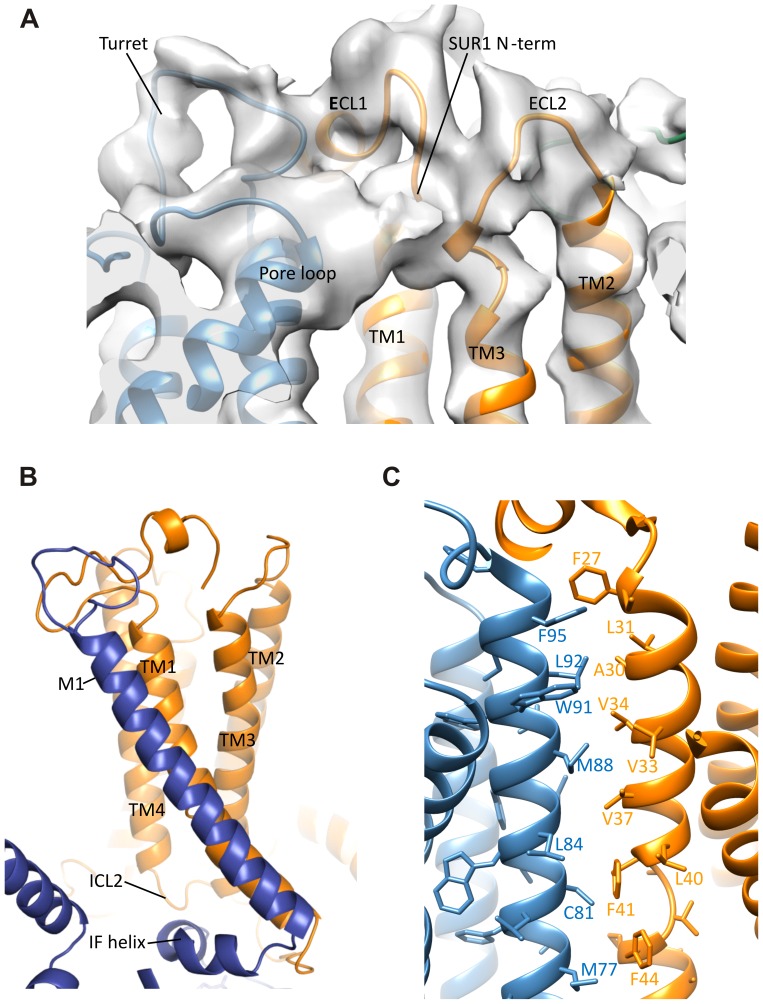
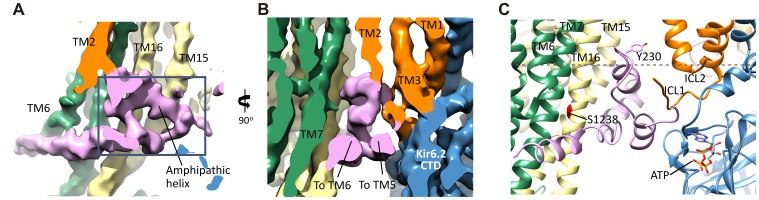
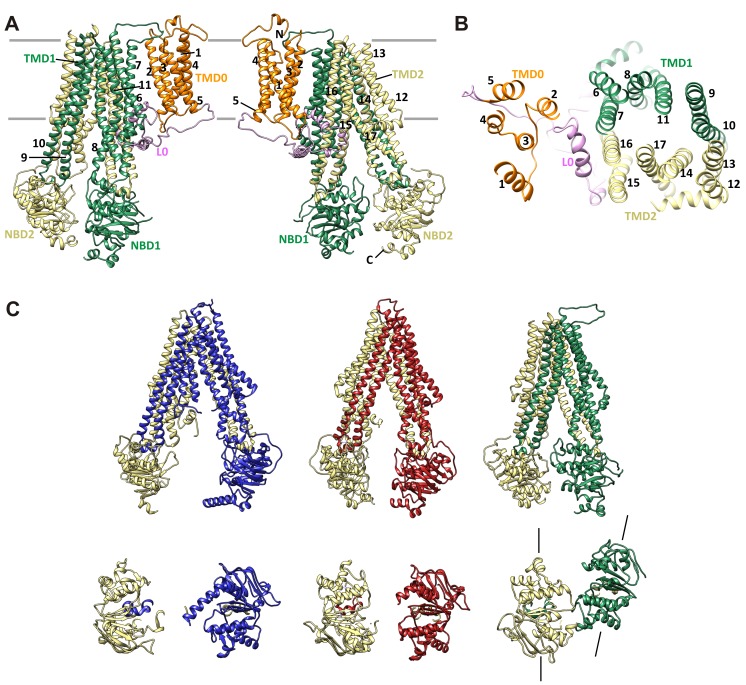
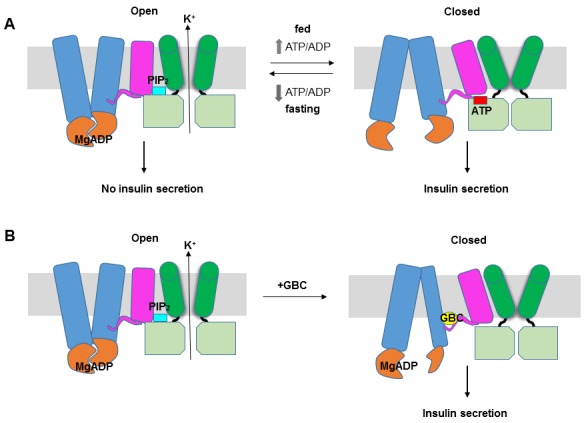
KATP channels are metabolic sensors that couple cell energetics to membrane excitability. In pancreatic β-cells, channels formed by SUR1 and Kir6.2 regulate insulin secretion and are the targets of antidiabetic sulfonylureas. Here, we used cryo-EM to elucidate structural basis of channel assembly and gating. The structure, determined in the presence of ATP and the sulfonylurea glibenclamide, at ~6 Å resolution reveals a closed Kir6.2 tetrameric core with four peripheral SUR1s each anchored to a Kir6.2 by its N-terminal transmembrane domain (TMD0). Intricate interactions between TMD0, the loop following TMD0, and Kir6.2 near the proposed PIP2 binding site, and where ATP density is observed, suggest SUR1 may contribute to ATP and PIP2 binding to enhance Kir6.2 sensitivity to both. The SUR1-ABC core is found in an unusual inward-facing conformation whereby the two nucleotide binding domains are misaligned along a two-fold symmetry axis, revealing a possible mechanism by which glibenclamide inhibits channel activity.

Keywords: ABC transporter; ATP; biophysics; inward rectifier; none; structural biology; sulfonylurea; sulfonylurea receptor.


Conflict of interest statement

The authors declare that no competing interests exist.

Figures

Figure 1.
Figure 1.. Purification and single-particle EM imaging of the SUR1/Kir6.2 KATP channel.
(A) Size exclusion chromatography (SEC) profile of affinity purified KATP channels on a Suprose 6 column showing peak elution at ~11.5 ml (the red rectangle). (B) Left: Blue native gel showing the size of the purified complex at ~1 mDa (arrow) corresponding to four SUR1 and four Kir6.2. Input: samples eluted from anti-FLAG M2 agarose beads; void: sample from the SEC void fraction; 11.5 ml: sample from the SEC 11.5 ml elution fraction. Right: SDS-PAGE of the 11.5 ml fraction showing SUR1 (lower band: core-glycosylated; upper band: complex-glycosylated) and Kir6.2 as the main proteins. A vertical line separates MW markers from the sample lane in the same gel. (C) Negative-stain two-dimensional class averages showing topdown views (1, 2) and side views (3, 4) of the channel complex. (D) A representative cryoEM micrograph of KATP channel particles imaged on an UltrAufoil grid. (E) Representative two-dimensional class averages of KATP channels. DOI: http://dx.doi.org/10.7554/eLife.24149.003
Figure 1—figure supplement 1.
Figure 1—figure supplement 1.. Cryo-EM data processing flowchart.
DOI: http://dx.doi.org/10.7554/eLife.24149.004
Figure 1—figure supplement 2.
Figure 1—figure supplement 2.. Cryo-EM density map analysis.
(A) Euler angle distribution plot of all particles included in the calculation of the final map. (B and C) Fourier shell coefficient (FSC) curves of unmasked and masked whole complex, as well as masked Kir6.2 maps showing resolutions corresponding to FSC = 0.143 for the two 3D classes. (D and E) 3D density map with colored local resolution viewed from the side (D) and the bottom (E). (F) Comparison of the cytoplasmic domain of Kir6.2 of the two 3D classes showing a counterclockwise rotation of ~14° of class 2 relative to class 1. DOI: http://dx.doi.org/10.7554/eLife.24149.005
Figure 2.
Figure 2.. Three-dimensional reconstruction of the KATP channel.
(A) Cryo-EM density map of the KATP channel complex at an overall resolution of 5.8 Å, viewed from the side. The four Kir6.2 subunits in the center are colored blue, SUR1 is in orange (TMD0), lavender (L0), green (TMD1/NBD1), and yellow (TMD2/NBD2). Gray bars indicate approximate positions of the lipid bilayer. (B) View of the complex from the cytoplasmic side. (C and D) Cross-sections of the density map. The planes where the sections 1 and 2 are made are shown in (A). (E) Model of SUR1 and Kir6.2 constructed from the EM density map viewed from the side. A Kir6.2 tetramer and only two SUR1 subunits are shown for clarity. (F) The model viewed from the extracellular side. DOI: http://dx.doi.org/10.7554/eLife.24149.006
Figure 2—figure supplement 1.
Figure 2—figure supplement 1.. Sequence and structure comparison between Kir6.2 and Kir3.2.
(A) Sequence alignment of rat Kir6.2 and mouse Kir3.2. Only the Kir3.2 sequence that was used to solve the structure in the PIP2-bound state is shown (PDB ID: 3SYA; residue 380 in mouse Kir3.2 is marked by a red vertical line on the right). Transmembrane helices in this and Figure 2—figure supplements 2–4 are colored dark blue. Kir6.2 sequence with no corresponding secondary structures shown at the top was not modeled due to lack of density in the map. (B) Superposition of the Kir6.2 structure and the structure of Kir3.2 (PDB ID: 3SYA) viewed from different angles. Blue: Kir6.2; lavender: Kir3.2. DOI: http://dx.doi.org/10.7554/eLife.24149.007
Figure 2—figure supplement 2.
Figure 2—figure supplement 2.. Sequence alignment and structure comparison between SUR1 TMD1 and a bacterial peptidase-containing ABC transporter PCAT-1 (PDB ID: 4RY2).
The structure 4RY2 of PCAT-1 was used for homology modeling of SUR1 TMD1 (a.a. 284–616). (A) Alignment of the hamster SUR1 sequence from 1 to 624 and the sequence of PCAT-1 in the crystal structure 4RY2. (B) Superposition of the PCAT-1 structure 4RY2 and the final model of TMD1 of SUR1. DOI: http://dx.doi.org/10.7554/eLife.24149.008
Figure 2—figure supplement 3.
Figure 2—figure supplement 3.. Sequence alignment and structure comparison between SUR1 NBD1 and the mouse P-glycoprotein NBD1 (PDB ID: 4MLM).
The NBD1 structure of the mouse P-glycoprotein (mPgp; PDB ID: 4MLM) was used for homology modeling of SUR1 NBD1. (A) Alignment of the hamster SUR1 sequence from 631–930 and the sequence of mPgp NBD1 in the crystal structure 4MLM. (B) Superposition of the mPgp-NBD1 and the final modeled NBD1 structure of SUR1. DOI: http://dx.doi.org/10.7554/eLife.24149.009
Figure 2—figure supplement 4.
Figure 2—figure supplement 4.. Sequence alignment and structure comparison between SUR1 TMD2-NBD2 and a bacterial ABC exporter TM287/288 (PDB ID: 4Q4H).
The structure 4Q4H of TM287/288 was used for homology modeling of SUR1 TMD2-NBD2. (A) Alignment of the hamster SUR1 sequence from 961 to 1982 and the sequence of TM287/288 in the crystal structure 4Q4H. (B) Superposition of the TM287/288 structure 4Q4H and the final modeled TMD2-NBD2 structure of SUR1. DOI: http://dx.doi.org/10.7554/eLife.24149.010
Figure 3.
Figure 3.. Kir6.2 in a closed conformation.
(A) Cryo-EM density map of Kir6.2 at 5.1 Å resolution. (B) Density of M1 and M2. Residues with clear side chain density are labeled. (C) A central slice through the density highlighting the ion permeation pathway. (D) View of the inner helix gate (F168) looking down the pore from the extracellular side. Kir3.2 apo (yellow, PDB ID: 3SYO) and Kir3.2-R201A+PIP2 (red, 3SYQ) structures were aligned to the region surrounding the gate. (E) Comparison of G-loop conformations of Kir6.2 and Kir3.2 (3SYO and 3SYQ) by alignment of the cytoplasmic domain; same coloring as in (D). The distance shown in (D) and (E) is between the main chains; the constriction should be even narrower due to side chains that should be protruding into the pore, as is seen in homolgous structures. Density depictions contoured to 2.5σ in (B, D, E). DOI: http://dx.doi.org/10.7554/eLife.24149.012
Figure 4.
Figure 4.. The ATP binding pocket.
(A and B) Overview of ATP site from the side and from the top. (C and D) Difference map calculated from model prior to ATP docking, contoured to 3σ. Residues surrounding the ATP density are labeled. Side chains of residues with supporting density are shown. The N-terminus from Kir6.2 subunit A is colored in cyan and R50 is labeled followed by (A). The adjacent subunit is colored in blue, and SUR1-L0 is colored lavender, with the K205 position labeled. DOI: http://dx.doi.org/10.7554/eLife.24149.013
Figure 5.
Figure 5.. The interface between TMD0 and the N-terminal segment of L0 with Kir6.2.
(A) Overall structure of the interface region, with TMD0 in orange, Kir6.2 in blue, and L0 in lavender. ECL: extracellular loop; ICL: intracellular loop; IF helix: interfacial (slide) helix. (B and C) Detailed view of the region boxed in red in (A) shown in ribbon (B) and surface (C) representations. ATP is docked as in Figure 3 and PIP2 was docked hypothetically using PIP2 bound Kir3.2 and Kir2.2 structures for placement. (D) A side view of the ICL2 showing close interactions with the Kir6.2 IF helix. E128 and F132, mutation of which alters channel Po and ATP sensitivity, are highlighted. (E) A top-down view of this region with both docked ATP (in the back) and PIP2 in view. DOI: http://dx.doi.org/10.7554/eLife.24149.014
Figure 5—figure supplement 1.
Figure 5—figure supplement 1.. Interactions between TMD0 and Kir6.2.
(A) Interactions of SUR1 N-terminus with the pore loop and turret of Kir6.2. Note continuous density extending from the pore loop to the N-term/extracellular loop 2 (ECL2) and from the turret to the short helical segment of ECL1. Map is displayed at 2.5σ. (B) The Kir6.2 M1-SUR1 TM1 interface showing the tight association of these two helices and interaction between ICL2 and the Kir6.2 N-terminal interfacial (IF) helix. (C) Possible hydrophobic interactions between M1 (blue, Kir6.2) and TM1 (orange, SUR1) helices. DOI: http://dx.doi.org/10.7554/eLife.24149.015
Figure 6.
Figure 6.. The SUR1-L0 connecting TMD0/Kir6.2 with the SUR1-ABC core.
(A) View of the L0 region from the side along the plane of the membrane; Kir6.2 density has been removed for clarity. The hairpin structure is outlined. (B) Slice through the N- and C-terminal segments of L0. (C) Model of L0 highlighting relation between Y230 and S1238 (marked red) in TM16, which are separated by ~20 Å (Cα to Cα). Side chain of Y230 is shown based on supporting density. The gray dashed line marks the approximate boundary of the inner leaflet of the lipid bilayer. DOI: http://dx.doi.org/10.7554/eLife.24149.016
Figure 7.
Figure 7.. SUR1 with a twisted ABC core conformation in saturating concentrations of GBC.
(A) Model of SUR1 with the various domains colored as in Figure 1, with each TM helix labeled. On the left, TMD1/NBD1 (green) is toward the front and TMD2/NBD2 (tan) is toward the back. (B) Cross-section of the SUR1 model, showing relative orientation of each of the 17 TM helices and a helix in L0. (C) Comparison of inward-facing ABC transporter structures: From left, C elegans Pgp (PDB code 4 F4C); mouse Pgp (4 M1M); hamSUR1. For each model, TMD2/NBD2 is colored tan. Lines on the side of the SUR1 NBDs denote the relative orientation of the NBD dimerization interface, demonstrating the observed twisting relative to other inward-facing structures. DOI: http://dx.doi.org/10.7554/eLife.24149.017
Figure 8.
Figure 8.. KATP channel gating model.
(A) Cartoon illustrating how changes in the ATP/ADP ratio upon feeding and fasting alter the equilibrium between the inward-facing and outward-facing states of the SUR1-ABC core and interactions of the channel with ATP and PIP2 to control channel activity. (B) Model of the hypothesized mechanism whereby GBC causes misalignment of the NBDs to prevent Mg-nucleotides activation of KATP channels. In both A and B, Kir6.2 transmembrane helices: green; Kir6.2 cytoplasmic domain: lime green; SUR1-TMD0/L0: magenta; SUR1-TMD1/2: blue; SUR1-NBDs: orange; GBC: yellow; ATP: red; PIP2: cerulean. Note the different states shown are not meant to reflect the actual conformational transitions. DOI: http://dx.doi.org/10.7554/eLife.24149.018

Comment in

  • From ions to insulin.
    Kanelis V. Kanelis V. Elife. 2017 Mar 9;6:e25159. doi: 10.7554/eLife.25159. Elife. 2017. PMID: 28276322 Free PMC article.

References

    1. Adams PD, Afonine PV, Bunkóczi G, Chen VB, Davis IW, Echols N, Headd JJ, Hung LW, Kapral GJ, Grosse-Kunstleve RW, McCoy AJ, Moriarty NW, Oeffner R, Read RJ, Richardson DC, Richardson JS, Terwilliger TC, Zwart PH. PHENIX: a comprehensive Python-based system for macromolecular structure solution. Acta Crystallographica Section D Biological Crystallography. 2010;66:213–221. doi: 10.1107/S0907444909052925. - DOI - PMC - PubMed
    1. Aguilar-Bryan L, Nichols CG, Wechsler SW, Clement JP, Boyd AE, González G, Herrera-Sosa H, Nguy K, Bryan J, Nelson DA. Cloning of the beta cell high-affinity sulfonylurea receptor: a regulator of insulin secretion. Science. 1995;268:423–426. doi: 10.1126/science.7716547. - DOI - PubMed
    1. Antcliff JF, Haider S, Proks P, Sansom MS, Ashcroft FM. Functional analysis of a structural model of the ATP-binding site of the KATP channel Kir6.2 subunit. The EMBO Journal. 2005;24:229–239. doi: 10.1038/sj.emboj.7600487. - DOI - PMC - PubMed
    1. Ashcroft FM, Gribble FM. Correlating structure and function in ATP-sensitive K+ channels. Trends in Neurosciences. 1998;21:288–294. doi: 10.1016/S0166-2236(98)01225-9. - DOI - PubMed
    1. Ashcroft FM, Rorsman P. ATP-sensitive K+ channels: a link between B-cell metabolism and insulin secretion. Biochemical Society Transactions. 1990;18:109–111. doi: 10.1042/bst0180109. - DOI - PubMed

Publication types

MeSH terms