

The Effect of Contrast Material on Radiation Dose at CT: Part I. Incorporation of Contrast Material Dynamics in Anthropomorphic Phantoms
- PMID: 28092496
- PMCID: PMC5452884
- DOI: 10.1148/radiol.2016152851
The Effect of Contrast Material on Radiation Dose at CT: Part I. Incorporation of Contrast Material Dynamics in Anthropomorphic Phantoms
Abstract
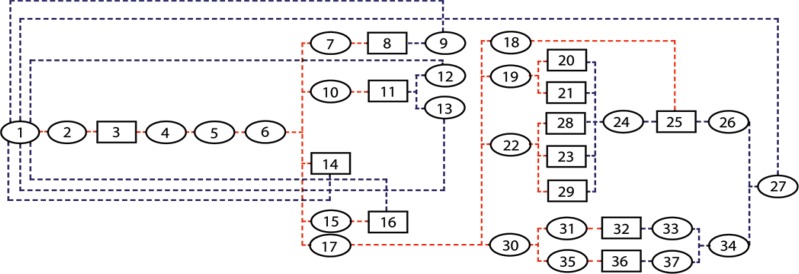
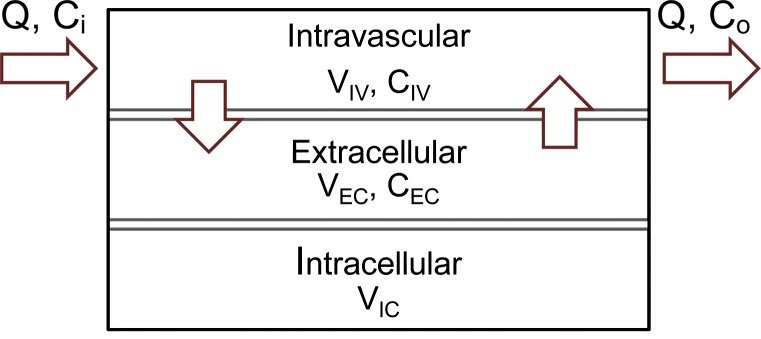
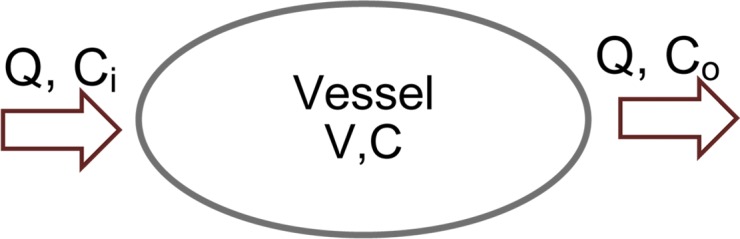
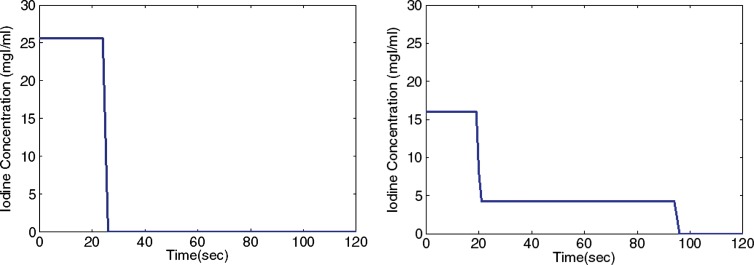
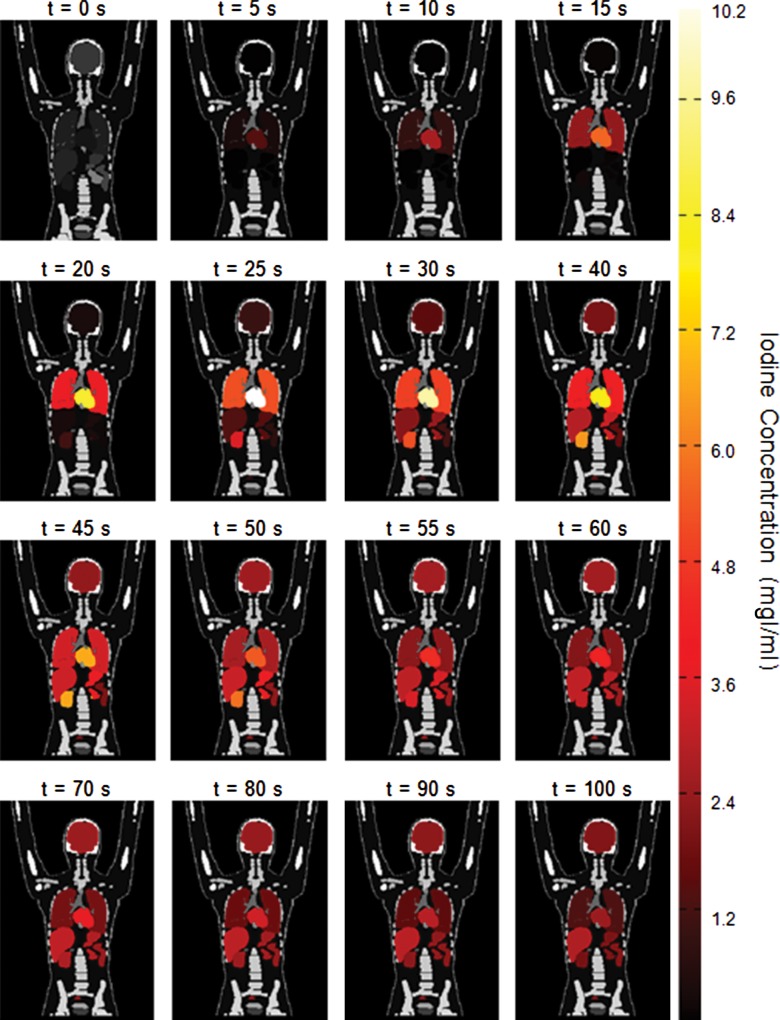
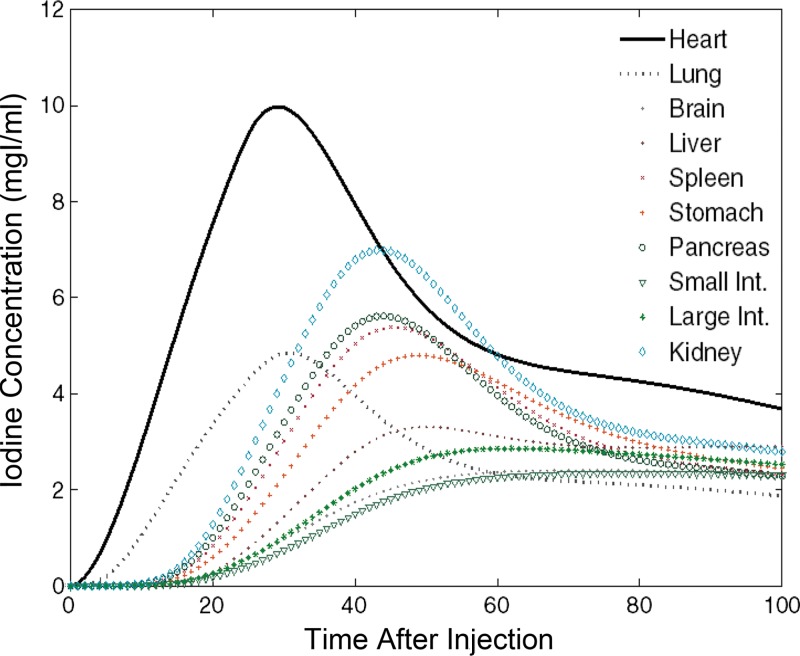
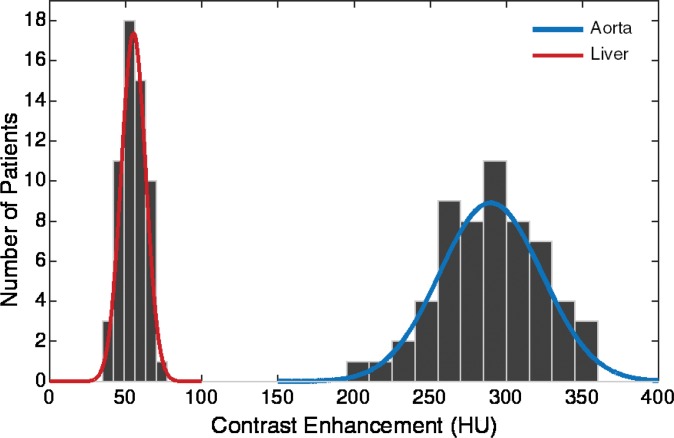
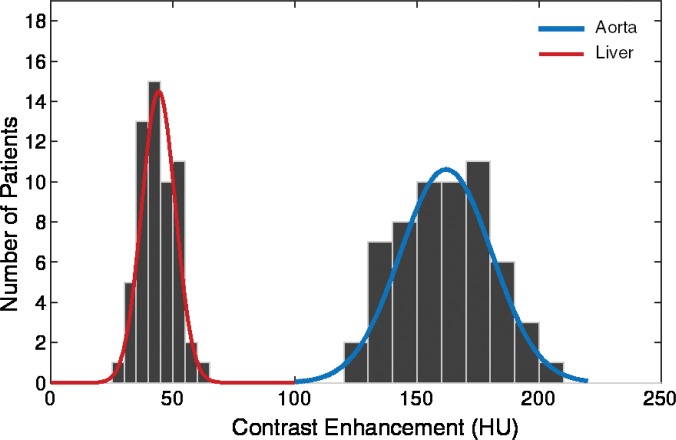
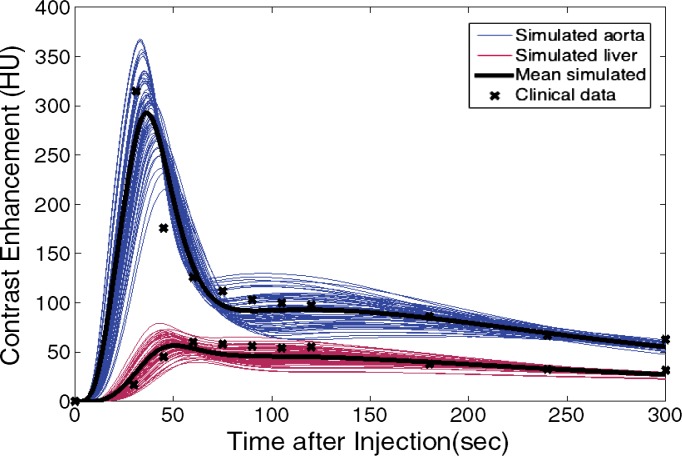
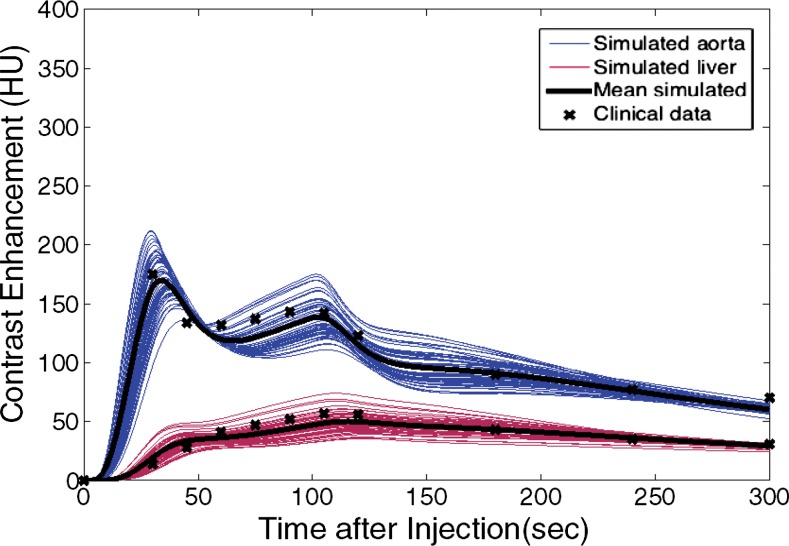
Purpose To develop a method to incorporate the propagation of contrast material into computational anthropomorphic phantoms for estimation of organ dose at computed tomography (CT). Materials and Methods A patient-specific physiologically based pharmacokinetic (PBPK) model of the human cardiovascular system was incorporated into 58 extended cardiac-torso (XCAT) patient phantoms. The PBPK model comprised compartmental models of vessels and organs unique to each XCAT model. For typical injection protocols, the dynamics of the contrast material in the body were described according to a series of patient-specific iodine mass-balance differential equations, the solutions to which provided the contrast material concentration time curves for each compartment. Each organ was assigned to a corresponding time-varying iodinated contrast agent to create the contrast material-enhanced five-dimensional XCAT models, in which the fifth dimension represents the dynamics of contrast material. To validate the accuracy of the models, simulated aortic and hepatic contrast-enhancement results throughout the models were compared with previously published clinical data by using the percentage of discrepancy in the mean, time to 90% peak, peak value, and slope of enhancement in a paired t test at the 95% significance level. Results The PBPK model allowed effective prediction of the time-varying concentration curves of various contrast material administrations in each organ for different patient models. The contrast-enhancement results were in agreement with results of previously published clinical data, with mean percentage, time to 90% peak, peak value, and slope of less than 10% (P > .74), 4%, 7%, and 14% for uniphasic and 12% (P > .56), 4%, 12%, and 14% for biphasic injection protocols, respectively. The exception was hepatic enhancement results calculated for a uniphasic injection protocol for which the discrepancy was less than 25%. Conclusion A technique to model the propagation of contrast material in XCAT human models was developed. The models with added contrast material propagation can be applied to simulate contrast-enhanced CT examinations. © RSNA, 2017 Online supplemental material is available for this article.
Figures
Comment in
-
The Effect of Iodine-based Contrast Material on Radiation Dose at CT: It's Complicated.Radiology. 2017 Jun;283(3):624-627. doi: 10.1148/radiol.2017170611. Radiology. 2017. PMID: 28514218 Free PMC article.
-
Effect of Iodine-based Contrast Material on Radiation Dose at CT.Radiology. 2017 Dec;285(3):1053-1054. doi: 10.1148/radiol.2017171523. Radiology. 2017. PMID: 29155625 Free PMC article. No abstract available.
References
-
- Ho LM, Nelson RC, Delong DM. Determining contrast medium dose and rate on basis of lean body weight: does this strategy improve patient-to-patient uniformity of hepatic enhancement during multi-detector row CT? Radiology 2007;243(2):431–437. - PubMed
-
- Small WC, Nelson RC, Bernardino ME, Brummer LT. Contrast-enhanced spiral CT of the liver: effect of different amounts and injection rates of contrast material on early contrast enhancement. AJR Am J Roentgenol 1994;163(1):87–92. - PubMed
-
- Kondo H, Kanematsu M, Goshima S, et al. Body size indexes for optimizing iodine dose for aortic and hepatic enhancement at multidetector CT: comparison of total body weight, lean body weight, and blood volume. Radiology 2010;254(1):163–169. - PubMed
-
- Sechopoulos I, Ghetti C. Optimization of the acquisition geometry in digital tomosynthesis of the breast. Med Phys 2009;36(4):1199–1207. - PubMed
Publication types
MeSH terms
Substances
Grants and funding
LinkOut - more resources
Full Text Sources
Other Literature Sources
Medical
