. 2017 Mar;49(3):358-366.
doi: 10.1038/ng.3764. Epub 2017 Jan 16.

Limited heterogeneity of known driver gene mutations among the metastases of individual patients with pancreatic cancer

Affiliations

Limited heterogeneity of known driver gene mutations among the metastases of individual patients with pancreatic cancer

Alvin P Makohon-Moore et al. Nat Genet. 2017 Mar.

Abstract

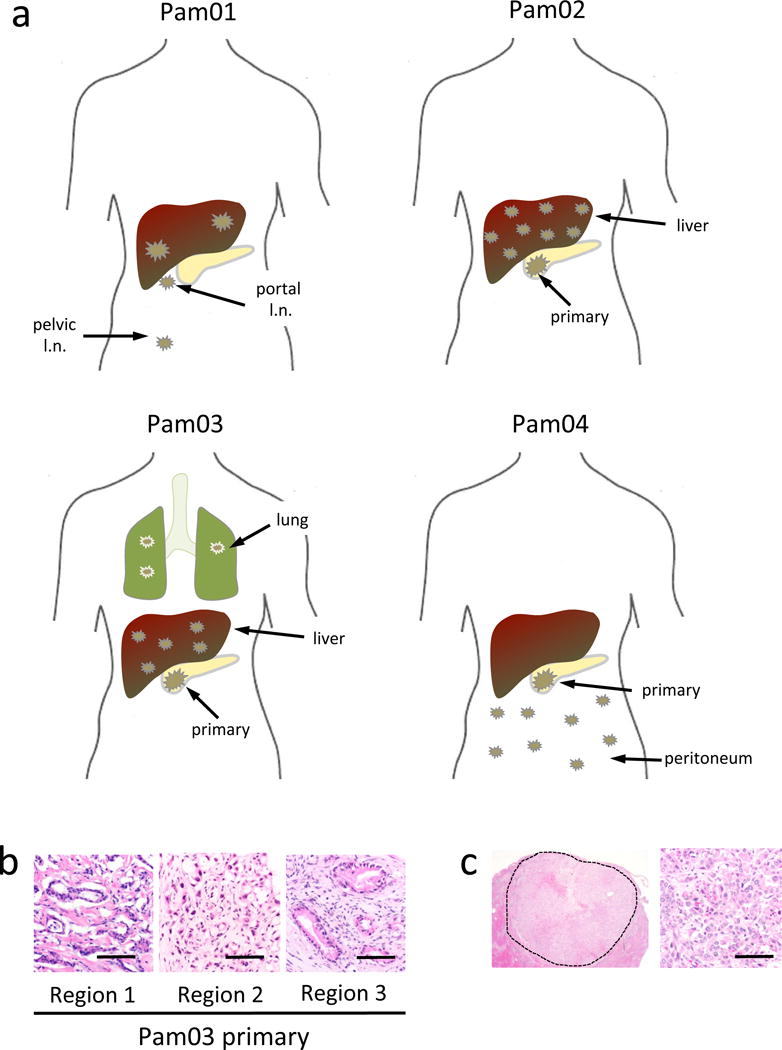
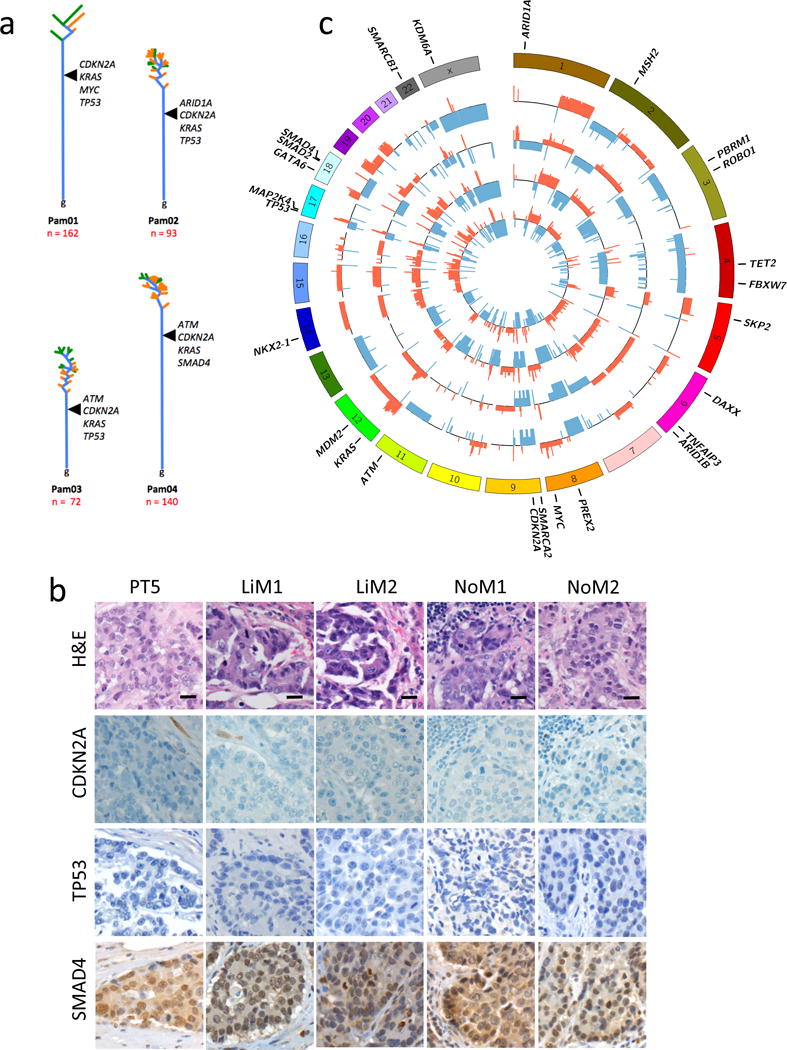
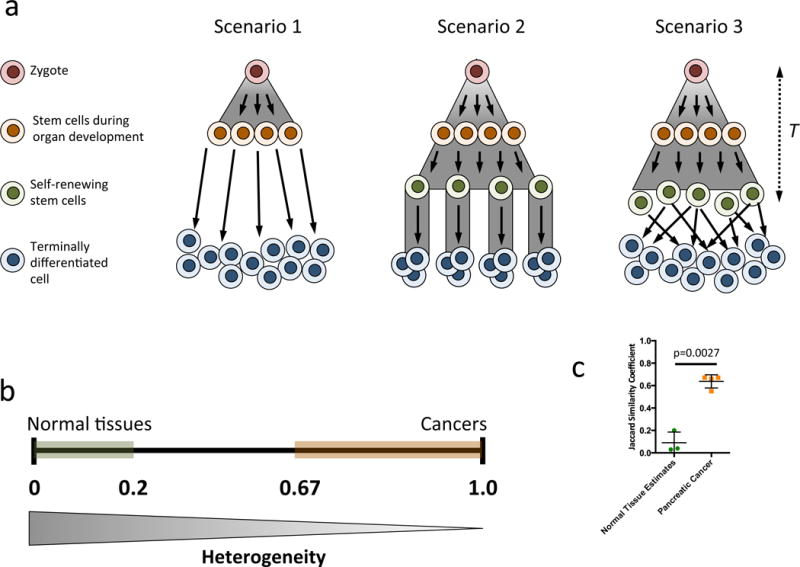
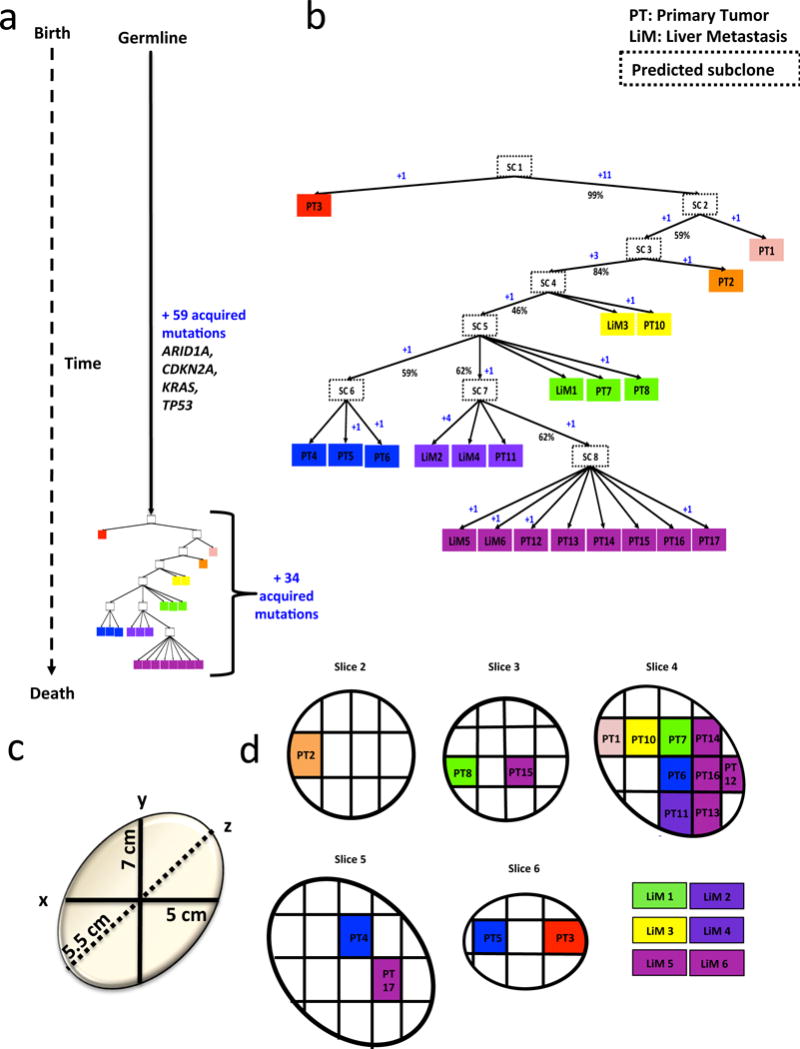
The extent of heterogeneity among driver gene mutations present in naturally occurring metastases-that is, treatment-naive metastatic disease-is largely unknown. To address this issue, we carried out 60× whole-genome sequencing of 26 metastases from four patients with pancreatic cancer. We found that identical mutations in known driver genes were present in every metastatic lesion for each patient studied. Passenger gene mutations, which do not have known or predicted functional consequences, accounted for all intratumoral heterogeneity. Even with respect to these passenger mutations, our analysis suggests that the genetic similarity among the founding cells of metastases was higher than that expected for any two cells randomly taken from a normal tissue. The uniformity of known driver gene mutations among metastases in the same patient has critical and encouraging implications for the success of future targeted therapies in advanced-stage disease.


Conflict of interest statement

COMPETING FINANCIAL INTERESTS

The authors declare no competing financial interests.

Figures

Figure 1
Figure 1. Distributions of metastatic disease of four pancreatic cancer patients
a. Anatomic locations of the primary carcinomas (Pam02–Pam04) and discrete metastases (all cases) used for whole genome sequencing. b. Histology of three geographically-independent primary tumor samples from patient Pam03 used for sequencing. c. Low and high power view of a discrete liver metastasis from patient Pam03. The dashed line in the low power view outlines the borders of the metastasis that measured 1.5 cm in diameter. scale bars, 100 μm.
Figure 2
Figure 2. Features of Phylogenies and Driver Genes in Pam01, Pam02, Pam03, and Pam04
a. Time is represented on the vertical axis, divergence is represented on the horizontal axis. Trunks are colored blue, while branches leading to primary tumors are orange and metastases are green. Each tree is rooted at the germline (“g”). Branch and trunk lengths are relative to the number of underlying variants. Driver alterations are labeled where each is inferred to occur during tumor evolution. b. Representative immunolabeling for CDKN2A, TP53, and SMAD4 illustrating the concordance of labeling for each sample analyzed by WGS for Pam01 in the matched available formalin-fixed paraffin embedded tumor tissues for the primary tumor (PT5) and metastases LiM1, LiM2, NoM1 and NoM2. scale bars, 10 μm. c. CIRCOS plots showing statistically significant copy number variants among Pam01 whole genome samples. For each sample ring, the y-axis spans −2 to 2, with 0 representing a normal diploid copy number in unaffected regions, deletions as a −1 or −2, and amplifications as 1 or 2. Copy number variants > 2 are scored as 2. All values were log 2 transformed for visualization. The outermost ring shows the chromosomes in a clock-wise order. Deletions are shown in blue while amplifications are red. Gene names are those described in Supplemental Table 7. From innermost to outermost the samples are PT5, LiM1, LiM2, NoM1 and NoM2.
Figure 3
Figure 3. Somatic evolution of normal tissues
a. Three hypothetical scenarios for normal tissue somatic evolution are considered, T (far right) indicates time. In (1) the organ follows a pure birth process for development with no further cell division. In (2), the organ follows a pure birth process for development of stem cells, each founding a single crypt and dividing over time. The organ in (3) follows the same development as (2) but with substantial mixing and replacement of stem cells. b. The expected Jaccard similarity coefficient, with 0 for no identical mutations and 1 for complete genetic identity among any two cell lineages. The coefficient ranges for normal tissues and metastases are shown in green and red, respectively. The similarity coefficient among the stem-cell-like cells (orange cells in (1); green cells in (2) and (3)) was always below 0.2 in all three scenarios for relevant parameter values. Accounting for possibly additional mutations in short-lived terminally differentiated cells would further increase the heterogeneity within an organ. c. Scatterplot demonstrating that the three types of normal tissue estimates have significantly lower Jaccard similarity coefficients (p=0.0027).
Figure 4
Figure 4. Inferred phylogeny and three dimensional geography of primary tumor sections and metastases for patient Pam02
Phylogeny was inferred by Treeomics. See Supplemental Table 3 for sample identity. a. Time is represented on the left axis, divergence is represented on the horizontal axis. Colors indicate discrete tumor samples and follow the rainbow spectrum, scaling from ancestral to descendant as indicated by the evolutionary relationships. b. Phylogenetic tree relative to time and number of acquired mutations. Primary tumors are labeled at “PT” followed by sequential numbers, the remaining samples are liver mets labeled as LiM and also followed by a sequential number. Hypothetical subclones are indicated by “SC” followed by the subclone number and enclosed by a dashed outline. The numbers of acquired mutations are in blue font with a “+” sign. Percentages denote bootstrapping values. c. The three dimensional size of the original primary tumor in centimeters. d. Primary tumor slices are numbered according to the original sectioning and plane order.

Comment in

References

    1. Greaves M, Maley CC. Clonal evolution in cancer. Nature. 2012;481:306–13. - PMC - PubMed
    1. Alizadeh AA, et al. Toward understanding and exploiting tumor heterogeneity. Nat Med. 2015;21:846–853. - PMC - PubMed
    1. Yates LR, et al. Subclonal diversification of primary breast cancer revealed by multiregion sequencing. Nat Med. 2015;21:751–9. - PMC - PubMed
    1. Gerlinger M, et al. Genomic architecture and evolution of clear cell renal cell carcinomas defined by multiregion sequencing. Nat Genet. 2014;46:225–33. - PMC - PubMed
    1. de Bruin EC, et al. Spatial and temporal diversity in genomic instability processes defines lung cancer evolution. Science (80-) 2014;346:251–256. - PMC - PubMed