Review
. 2017 Jan:50:e1.
doi: 10.1017/S0033583516000159.

Structural biology of supramolecular assemblies by magic-angle spinning NMR spectroscopy

Affiliations
Review

Structural biology of supramolecular assemblies by magic-angle spinning NMR spectroscopy

Caitlin M Quinn et al. Q Rev Biophys. 2017 Jan.

Abstract

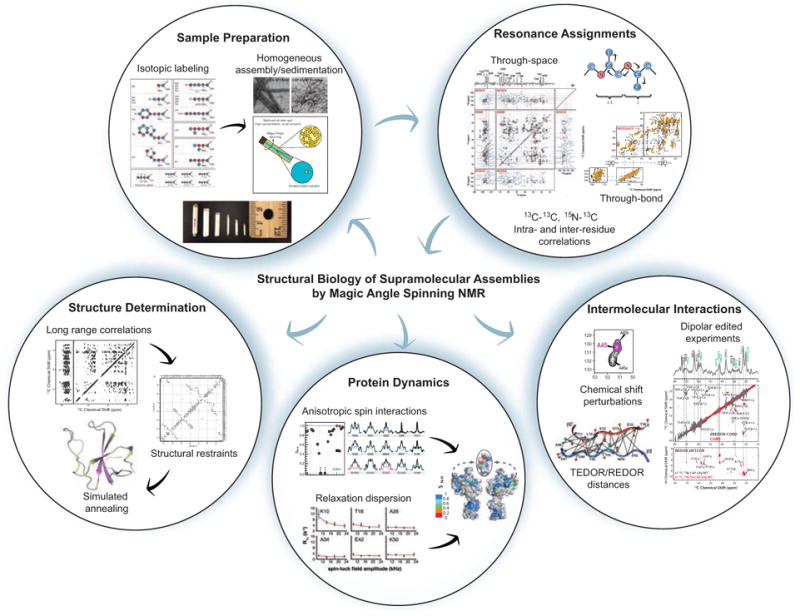
In recent years, exciting developments in instrument technology and experimental methodology have advanced the field of magic-angle spinning (MAS) nuclear magnetic resonance (NMR) to new heights. Contemporary MAS NMR yields atomic-level insights into structure and dynamics of an astounding range of biological systems, many of which cannot be studied by other methods. With the advent of fast MAS, proton detection, and novel pulse sequences, large supramolecular assemblies, such as cytoskeletal proteins and intact viruses, are now accessible for detailed analysis. In this review, we will discuss the current MAS NMR methodologies that enable characterization of complex biomolecular systems and will present examples of applications to several classes of assemblies comprising bacterial and mammalian cytoskeleton as well as human immunodeficiency virus 1 and bacteriophage viruses. The body of work reviewed herein is representative of the recent advancements in the field, with respect to the complexity of the systems studied, the quality of the data, and the significance to the biology.


Figures

Fig. 1
Fig. 1
Workflow for studies of biological supramolecular assemblies by magic angle spinning NMR. Preparation of homogeneous, isotopically labeled samples and resonance assignments are the first steps of any structural biology study by MAS NMR. Resonance assignments and other experiments exploit two types of inter-nuclear correlations: through-space (dipolar-based), which selects for rigid residues, and through-bond (scalar or J coupling based), which selects for dynamic residues. Biological questions that can be addressed by MAS NMR include structure determination, protein dynamics, and intermolecular interactions. Protein structure determination generally entails first obtaining long-range, inter-nuclear distance correlations, often combined with other structural restraints, and subsequently input into simulated annealing protocols for structure calculation. Two approaches commonly used for the determination of site-specific millisecond to nanosecond protein dynamics are relaxation dispersion and measurement of reduced anisotropic interactions (e.g. chemical shift anisotropy or dipolar interactions). Finally, MAS NMR can characterize protein-protein and protein-ligand intermolecular interactions. Methods for observing these intermolecular interfaces include chemical shift perturbations, dipolar filtered experiments such as dREDOR, and quantitative distance measurements with REDOR/TEDOR based experiments. Isotopic labeling schematic reprinted with permission from Higman et al., J. Biomol. NMR, 2009, 44, 245–260. Copyright 2009 Springer (Higman et al., 2009). Sedimented solute NMR (SedNMR) figure adapted with permission from Bertini et al., Acc. Chem. Res., 2013, 46 (9), 2059–2069. Copyright 2013 American Chemical Society (Bertini et al., 2013). CA-SP1 A92E TEM image and through-space and through-bond correlation experiments reprinted with permission from Han et al., J. Am. Chem. Soc., 2013, 135 (47), 17793–17803. Copyright 2013 American Chemical Society (Han et al., 2013). Structure determination and chemical shift perturbation figures and adapted with permission Yan et al., J. Mol. Biol., 2013, 425 (22), 4249–4266. Copyright 2013 Elsevier (Yan et al., 2013a). Anisotropic spin interactions and protein dynamics/structure figures adapted with permission from Lu et al., Proc. Nat. Acad. Sci., 2015, 112 (47), 14617–14622. Copyright 2015 National Academy of Sciences (Lu et al., 2015a). dREDOR figure and CAP-Gly/MT complex TEM adapted with permission from Yan et al., Proc. Nat. Acad. Sci., 2015, 112 (47), 14611–14616. Copyright 2015 National Academy of Sciences (Yan et al., 2015a). TEDOR/REDOR distances figure reprinted with permission from Nieuwkoop et al., J. Am. Chem. Soc., 2010, 132 (22), 7570–7571. Copyright 2010 American Chemical Society (Nieuwkoop & Rienstra, 2010). Relaxation dispersion figure reprinted with permission from Lewandowski et al., J. Am. Chem. Soc., 2011, 133, 16762–16765. Copyright 2011 American Chemical Society (Lewandowski et al., 2011b).
Fig. 2
Fig. 2
(a) Schematic for homonuclear and heteronuclear third spin assisted recoupling, a second-order mechanism which uses the dipolar couplings with a third spin to achieve magnetization transfer (De Paepe et al., 2011). (b) Pulse sequence for 2D 15N-13C PAIN-CP heteronuclear correlation experiment (De Paepe et al., 2011). (c) 2D homonuclear PAR pulse sequence (De Paepe et al., 2008). (d) 15N-13C correlation spectra of MLF: (top) DCP, (bottom) PAIN-CP, demonstrating the more efficient magnetization transfer of PAIN-CP (Lewandowski et al., 2007). (e) Pulse sequence for 15N-13C heteronuclear z-filtered TEDOR correlations (Jaroniec et al., 2002). Shaded portions indicate z-filters incorporated to eliminate artifacts arising 13C-13C J couplings in uniformly labeled samples. (a) and (b) Reprinted with permission from de Paepe et al., J. Chem. Phys., 2011, 139 (9). Copyright 2011 AIP Publishing. (c) Reprinted with permission from de Paepe et al., J. Chem. Phys., 2008, 129 (24). Copyright 2008 AIP Publishing. (d) Reprinted with permission from Lewandowski et al., J. Am. Chem. Soc., 2007, 129 (4), 728–729. Copyright 2007 American Chemical Society. (e) Reprinted with permission from Jaroniec et al., J. Am. Chem. Soc., 2002, 124 (36), 10728–10742. Copyright 2002 American Chemical Society.
Fig. 3
Fig. 3
Scalar-based correlation experiments frequently used in the solid state. (a) Heteronuclear 1H-13C INEPT pulse sequence (Elena et al., 2005), (b) homonuclear 13C-13C TOBSY pulse sequence (Hardy et al., 2001), (c) homonuclear 13C-13C INADEQUATE pulse sequences, (top) solid-state INADEQUATE, (bottom) refocused INADEQUATE (Lesage et al., 1999). (d) 1H-13C INEPT (black) and 13C-13C INEPT-TOBSY spectra (green) of HET-s amyloids (Wasmer et al., 2009). (e) Direct (black) and CP (orange) INADEQUATE spectra of CA-SP1 tubular assemblies (Han et al., 2013). (a) Adapted with permission from Elena et al., J. Am. Chem. Soc., 2005, 127 (49), 17296–17302. Copyright 2005 American Chemical Society. (b) Adapted with permission from Hardy et al., J. Magn. Reson., 2001, 148 (2), 459–464. Copyright 2001 Elsevier. (c) Reprinted with permission from Lesage et al., J. Am. Chem. Soc., 1999, 121 (47), 10987–10993. Copyright 1999 American Chemical Society. (d) Reprinted with permission from Wasmer et al., J. Mol. Biol., 2009, 394 (1), 119–127. Copyright 2009 Elsevier. (e) Reprinted with permission from Han et al., J. Am. Chem. Soc., 2013, 135 (47), 17793–17803. Copyright 2013 American Chemical Society.
Fig. 4
Fig. 4
(a) PDB structures determined by solid-state NMR each year. Blue indicates structures determined by MAS NMR alone while orange indicates structures determined with an integrated approach, including methods such as electron microscopy or solution NMR in addition to SSNMR data. Year 2015 includes structures deposited through February 2016. (b) Contact map of microtubule-associated CAP-Gly illustrating all intra- and inter-residue correlations observed from MAS NMR distance restraints used in the structure calculation (Yan et al., 2015a). (b) Adapted with permission from Yan et al., Proc. Nat. Acad. Sci., 2015, 112 (47), 14611–14616. Copyright 2015 National Academy of Sciences.
Fig. 5
Fig. 5
Structure determination of CXCR1 with dipolar couplings as a structural restraint (Park et al., 2012). (a) CO-Cα correlations from NCACX 3D. (b) Strip plots from SLF measurements, indicating the 1H-15N dipolar coupling strength at a given 13Cα chemical shift, corresponding to the residues indicated. (c) 1H-15N dipolar coupling vs residue number. The ‘wave’ pattern (cyan) is a feature of the transmembrane helices. (d) 10 lowest energy structures of CXCR1. Adapted with permission from Park et al., Nature, 2012, 491, 779–784. Copyright 2012 Nature Publishing Group.
Fig. 6
Fig. 6
Combined use of MAS NMR and cryo-EM to determine the structure of the mouse ASC inflammasome (ASC-PYD) (Sborgi et al., 2015). (a) Electron density map determined by cryo-EM. (b) Strips from 13C-13C-13C 3D. (c) Strips from 13C-13C 2D (top) and CHHC 2D (bottom). (d) Secondary chemical shift plot, indicating the predominantly α-helical content of the protein. (e) Flow chart illustrating the protocol for structure refinement. MAS NMR data contributions are shaded yellow and cryo-EM data are shaded green. (f) Cryo-EM density reconstruction superimposed with a monomer of ASC-PYD. (g and h) Superposition of the 20 lowest energy structures of the filament and monomer. Positions of 10 arbitrary residues as determined by structure refinement are shown in orange. (i) Inter-residue interactions in a monomer of ASC-PYD. Orange lines indicate ambiguous distance restraints between Tyr60, Leu68 (orange) and neighboring residues (gray). Reprinted with permission from Sborgi et al., Proc. Nat. Acad. Sci., 2015, 112 (43), 13237–13242. Copyright 2015 National Academy of Sciences.
Fig. 7
Fig. 7
RN-symmetry based sequences for the measurement of dipolar and chemical shift anisotropy lineshapes. (Hou et al., 2014) (a) conventional RN-based DIPSHIFT, (b) 1H CSA recoupling with or without heteronuclear decoupling, (c) PARS, (d) constant time PARS, (e) 3D PARS for dipolar lineshapes measurements. Reproduced with permission from Hou et al., J. Chem. Phys., 2014, 141 (10). Copyright 2014 AIP Publishing.
Fig. 8
Fig. 8
Methods for millisecond to microsecond timescale dynamics measurements. (a) Backbone amide 15N R relaxation dispersion curves for select GB1 residues (Lewandowski et al., 2011b). (b) Residue-specific 15N R1 and R relaxation rates for GB1. (c) Dipolar CODEX pulse sequence (Krushelnitsky et al., 2009). (d) Residue-specific intensity ratios for dipolar CODEX measurements of SH3. (e) Peak intensity ratio as a function of CODEX mixing time for select SH3 residues. Residues that lack slow dynamics (e.g. Gln 50) exhibit no mixing time dependence. (a,b) Reprinted with permission from Lewandowski et al., J. Am. Chem. Soc., 2011, 133 (42), 16762–16765. Copyright 2011 American Chemical Society. (c-e) Reprinted with permission from Krushelnitsky et al., J. Am. Chem. Soc., 2009, 131 (34), 12097–12099. Copyright 2009 American Chemical Society.
Fig. 9
Fig. 9
Two methods for the study of intermolecular interactions in protein assemblies. (Panel 1) MELODI-HETCOR (a) MELODI-HETCOR pulse sequence. (b–d) LG-HETCOR 1H-15N spectra of an Arg-rich membrane embedded peptide (b) no REDOR dephasing, (c) only 1H-13C REDOR dephasing, (d) both 1H-13C and 1H-15N REDOR dephasing. (Li et al., 2010) (Panel 2) REDOR-PAINCP (e) pulse sequence for REDOR-PAINCP experiment. (f) 2D 15N-13C REDOR-PAINCP spectra of thioredoxin. (g) Observed intermolecular correlations plotted onto the structure of thioredoxin. (Yang et al., 2008) (ad) Adapted with permission fron Li et al., J. Phys. Chem. B, 2010, 114 (11), 4063–4069. Copyright 2010 American Chemical Society. (eg) Adapted with permission from Yang et al., J. Am. Chem. Soc., 2008, 130 (17), 5798–5807. Copyright 2008 American Chemical Society.
Fig. 10
Fig. 10
Application of REDOR distance measurements to a selectively labeled amyloid protofilament revealed anti-parallel stacking of the β-sheets. (a) 2D 15N-13C ZF-TEDOR spectrum, (b) 2D 13C-13C PDSD spectrum, (c) cross section of anti-parallel β-sheets, red and blue lines indicate intermolecular distances measured, (d) REDOR dephasing curve of residues Y105 and S115, indicating head-to-tail arrangement of the protofilament. (Fitzpatrick et al., 2013) Reproduced with permission from Fitzpatrick et al., Proc. Nat. Acad. Sci., 2013, 110 (14), 5468–5473. Copyright 2013 National Academy of Sciences.
Fig. 11
Fig. 11
Transmission electron microscopy of cytoskeleton-associated proteins for MAS NMR experiments. (a–b) 2H,13C,15N CAP-Gly/microtubule complex before and after magic angle spinning. (Yan et al., 2015a) Adapted with permission from Yan et al., Proc. Nat. Acad. Sci., 2015, 112 (47), 14611–14616. Copyright 2015 National Academy of Sciences. (c) 13C, 15N BacA. Filament bundles are indicated by arrows, sheets are indicated by asterisks, and single filaments are indicated by arrowheads. (Vasa et al., 2015) Adapted with permission from Vasa et al., Proc. Nat. Acad. Sci., 2015, 112 (2), E127–E136. Copyright 2015 National Academy of Sciences.
Fig. 12
Fig. 12
(a) Structure of CAP-Gly bound to polymerized microtubules (purple, 2MPX) and free CAP-Gly (orange, 2M02), both determined with MAS NMR, and CAP-Gly bound to EB1 (green, 2HKQ). (b) Expansion of loop regions of CAP-Gly in the three systems, indicating the differences in loop position and sidechain orientation for CAP-Gly in its three different states. (Yan et al., 2015a) (c) Chemical shift perturbations for several residues in CAP-Gly indicating multiple conformers of free CAP-Gly (black) that collapse to a single conformer in complex with EB1. (Yan et al., 2013a) (a) and (b) Adapted with permission from Yan et al., Proc. Nat. Acad. Sci., 2015, 112 (47), 14611–14616. Copyright 2015 National Academy of Sciences. (c) Adapted with permission from Yan et al., J. Mol. Biol., 2013, 425 (22), 4249–4266. Copyright 2013 Elsevier.
Fig. 13
Fig. 13
(a) Intermolecular interfaces of CAP-Gly with MT and EB1 determined with dREDOR (left, green), and observed chemical shift perturbations (right, purple/orange). For chemical shift perturbations, purple residues indicate large shifts >1 ppm, orange indicates shifts between 0.5 and 1 ppm. (b) dREDOR-HETCOR and dREDOR-CORD spectra of U-13C,15N CAP-Gly bound to MT and (c) in complex with EB1. (Yan et al., 2015a) Reproduced with permission from Yan et al., Proc. Nat. Acad. Sci., 2015, 112 (47), 14611–14616. Copyright 2015 National Academy of Sciences.
Fig. 14
Fig. 14
15N-13C SPECIFIC CP NCA 1D spectra indicating temperature dependence of global conformational dynamics of (a) free CAP-Gly, (b) CAP-Gly/EB1 complex, (c) CAP-Gly bound to microtubules. (d) Dipolar order parameters of free CAP-Gly at −2°C (purple), and microtubule-bound CAP-Gly at −2°C (green) and −19°C (black). The micro-to-nanosecond timescale dynamics of MT-bound CAP-Gly are enhanced at −2° in comparison to the free protein. (Yan et al., 2015b) Adapted with permission from Yan et al., J. Biol. Chem., 2015, 290 (3), 1607–1622. Copyright 2015 The American Society for Biochemistry and Molecular Biology.
Fig. 15
Fig. 15
(a) 13C-13C proton-driven spin diffusion (PDSD) correlation spectrum of U-13C, 15N BacA. (b) Secondary structure of the core domain DUF583 of BacA determined from secondary chemical shift analysis. (Vasa et al., 2015) Adapted with permission from Vasa et al., Proc. Nat. Acad. Sci., 2015, 112 (2), E127–E136. Copyright 2015 National Academy of Sciences.
Fig. 16
Fig. 16
Top view (a) and side view (b) of BacA structure determined by MAS NMR. (c) Schematic representation of the 6 windings. Colors are as follows: white-hydrophobic residues, red-acidic residues, blue-basic residues, green-other residues. Mutations of asterisked residues in winding 6 affect in vivo assembly. (Shi et al., 2015) Reprinted with permission from Shi et al., Sci. Adv. 2015, 1 (11). Copyright 2015 American Association for the Advancement of Science.
Fig. 17
Fig. 17
Transmission electron microscopy images of viral assemblies and viruses for MAS NMR studies: (a) tubular assemblies of HIV-1 capsid (CA), HXB2 strain, (b) CA in complex with CypA (Lu et al., 2015a), (c) tubular assemblies of CA-SP1 maturation intermediate, NL4-3 strain, A92E mutant. (Han et al., 2013), (d) T7 bacteriophage (Abramov & Goldbourt, 2014). (a, b) Adapted with permission from Lu et al., Proc. Nat. Acad. Sci., 2015, 112 (47), 14617-14622. Copyright 2015 National Academy of Sciences. (c) Reprinted with permission from Han et al., J. Am. Chem. Soc., 2013, 135 (47), 17793–17803. Copyright 2013 American Chemical Society. (d) Adapted with permission from Abramov et al., J. Biomol. NMR, 2014, 59 (4), 219–230. Copyright 2014 Springer.
Fig. 18
Fig. 18
(a) Late stages of HIV-1 viral life cycle from assembly at the host cell membrane to budding and virion maturation. (Freed, 2015) (b) All-atom MD derived model of the HIV-1 capsid based on cryo-ET and solution NMR, with a hexamer of hexamers subunit shown in the expansion (Lu et al., 2015a). (c) Hexmer of hexamers of HIV-1 capsid assembly. The interhexameric trimer interface is circled. (d,e) Helix 10 trimer interface and helix 9 dimer interface respectively. Blue: hexamer of hexamers, orange: pentamer of hexamers (Zhao et al., 2013). (f) CA monomer. Residues for which chemical shift perturbations are observed upon binding of CypA are highlighted orange. (g) 15N-13C and 13C-13C correlation spectra of free CA tubular assemblies (black) and CA tubular assemblies in complex with CypA (Lu et al., 2015a) (a) Adapted with permission from Freed, Nat. Rev. Microbiol., 2015, 13. Copyright 2015 Macmillan Publishers. (b,f,g) Adapted with permission from Lu et al., Proc. Nat. Acad. Sci., 2015, 112 (47), 14617–14622. Copyright 2015 National Academy of Sciences. (c–e) Adapted with permission from Zhao et al., Nature, 2013, 497, 643–646. Copyright 2013 Nature Publishing Group.
Fig. 19
Fig. 19
(a) 15N-15N BARE curves for selected CA residues. Circles indicate experimental curves for CA tubular assemblies. Simulated curves correspond to the following structures: (− −) 2LF4, (−) 3MGE, (−) 2KOD. (b) Initial (red) and final (blue) structure refinement against 2LF4, indicating the change in the conformation of the 310 helix. (c and d) Initial (orange) and final (blue) structure refinement against 3MGE, indicating the change in conformation of loop 3/4 and loop 10/11 respectively. (Bayro et al., 2014) Adapted with permission from Bayro et al., J. Mol. Biol., 2014, 426 (5), 1109–1127. Copyright 2014 Elsevier.
Fig. 20
Fig. 20
(a) 1H-15N dipolar order parameters and (b) lineshapes for residues in the CypA loop in WT CA (HXB2), cyclophilinA-bound CA (HXB2), WT CA (NL4-3), CA A92E (NL4-3), and CA G94D (NL4-3), listed from top to bottom. (c) Peak intensities observed in an NCACX correlation spectrum for each of the 5 constructs. (d) Dipolar order parameters (top) and NCA peak intensities (bottom) mapped onto the structure of CA. (Lu et al., 2015a) Adapted with permission from Lu et al., Proc. Nat. Acad. Sci., 2015, 112 (47), 14617–14622. Copyright 2015 National Academy of Sciences.
Fig. 21
Fig. 21
(A) NCA spectrum of CA tubular assemblies, with sufficiently resolved peaks labeled. (B) 1H T2 filtered NCA spectrum with 168 μs spin echo. Label colors correspond to peak intensity from 1H T2 filtered NCA experiment: 15–30%, dark blue; 31–40%, light blue; 41–55%, green; 56–85%, magneta. (Bayro et al., 2014) Reprinted with permission from Bayro et al., J. Mol. Biol., 2014, 426 (5), 1109–1127. Copyright 2014 Elsevier.
Fig. 22
Fig. 22
(Panel 1) Sequence of Gag polyprotein cleavage during maturation. (Panel 2) (ad) Direct-DARR, (ej) INADEQUATE, and (k) CP-DARR spectra of CA (orange) and CA-SP1 (black) NL4-3 strain assembled into tubes. Selected regions show the presence of SP1 peaks not observed in the CA spectra. (Han et al., 2013) Reprinted with permission from Han et al., J. Am. Chem. Soc., 2013, 135 (47), 17793–17803. Copyright 2013 American Chemical Society.
Fig. 23
Fig. 23
(a) 1H-13C MELODI-HETCOR of Pf1. (b) 13C-13C slice of a 1H-13C-13C 3D spectrum at the water frequency. (c) Pf1 subunit; residues interacting with water are shaded purple. Hydrated residues are concentrated at the N- and C-termini. (Sergeyev et al., 2014) Reprinted with permission from Sergeyev et al., J. Chem. Phys., 2014, 141 (22). Copyright 2014 AIP Publishing.
Fig. 24
Fig. 24
(a) 13C-13C CORD spectrum of [1,3-13C]glycerol, U-15N M13 bacteriophage with 500 ms mixing time. Intra-residue contacts are labeled in black. Inter-residue contacts within the same subunit are labeled in green. Inter-residue contacts between residues in different subunits are labeled in blue. Select inter-subunit correlations are shown on the structure. (b) Sideview of the NMR-ROSETTA model of M13 containing 35 subunits, the minimum number of subunits required to contain all unique interactions. (c) Hydrophobic pockets formed by several subunits. (Morag et al., 2015) Adapted with permission from Morag et al., Proc. Nat. Acad. Sci., 2015, 112 (4), 971–976. Copyright 2015 National Academy of Sciences.
Fig. 25
Fig. 25
Spin system assignments of DNA in fd bacteriophage. Nucleotide walks are shown for (a) dG, blue, and dC, red and (b) dA, green, and dT, pink. (c) Assignment grid indicating all observed DNA correlations. (d) Expansion of 13C-13C CORD spectrum. Capsid-to-sugar correlations are labeled green, while intra-nucleotide resonances are labeled black. (e) Model of protein-DNA interactions in fd. (Morag et al., 2014) Adapted with permission from Morag et al., J. Am. Chem. Soc., 2014, 136 (6), 2292–2301. Copyright 2014 American Chemical Society.

References

    1. World Health Organization. HIV/AIDS (Fact sheet No 360)
    1. ABRAMOV G, GOLDBOURT A. Nucleotide-type chemical shift assignment of the encapsulated 40 kbp dsDNA in intact bacteriophage T7 by MAS solid-state NMR. Journal of Biomolecular NMR. 2014;59(4):219–230. - PubMed
    1. ABRAMOV G, MORAG O, GOLDBOURT A. Magic-angle spinning NMR of a class I filamentous bacteriophage virus. Journal of Physical Chemistry B. 2011;115(31):9671–9680. - PubMed
    1. ACKERMANN HW. Tailed bacteriophages: The order Caudovirales. Advances in Virus Research. 1999;51:135–201. - PMC - PubMed
    1. ADAMSON CS, SAKALIAN M, SALZWEDEL K, FREED EO. Polymorphisms in Gag spacer peptide 1 confer varying levels of resistance to the HIV-1 maturation inhibitor bevirimat. Retrovirology. 2010;7 - PMC - PubMed

Substances

LinkOut - more resources