Identification of Fhit as a post-transcriptional effector of Thymidine Kinase 1 expression
- PMID: 28093273
- PMCID: PMC5325794
- DOI: 10.1016/j.bbagrm.2017.01.005
Identification of Fhit as a post-transcriptional effector of Thymidine Kinase 1 expression
Abstract
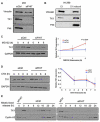
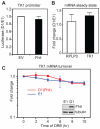
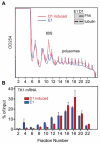
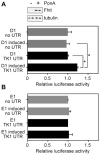
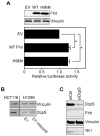
FHIT is a genome caretaker gene that is silenced in >50% of cancers. Loss of Fhit protein expression promotes accumulation of DNA damage, affects apoptosis and epithelial-mesenchymal transition, though molecular mechanisms underlying these alterations have not been fully elucidated. Initiation of genome instability directly follows Fhit loss and the associated reduced Thymidine Kinase 1 (TK1) protein expression. The effects on TK1 of Fhit knockdown and Fhit induction in the current study confirmed the role of Fhit in regulating TK1 expression. Changes in Fhit expression did not impact TK1 protein turnover or transcription from the TK1 promoter, nor steady-state levels of TK1 mRNA or turnover. Polysome profile analysis showed that up-regulated Fhit expression resulted in decreased TK1 RNA in non-translating messenger ribonucleoproteins and increased ribosome density on TK1 mRNA. Fhit does not bind RNA but its expression increased luciferase expression from a transgene bearing the TK1 5'-UTR. Fhit has been reported to act as a scavenger decapping enzyme, and a similar result with a mutant (H96) that binds but does not cleave nucleoside 5',5'-triphosphates suggests the impact on TK1 translation is due to its ability to modulate the intracellular level of cap-like molecules. Consistent with this, cells expressing Fhit mutants with reduced activity toward cap-like dinucleotides exhibit DNA damage resulting from TK1 deficiency, whereas cells expressing wild-type Fhit or the H96N mutant do not. The results have implications for the mechanism by which Fhit regulates TK1 mRNA, and more broadly, for its modulation of multiple functions as tumor suppressor/genome caretaker.
Keywords: 5′-UTR; Fhit; Thymidine kinase 1; Translational control.
Copyright © 2017 Elsevier B.V. All rights reserved.
Figures

Similar articles
-
Impact of FHIT loss on the translation of cancer-associated mRNAs.Mol Cancer. 2017 Dec 28;16(1):179. doi: 10.1186/s12943-017-0749-x. Mol Cancer. 2017. PMID: 29282095 Free PMC article.
-
FHIT loss-induced DNA damage creates optimal APOBEC substrates: Insights into APOBEC-mediated mutagenesis.Oncotarget. 2015 Feb 20;6(5):3409-19. doi: 10.18632/oncotarget.2636. Oncotarget. 2015. PMID: 25401976 Free PMC article.
-
Fhit loss-associated initiation and progression of neoplasia in vitro.Cancer Sci. 2016 Nov;107(11):1590-1598. doi: 10.1111/cas.13032. Epub 2016 Oct 3. Cancer Sci. 2016. PMID: 27513973 Free PMC article.
-
Mechanisms shaping the mutational landscape of the FRA3B/FHIT-deficient cancer genome.Genes Chromosomes Cancer. 2019 May;58(5):317-323. doi: 10.1002/gcc.22684. Epub 2018 Nov 18. Genes Chromosomes Cancer. 2019. PMID: 30242938 Review.
-
The FHIT gene product: tumor suppressor and genome "caretaker".Cell Mol Life Sci. 2014 Dec;71(23):4577-87. doi: 10.1007/s00018-014-1722-0. Epub 2014 Oct 5. Cell Mol Life Sci. 2014. PMID: 25283145 Free PMC article. Review.
Cited by
-
Fhit and Wwox loss-associated genome instability: A genome caretaker one-two punch.Adv Biol Regul. 2017 Jan;63:167-176. doi: 10.1016/j.jbior.2016.09.008. Epub 2016 Sep 26. Adv Biol Regul. 2017. PMID: 27773744 Free PMC article.
-
Inhibition of GSK3β is synthetic lethal with FHIT loss in lung cancer by blocking homologous recombination repair.Exp Mol Med. 2025 Feb;57(1):167-183. doi: 10.1038/s12276-024-01374-0. Epub 2025 Jan 6. Exp Mol Med. 2025. PMID: 39762409 Free PMC article.
-
Impact of FHIT loss on the translation of cancer-associated mRNAs.Mol Cancer. 2017 Dec 28;16(1):179. doi: 10.1186/s12943-017-0749-x. Mol Cancer. 2017. PMID: 29282095 Free PMC article.
-
The fission yeast FHIT homolog affects checkpoint control of proliferation and is regulated by mitochondrial electron transport.Cell Biol Int. 2020 Feb;44(2):412-423. doi: 10.1002/cbin.11241. Epub 2019 Oct 2. Cell Biol Int. 2020. PMID: 31538680 Free PMC article.
-
Fhit-Fdxr interaction in the mitochondria: modulation of reactive oxygen species generation and apoptosis in cancer cells.Cell Death Dis. 2019 Feb 15;10(3):147. doi: 10.1038/s41419-019-1414-7. Cell Death Dis. 2019. PMID: 30770797 Free PMC article.
References
-
- Ohta M, Inoue H, Cotticelli MG, Kastury K, Baffa R, Palazzo J, Siprashvili Z, Mori M, McCue P, Druck T, Croce CM, Huebner K. Cell. 1996;84:587–597. 10.1016/S0092-8674(00)81034-X. - PubMed
-
- Barnes LD, Garrison PN, Siprashvili Z, Guranowski A, Robinson AK, Ingram SW, Croce CM, Ohta M, Huebner K. Biochemistry. 1996;35:11529–11535. 10.1021/bi961415t. - PubMed
-
- Murphy GA, Halliday D, McLennan AG. Cancer Res. 2000;60:2342–2344. - PubMed
Publication types
MeSH terms
Substances
Grants and funding
LinkOut - more resources
Full Text Sources
Other Literature Sources
Miscellaneous

