. 2017 Feb 15;37(7):1950-1964.
doi: 10.1523/JNEUROSCI.3196-16.2017. Epub 2017 Jan 16.

Differential Regulation of NMDA Receptor-Mediated Transmission by SK Channels Underlies Dorsal-Ventral Differences in Dynamics of Schaffer Collateral Synaptic Function

Affiliations

Differential Regulation of NMDA Receptor-Mediated Transmission by SK Channels Underlies Dorsal-Ventral Differences in Dynamics of Schaffer Collateral Synaptic Function

Walter E Babiec et al. J Neurosci. .

Abstract

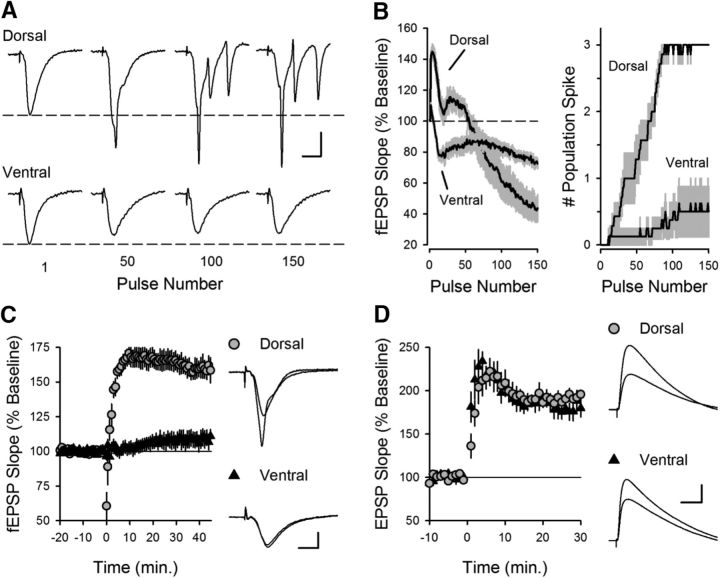
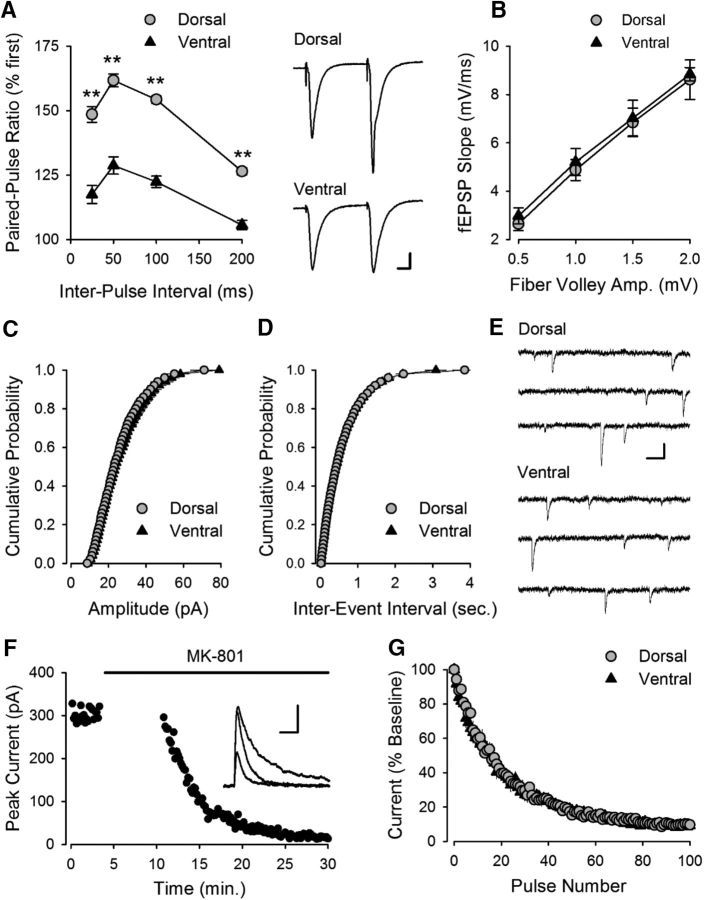
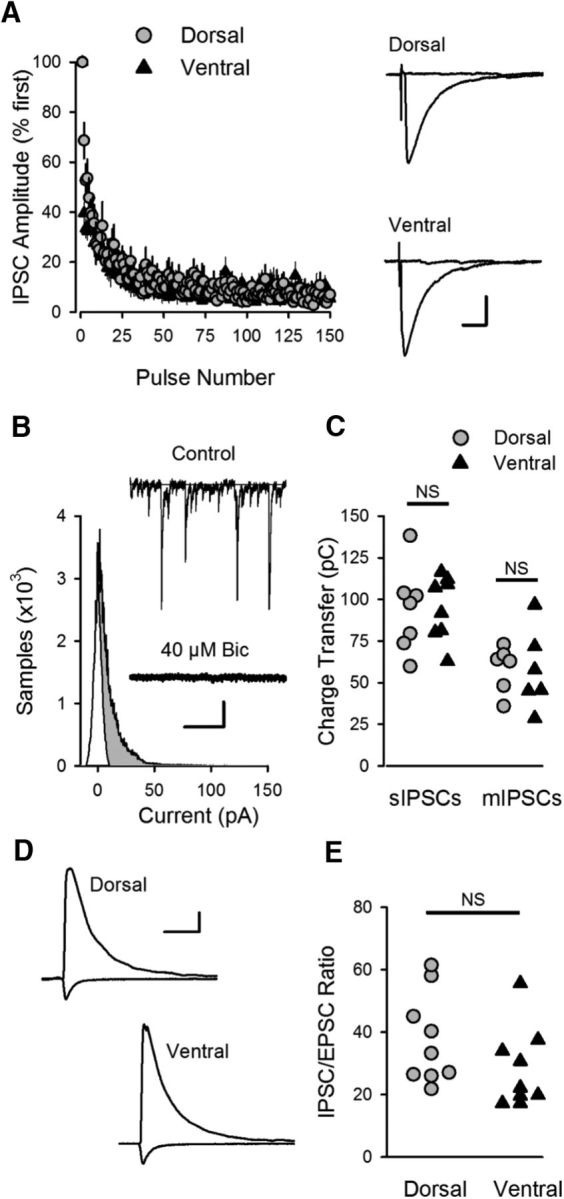
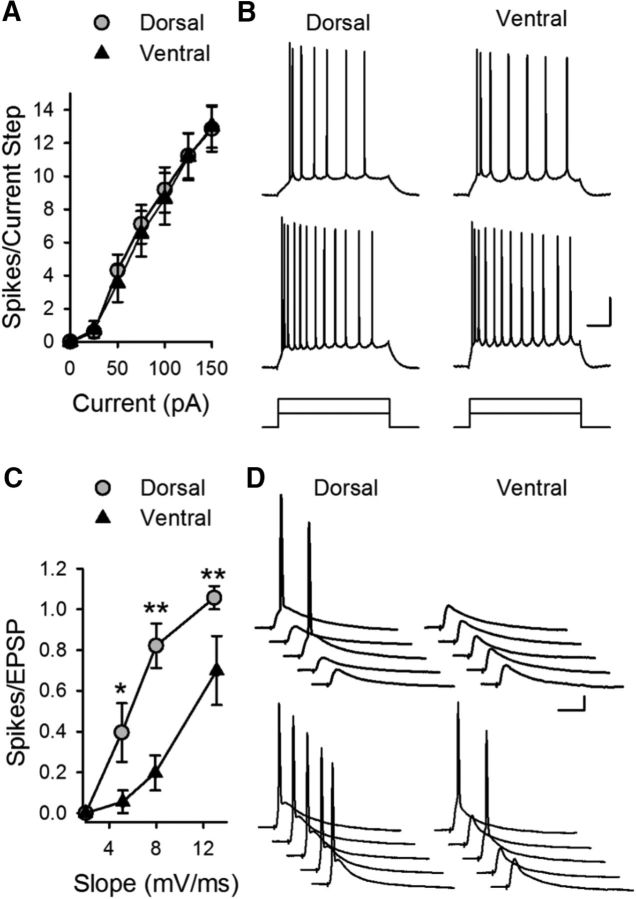
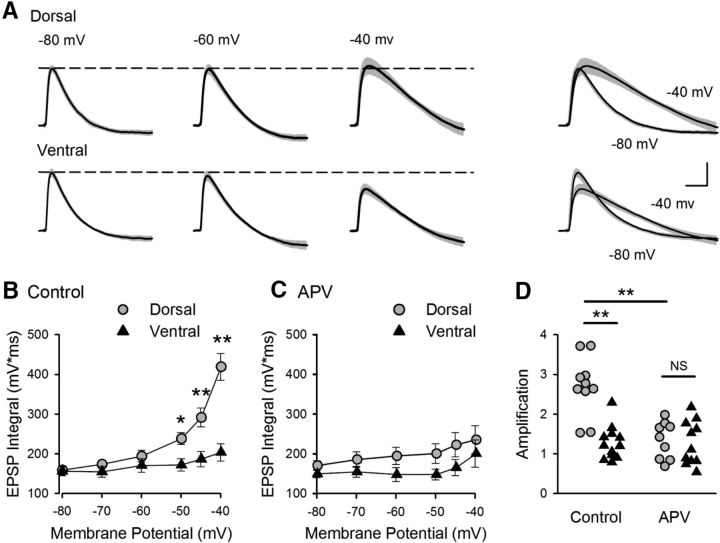
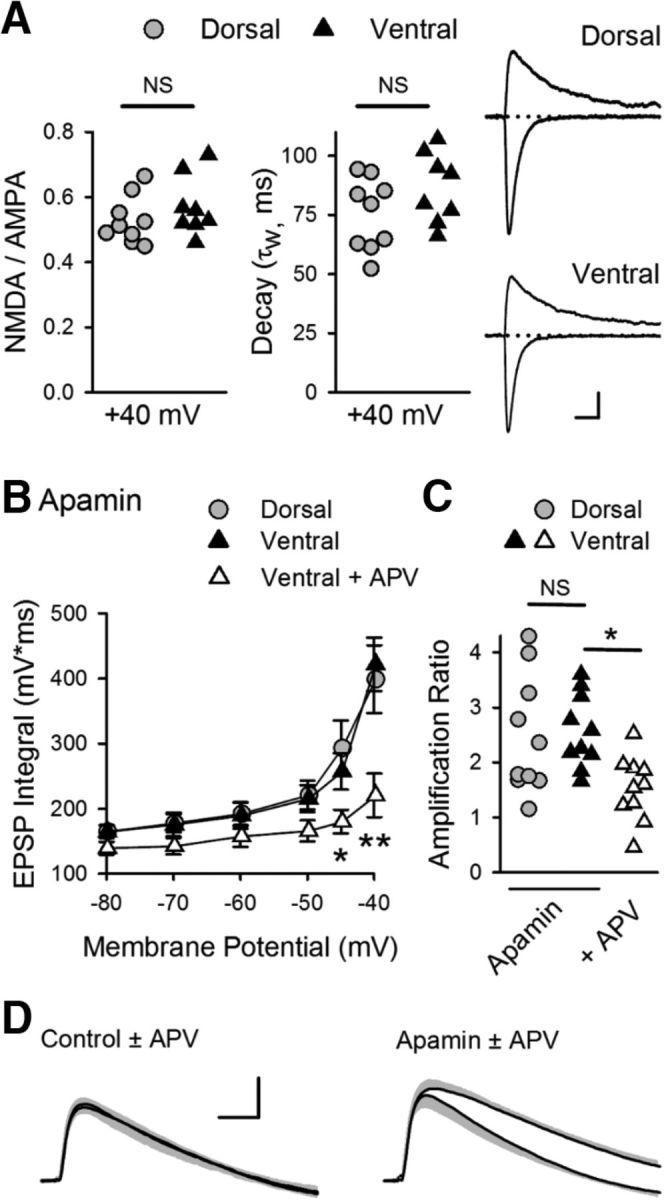
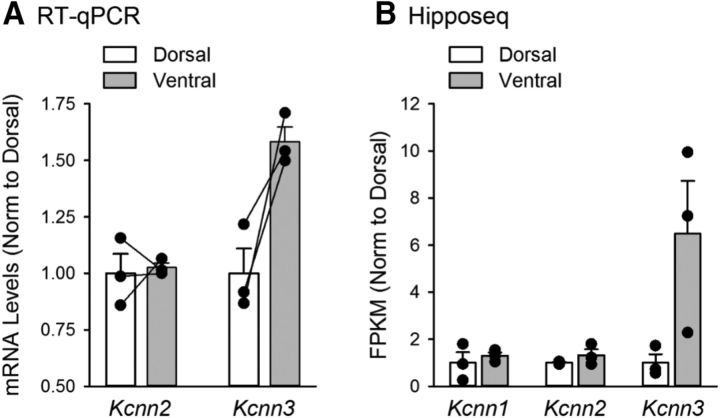
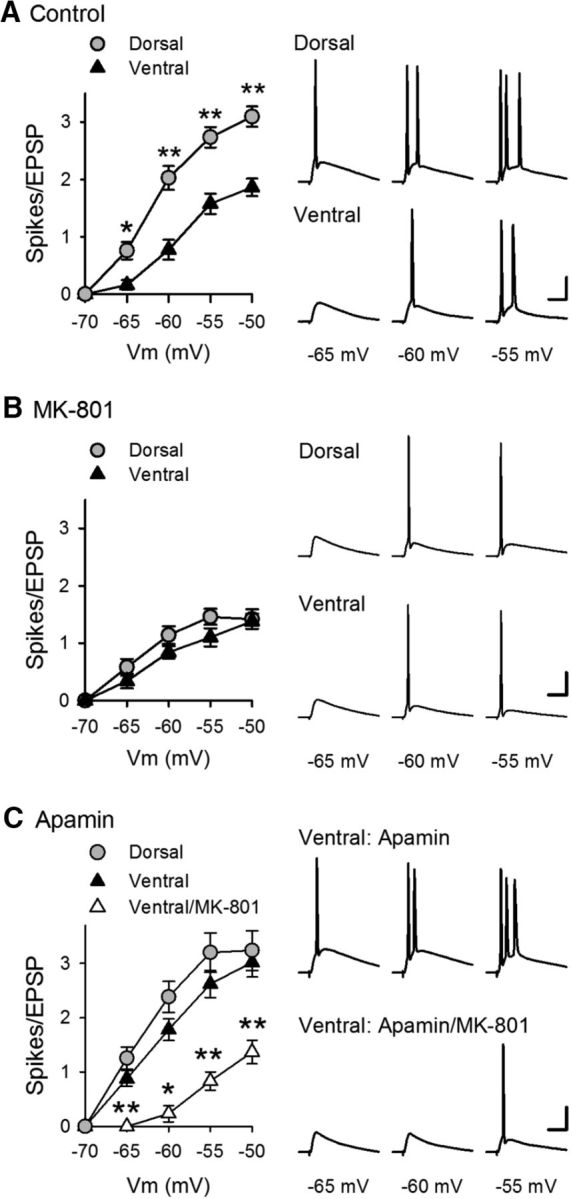
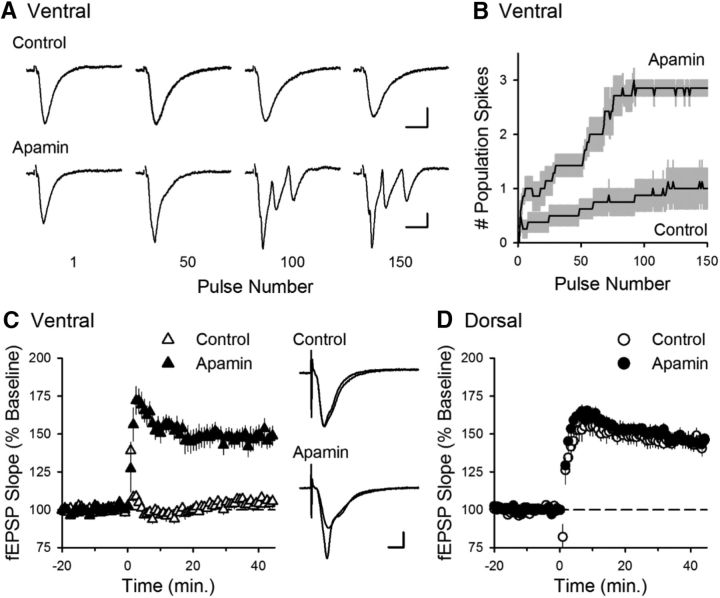
Behavioral, physiological, and anatomical evidence indicates that the dorsal and ventral zones of the hippocampus have distinct roles in cognition. How the unique functions of these zones might depend on differences in synaptic and neuronal function arising from the strikingly different gene expression profiles exhibited by dorsal and ventral CA1 pyramidal cells is unclear. To begin to address this question, we investigated the mechanisms underlying differences in synaptic transmission and plasticity at dorsal and ventral Schaffer collateral (SC) synapses in the mouse hippocampus. We find that, although basal synaptic transmission is similar, SC synapses in the dorsal and ventral hippocampus exhibit markedly different responses to θ frequency patterns of stimulation. In contrast to dorsal hippocampus, θ frequency stimulation fails to elicit postsynaptic complex-spike bursting and does not induce LTP at ventral SC synapses. Moreover, EPSP-spike coupling, a process that strongly influences information transfer at synapses, is weaker in ventral pyramidal cells. Our results indicate that all these differences in postsynaptic function are due to an enhanced activation of SK-type K+ channels that suppresses NMDAR-dependent EPSP amplification at ventral SC synapses. Consistent with this, mRNA levels for the SK3 subunit of SK channels are significantly higher in ventral CA1 pyramidal cells. Together, our findings indicate that a dorsal-ventral difference in SK channel regulation of NMDAR activation has a profound effect on the transmission, processing, and storage of information at SC synapses and thus likely contributes to the distinct roles of the dorsal and ventral hippocampus in different behaviors.SIGNIFICANCE STATEMENT Differences in short- and long-term plasticity at Schaffer collateral (SC) synapses in the dorsal and ventral hippocampus likely contribute importantly to the distinct roles of these regions in cognition and behavior. Although dorsal and ventral CA1 pyramidal cells exhibit markedly different gene expression profiles, how these differences influence plasticity at SC synapses is unclear. Here we report that increased mRNA levels for the SK3 subunit of SK-type K+ channels in ventral pyramidal cells is associated with an enhanced activation of SK channels that strongly suppresses NMDAR activation at ventral SC synapses. This leads to striking differences in multiple aspects of synaptic transmission at dorsal and ventral SC synapses and underlies the reduced ability of ventral SC synapses to undergo LTP.

Keywords: EPSP amplification; EPSP-spike coupling; NMDA receptor; SK channel; complex-spike bursting; hippocampal LTP.


Figures

Figure 1.
Figure 1.
θ frequency modulation of transmission at SC synapses in the dorsal and ventral hippocampal CA1 regions. A, Examples of fEPSPs evoked by TPS in dorsal (top) and ventral hippocampal slices (bottom). Note the prominent, multiple population spikes elicited during TPS in dorsal hippocampal slices. Calibration: 2 mV, 5 ms. B, fEPSP slopes (left) and number of population spikes (right) elicited during TPS (n = 6 dorsal and n = 7 ventral slices). Shading represents SEM. C, TPS fails to induce LTP at SC fiber synapses in ventral hippocampus. At 45 min after TPS (delivered at time = 0), fEPSPs were potentiated to 160 ± 8% of baseline in dorsal slices (n = 6) and were 109 ± 6% of baseline in ventral slices (n = 7, p = 1.8 × 10⁻⁴, Student's t test: t(11) = 5.516). Traces at right represent superimposed fEPSPs recorded during baseline and 45 min after TPS. Calibration: 2 mV, 5 ms. D, Pairing presynaptic fiber stimulation (100 pulses at 2 Hz) with postsynatpic depolarization (at time = 0) induces similar amounts of LTP in dorsal and ventral pyramidal cells. At 30 min after pairing, EPSPs were 193 ± 4.6% of baseline in dorsal cells (n = 7) and 180 ± 10% of baseline in ventral cells (n = 6, p = 0.22, Student's t test: t(11) = 1.291). Traces represent superimposed EPSPs recorded during baseline and 30 min after LTP induction. Calibration: 5 mV, 20 ms.
Figure 2.
Figure 2.
Paired-pulse facilitation, basal synaptic strength, and transmitter release probability at excitatory synapses in CA1 region of dorsal and ventral hippocampus. A, Paired-pulse facilitation is significantly lower at ventral SC fiber synapses. **p < 0.001 (two-way ANOVA with Student-Newman-Keuls post hoc multiple-comparisons test). p = 1.6 × 10⁻¹⁴, F(1,57) = 104.7 (n = 12 dorsal and n = 9 ventral slices). Right, Traces represent fEPSPs evoked by stimulation pulses delivered with a 50 ms interpulse interval. Calibration: 1 mV, 10 ms. B, Comparison of presynaptic fiber volley amplitudes and postsynaptic fEPSP slopes for responses elicited by different intensities of SC fiber stimulation in dorsal (n = 17) and ventral (n = 18) hippocampal slices (p = 0.982, Student's t test: t(33) = 0.022). C, D, Amplitude (C) and frequency (D) of mEPSCs in dorsal and ventral CA1 pyramidal cells (n = 1843 events from 7 dorsal cells and 1815 events from 7 ventral cells). There was no significant difference in either the mean amplitude (dorsal: 23.0 ± 1.6 pA; ventral: 23.7 ± 1.0 pA, p = 0.71, Student's t test: t(11) = 0.378) or frequency of mEPSCs (dorsal: 1.7 ± 0.1 Hz; ventral: 1.7 ± 0.1 Hz, p = 0.94, Student's t test: t(11) = 0.076). E, Examples of mEPSCs recorded from dorsal and ventral pyramidal cells. Calibration: 20 pA, 100 ms. F, Example of the use-dependent block of NMDAR-mediated EPSCs in the presence of 40 μm MK-801 in a dorsal CA1 pyramidal cell. Synaptic stimulation was omitted during the first 10 min of MK-801 application. Inset, NMDAR-mediated currents recorded before, immediately after resuming synaptic stimulation in presence of MK-801, and after 20 stimulation pulses in presence of MK-801. Calibration: 100 pA, 50 ms. G, The activity-dependent inhibition of NMDAR-mediated EPSCs by MK-801 is not significantly different in dorsal (n = 6) and ventral (n = 7) pyramidal cells. Weighted decay time constants for the MK-801 inhibition of NMDAR EPSCs were 209 ± 10 s and 214 ± 33 s in dorsal and ventral cells, respectively (p = 0.88, Student's t test: t(11) = 0.155).
Figure 3.
Figure 3.
Facilitation, CS bursting, and LTP induction are reduced in dorsal hippocampal slices from Syt7−/− mutant mice. A, Paired-pulse facilitation is significantly reduced in dorsal hippocampal slices from Syt7−/− mice. **p < 0.001 (two-way ANOVA with Student-Newman-Keuls post hoc multiple-comparisons test). p = 3.7 × 10⁻²⁴, F(1,36) = 609.2 (n = 18 slices from 6 wild-type and n = 15 slices from 5 Syt7−/− mutant mice). B, C, fEPSP slopes (B) and number of population spikes (C) elicited during TPS in slices from wild-type (n = 18 slices from 6 mice) and Syt7−/− mutants (n = 15 slices from 5 mice). Shading represents SEM. The latency to first burst (first stimulation pulse to elicit 2 or more population spikes) was 28 ± 3.1 pulses in slices from wild-type mice and 55 ± 6.7 pluses in slices from Syt7−/− mice (p = 4.1 × 10⁻⁴, Student's t test: t(9) = 5.445). D, Examples of fEPSPs elicited during TPS in slices from wild-type (top) and Syt7−/− mutant mice. Calibration: 2 mV, 5 ms. E, TPS stimulation-induced LTP is reduced in Syt7−/− mutant mice (p = 0.014, Student's t test: t(9) = 3.045). At 45 min after TPS (delivered at time = 0), fEPSPs were potentiated to 148 ± 4% of baseline in slices from wild-type littermates (p = 8.38 × 10⁻⁷, paired t test: t(17) = 7.521) and were 121 ± 8% of baseline in slices from Syt7−/− mutants (p = 1.86 × 10⁻³, paired t test: t(14) = 3.824). Results from the same experiments shown in B, C.
Figure 4.
Figure 4.
Increasing the strength of presynaptic fiber stimulation does not enable EPSP-evoked CS bursting and LTP induction in ventral hippocampus. A, B, fEPSP slopes (A) and number of population spikes (B) elicited during TPS in ventral slices in experiments where the strength of presynaptic fiber stimulation during the first 50 pulses of TPS was increased to mimic (1.1× basal stimulation pulse duration, n = 6) or exceed (1.2× basal stimulation pulse duration, n = 6) the facilitation that occurs during the first 50 pulses of TPS in dorsal hippocampal slices. C, Increasing the intensity of presynaptic fiber stimulation during TPS (delivered at time = 0) fails to enable LTP induction in ventral hippocampal slices. At 45 min after TPS, fEPSPs were 112.7 ± 5.9% of baseline in experiments where stimulation strength was increased 1.1-fold at start of TPS and were 110 ± 2.5% of baseline in experiments where the stimulation strength was increased to 1.2-fold (p = 0.928, one-way ANOVA: F(2,15) = 0.075). D, E, fEPSP slopes (D) and number of population spikes (E) elicited by TPS in interleaved control experiments where the strength of presynaptic fiber stimulation was held constant throughout the experiment (n = 8 dorsal and n = 6 ventral slices). F, TPS-induced LTP in interleaved control experiments. At 45 min after TPS, fEPSPs were potentiated to 161 ± 5.7% of baseline in dorsal slices and were 111 ± 6% of baseline in ventral slices (p = 6.6 × 10⁻⁵, Student's t test: t(12) = 5.962).
Figure 5.
Figure 5.
Inhibitory synaptic transmission in CA1 region of dorsal and ventral hippocampus. A, Activity-dependent depression of IPSCs during TPS is similar in dorsal (n = 8) and ventral (n = 9) CA1 pyramidal cells. Traces represent superimposed IPSCs evoked by the first and last pulse of TPS in dorsal and ventral CA1 pyramidal cells. Calibration: 15 ms, 100 pA. B, All points histogram for spontaneous IPSCs in the presence and absence of the GABAA receptor blocker bicuculline (40 μm). Shaded region represents IPSC charge transfer. Traces represent spontaneous IPSCs (sIPSCs) recorded from a dorsal CA1 pyramidal cell before (control) and after application of bicuculline. Calibration: 0.5 s, 40 pA. C, Charge transfer for sIPSCs and mIPSCs (mIPSCs were recorded in presence of 1 μm TTX). Charge transfer for sIPSCs was 94.3 ± 8.4 pC in dorsal cells (n = 8) and 95.2 ± 6.8 pC in ventral cells (n = 8 ventral cells, p = 0.937, Student's t test: t(14) = 0.08). Charge transfer for mIPSCs was 58.5 ± 5.6 pC in dorsal cells (n = 6) and 57.6 ± 9.8 pC in ventral cells (n = 6, p = 0.939, Student's t test: t(10) = 0.078). D, Examples of evoked IPSCs (Vm = 15 mV) and EPSCs (Vm = −42 mv) in dorsal and ventral pyramidal cells. Calibration: 40 ms, 250 pA. E, IPSC/EPSC ratios in dorsal (37.7 ± 4.8, n = 9) and ventral pyramidal cells (27.6 ± 3.8, n = 10) were not significantly different (p = 0.117, Student's t test: t(17) = 1.651).
Figure 6.
Figure 6.
Weaker E-S coupling in ventral CA1 pyramidal cells. A, Depolarization induced by somatic current injection elicits similar numbers of APs in dorsal and ventral pyramidal cells (n = 13 dorsal and n = 12 ventral cells, p = 0.694, two-way ANOVA: F(1,138) = 0.155). B, Traces represent examples of APs elicited by 50 and 100 pA current injections in dorsal and ventral cells. Calibration: 20 mV, 100 ms. C, The ability of EPSPs to elicit postsynaptic APs is significantly reduced in ventral pyramidal cells. *p < 0.01 (two-way ANOVA with Student-Newman-Keuls post hoc multiple-comparisons test). **p < 0.001 (two-way ANOVA with Student-Newman-Keuls post hoc multiple-comparisons test). p = 2.3 × 10⁻⁷, F(1,62) = 33.794 (n = 10 dorsal and n = 7 ventral cells). D, Traces represent examples of postsynaptic responses evoked by small (top, EPSP slope ≈ 5 mV/ms) and larger EPSPs (bottom, EPSP slope ≈ 8 mV/ms). Calibration: 10 mV, 20 ms.
Figure 7.
Figure 7.
Dorsal-ventral difference in NMDAR-mediated EPSP amplification at SC synapses. A, Average EPSPs recorded from 10 dorsal and 12 ventral cells at the indicated membrane potentials. Shading represents SEM. Right, Traces represent superimposed EPSPs recorded at −80 and −40 mV. Calibration: 2 mV, 20 ms. B, Increase in EPSP integrals with depolarization (EPSP amplification) is significantly smaller in ventral pyramidal cells. *p < 0.05 (two-way ANOVA with Student-Newman-Keuls post hoc multiple-comparisons test). **p < 0.001 (two-way ANOVA with Student-Newman-Keuls post hoc multiple-comparisons test). p = 6.5 × 10⁻⁸, F(1,120) = 33.23. C, EPSP amplification in the presence of the NMDAR blocker d-APV (50 μm) (n = 9 dorsal and n = 10 ventral cells). D, Amplification determined from the ratio of EPSP integrals at −40 and −80 mV for all cells for results shown in B, C. In control recordings, the amplification in dorsal cells (2.7 ± 0.23) was significantly greater than that seen in ventral pyramidal cells (1.3 ± 0.12). Blocking NMDARs significantly reduced amplification in dorsal cells (1.3 ± 0.16) but had no effect on amplification in ventral pyramidal cells (1.3 ± 0.17). **p < 0.001 (two-way ANOVA with Student-Newman-Keuls post hoc multiple-comparisons test). p = 4.9 × 10⁻⁷, F(3,38) = 16.544.
Figure 8.
Figure 8.
SK channel suppression of NMDAR activation and EPSP amplification at SC synapses in ventral hippocampus. A, Ratio of NMDAR- and AMPAR-mediated components (left) and decay time constants (middle) for EPSCs recorded at Vm = 40 mV in dorsal and ventral pyramidal cells (n = 9 dorsal and n = 8 ventral cells). Ratios were 0.52 ± 0.02 and 0.57 ± 0.03 in dorsal and ventral cells, respectively (p = 0.312, Student's t test: t(15) = 1.046). Decay time constants were 75 ± 5.1 ms in dorsal cells and 86 ± 5.2 ms in ventral cells (p = 0.15, Student's t test: t(15) = 1.517). Right, Traces represent example EPSCs recorded at −80 and 40 mV. Calibration: 75 pA, 20 ms. B, Blocking SK channels with 100 nm apamin enables NMDAR-mediated EPSP amplification in ventral pryamidal cells. *p < 0.05 (two-way ANOVA with Student-Newman-Keuls post hoc multiple-comparisons test). **p < 0.001 (two-way ANOVA with Student-Newman-Keuls post hoc multiple-comparisons test). p = 4.1 × 10⁻⁷, F(2,162) = 16.12 (n = 10 dorsal and n = 10 ventral cells in apamin, n = 10 ventral cells in apamin plus d-APV). C, Amplification for all cells in the presence of apamin or apamin plus d-APV. Amplification in the presence of apamin was 2.5 ± 0.34 and 2.6 ± 0.21 for dorsal and ventral pyramidal cells, respectively, and 1.7 ± 0.17 for ventral cells in the presence of apamin + d-APV. *p < 0.05 (one-way ANOVA with Student-Newman-Keuls post hoc multiple-comparisons test). p = 0.013, F(2,27) = 5.154. D, Traces represent superimposed average EPSPs in ventral pyramidal cells elicited at Vm = −40 mV in the absence and presence of APV in control cells (left, from experiments shown in Fig. 7B, C) and in the presence of apamin (right). Shading represents SEM. Calibration: 2 mV, 20 ms.
Figure 9.
Figure 9.
SK channel subunit expression in dorsal and ventral hippocampus. A, Levels of Kcnn2 (SK2) and Kcnn3 (SK3) mRNA expression in isolated CA1 regions microdissected from dorsal and ventral hippocampal slices. Lines indicate values obtained from tissue samples from the same hippocampus. B, Expression levels for SK channel subunit mRNA in dorsal and ventral CA1 pyramidal cells obtained using Hipposeq (Cembrowski et al., 2016b) analysis of hippocampal RNA-seq database generated by Cembrowski et al. (2016a).
Figure 10.
Figure 10.
Enhancement of EPSP-evoked CS bursting by blockade of SK channels in ventral CA1 pyramidal cells. A, Effect of membrane depolarization on EPSP-evoked AP firing in dorsal (n = 15) and ventral (n = 16) CA1 pyramidal cells. *p < 0.01 (two-way ANOVA with Student-Newman-Keuls post hoc multiple-comparisons test). **p < 0.001 (two-way ANOVA with Student-Newman-Keuls post hoc multiple-comparisons test). p = 1.8 × 10⁻¹⁵, F(1,120) = 83.715. Traces represent postsynaptic responses elicited at the indicated membrane potentials. B, EPSPs fail to elicit bursting when NMDARs are inhibited with intracellular application of 40 μm MK-801 (n = 10 dorsal and n = 10 ventral cells). C, Inhibiting SK channels with 100 nm apamin enables NMDAR-dependent EPSP-evoked bursting in ventral CA1 pyramidal cells (n = 11 dorsal cells and n = 10 ventral cells in the presence of apamin and 6 ventral cells in the presence of apamin with intracellular application of MK-801). *p < 0.05 (two-way ANOVA with Student-Newman-Keuls post hoc multiple-comparisons test). **p < 0.001 (two-way ANOVA with Student-Newman-Keuls post hoc multiple-comparisons test). p = 5.5 × 10⁻¹⁴, F(2,84) = 44.902. Traces represent postsynaptic responses elicited in ventral pyramidal cells in the presence of apamin with and without intracellular MK-801. Calibration: 20 mV, 20 ms.
Figure 11.
Figure 11.
Inhibiting SK channels enables TPS-induced CS bursting and LTP in ventral hippocampal slices. A, Traces represent examples of fEPSPs elicited during TPS in ventral hippocampal slices during control experiments and in the presence of apamin. Calibration: 1 mV, 10 ms. B, Summary of EPSP-evoked bursting during TPS in ventral hippocampal slices in the absence (control, n = 8) and presence of apamin (n = 7). Results are from the same experiments shown in C. C, Apamin enables LTP induction by TPS (delivered at time = 0) in ventral hippocampal slices. At 45 min after TPS, fEPSPs were potentiated to 149 ± 6.2% of baseline in the presence of apamin compared with 105 ± 2.9% of baseline in control experiments (p = 1.6 × 10⁻⁵, Student's t test: t(13) = 6.65). Traces represent superimposed fEPSPs recorded during baseline and 45 min after TPS in control experiments (top) and in experiments with apamin (bottom). Calibration: 1 mV, 5 ms. D, Apamin has no effect on TPS-induced LTP in dorsal hippocampal slices. At 45 min after TPS, fEPSPs were potentiated to 145 ± 3.8% of baseline in control experiments (n = 7) and 144 ± 4.2% of baseline in the presence of apamin (n = 7, p = 0.85, Student's t test: t(12) = 0.199).

References

    1. Abbott LF, Regehr WG (2004) Synaptic computation. Nature 431:796–803. 10.1038/nature03010 - DOI - PubMed
    1. Andreasen M, Lambert JD (1999) Somatic amplification of distally generated subthreshold EPSPs in rat hippocampal pyramidal neurones. J Physiol 519:85–100. 10.1111/j.1469-7793.1999.0085o.x - DOI - PMC - PubMed
    1. Aston-Jones G, Cohen JD (2005) An integrative theory of locus coeruleus-norepinephrine function: adaptive gain and optimal performance. Annu Rev Neurosci 28:403–450. 10.1146/annurev.neuro.28.061604.135709 - DOI - PubMed
    1. Ballesteros-Merino C, Watanabe M, Shigemoto R, Fukazawa Y, Adelman JP, Luján R (2014) Differential subcellular localization of SK3-containing channels in the hippocampus. Eur J Neurosci 39:883–892. 10.1111/ejn.12474 - DOI - PubMed
    1. Bannerman DM, Grubb M, Deacon RM, Yee BK, Feldon J, Rawlins JN (2003) Ventral hippocampal lesions affect anxiety but not spatial learning. Behav Brain Res 139:197–213. 10.1016/S0166-4328(02)00268-1 - DOI - PubMed

Publication types

MeSH terms

Substances