. 2017 Feb 15;37(7):1888-1899.
doi: 10.1523/JNEUROSCI.2712-16.2017. Epub 2017 Jan 16.

Differential Presynaptic ATP Supply for Basal and High-Demand Transmission

Affiliations

Differential Presynaptic ATP Supply for Basal and High-Demand Transmission

Courtney Sobieski et al. J Neurosci. .

Abstract

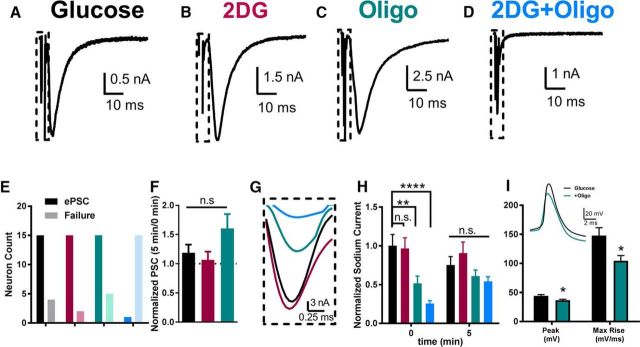
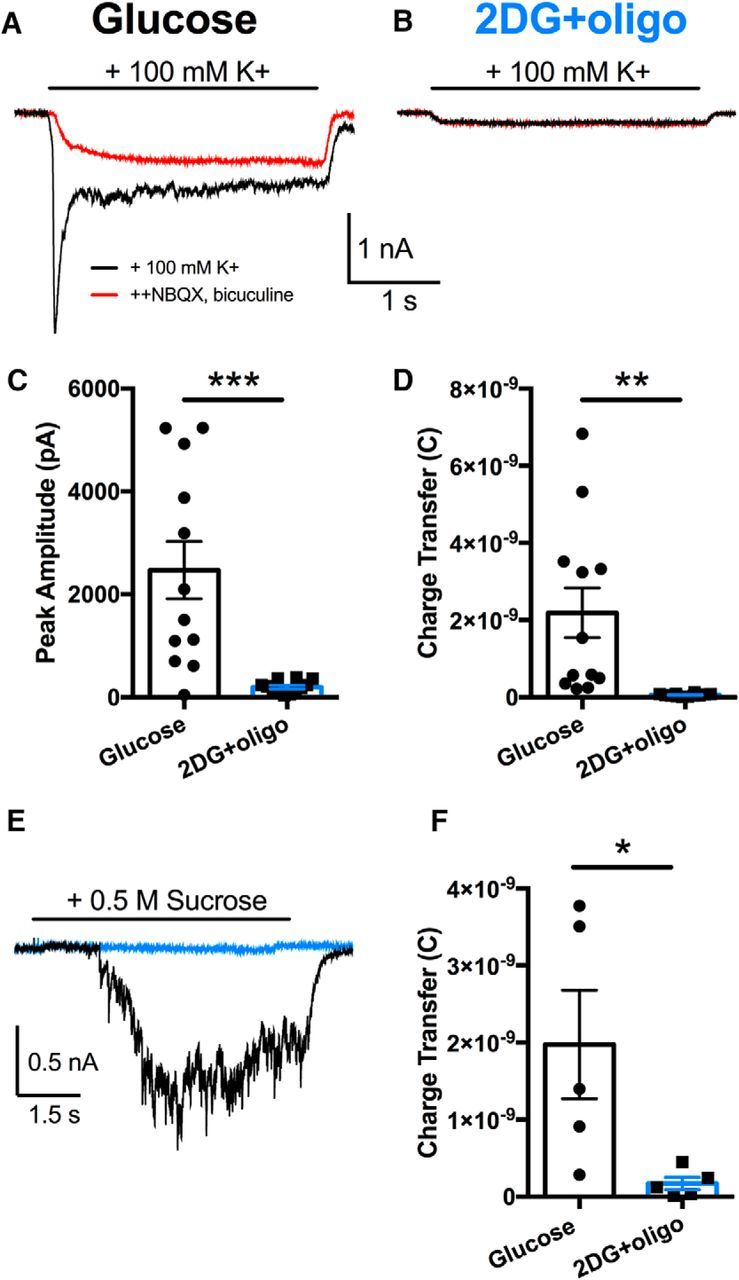
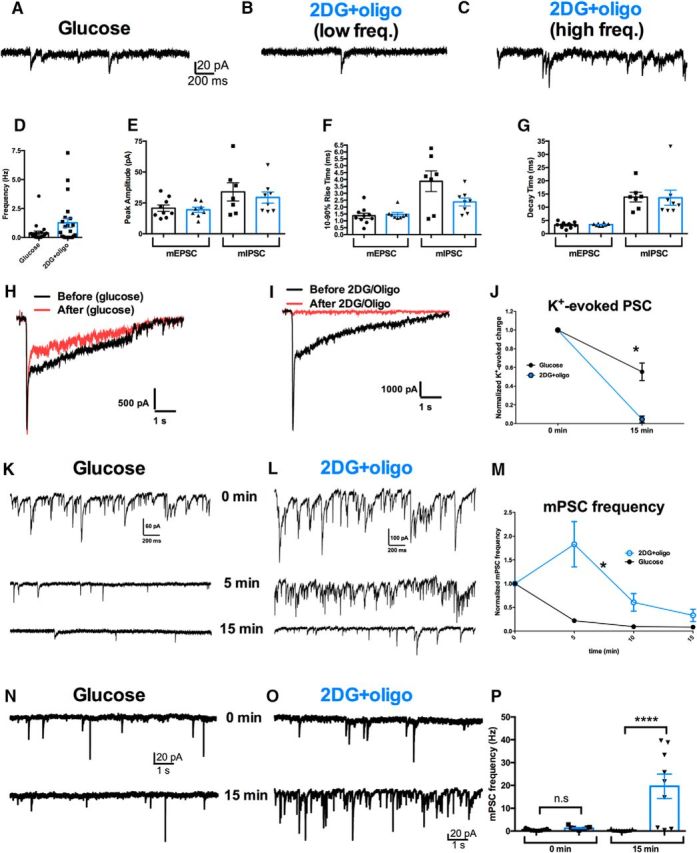
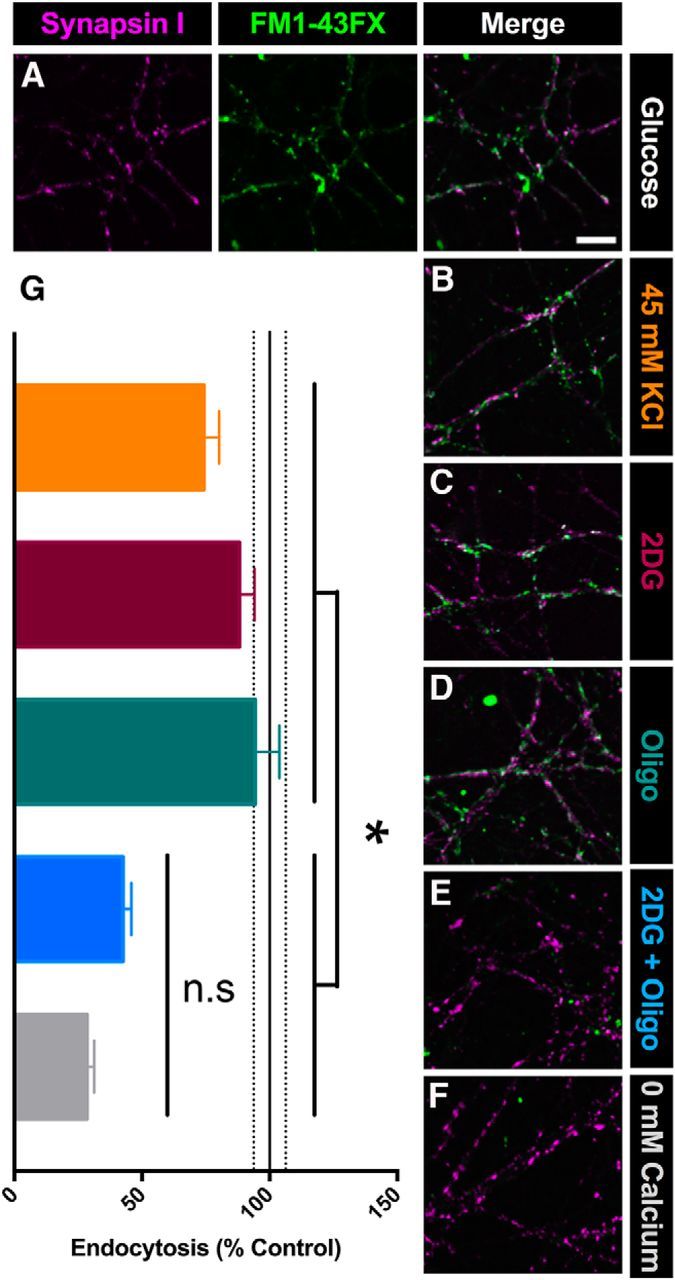
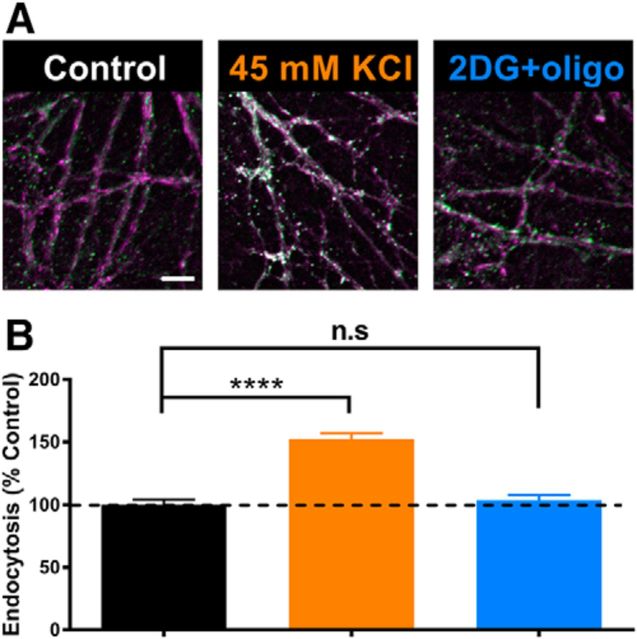
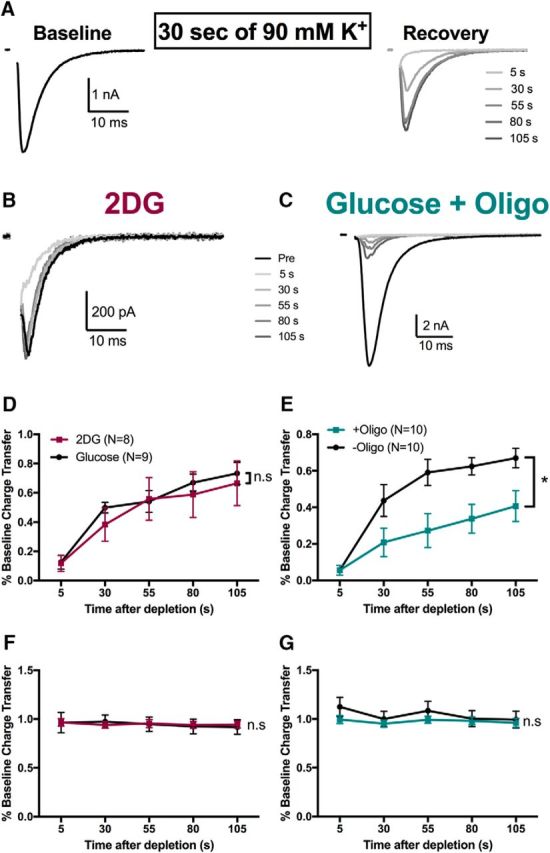
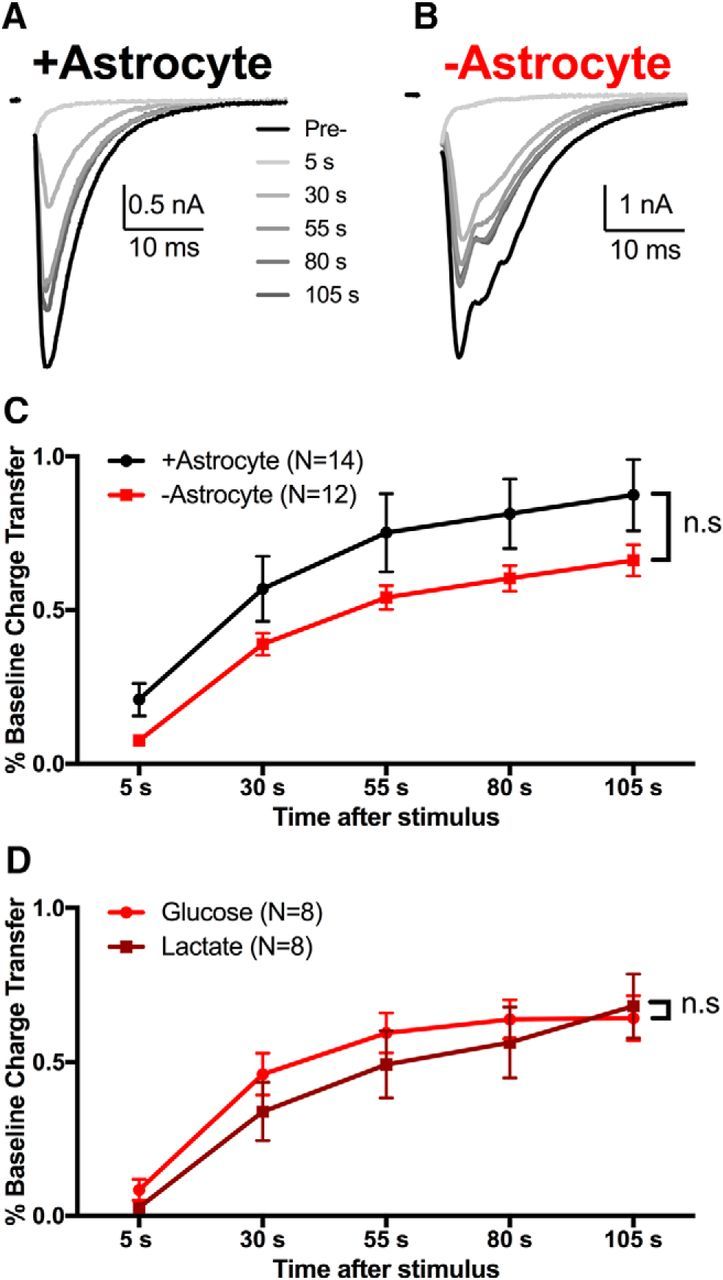
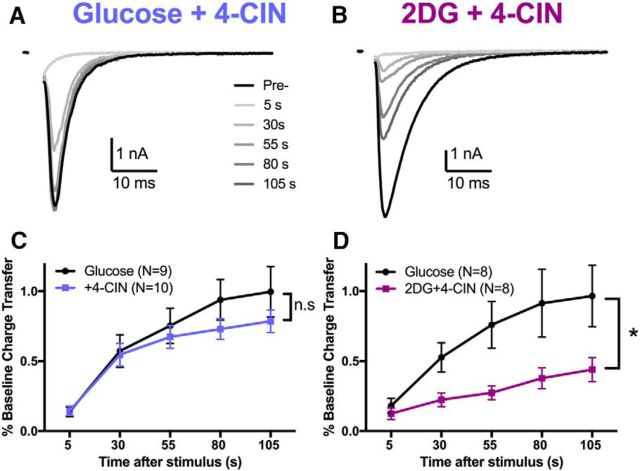
The relative contributions of glycolysis and oxidative phosphorylation to neuronal presynaptic energy demands are unclear. In rat hippocampal neurons, ATP production by either glycolysis or oxidative phosphorylation alone sustained basal evoked synaptic transmission for up to 20 min. However, combined inhibition of both ATP sources abolished evoked transmission. Neither action potential propagation failure nor depressed Ca2+ influx explained loss of evoked synaptic transmission. Rather, inhibition of ATP synthesis caused massive spontaneous vesicle exocytosis, followed by arrested endocytosis, accounting for the disappearance of evoked postsynaptic currents. In contrast to its weak effects on basal transmission, inhibition of oxidative phosphorylation alone depressed recovery from vesicle depletion. Local astrocytic lactate shuttling was not required. Instead, either ambient monocarboxylates or neuronal glycolysis was sufficient to supply requisite substrate. In summary, basal transmission can be sustained by glycolysis, but strong presynaptic demands are met preferentially by oxidative phosphorylation, which can be maintained by bulk but not local monocarboxylates or by neuronal glycolysis.SIGNIFICANCE STATEMENT Neuronal energy levels are critical for proper CNS function, but the relative roles for the two main sources of ATP production, glycolysis and oxidative phosphorylation, in fueling presynaptic function in unclear. Either glycolysis or oxidative phosphorylation can fuel low-frequency synaptic function and inhibiting both underlies loss of synaptic transmission via massive vesicle release and subsequent failure to endocytose lost vesicles. Oxidative phosphorylation, fueled by either glycolysis or endogenously released monocarboxylates, can fuel more metabolically demanding tasks such as vesicle recovery after depletion. Our work demonstrates the flexible nature of fueling presynaptic function to maintain synaptic function.

Keywords: astrocyte; glutamate; glycolysis; neuroenergetics; presynaptic.


Figures

Figure 1.
Figure 1.
Acute inhibition of glycolysis and oxidative phosphorylation impairs evoked vesicle release. AD, Representative evoked autaptic EPSCs elicited in each of the indicated conditions after 15 min of preincubation in the conditions before establishing the whole-cell recording. “2DG” designates substitution of 2DG (10 mm) for glucose. Oligo was applied at 1 μm. The dashed boxes indicate presynaptic stimulation currents, including an inward sodium current highlighted in G. E, Neurons exhibiting PSCs or no detectable PSC, from the four conditions, color-coded according to the text labels in AD (n = 16–20 neurons per condition). 2DG+oligo exhibited significantly more neurons lacking evoked PSCs than control glucose (χ2 = 30.35, p < 0.0001). F, Summary of evoked PSCs obtained after 5 min of stimulation (0.04 Hz) normalized to initial currents obtained on membrane break-in. There was no significant difference in PSC peak size of glucose, 2DG, or oligo alone after 5 min of recording compared with immediate break-in (p > 0.05 for all conditions; two-way repeated-measures ANOVA with Bonferroni corrections performed on raw data). No PSCs were evident at time 0 or 5 min after break-in in the 2DG+oligo condition, hence the lack of a bar. G, Representative sodium currents measured immediately on break-in in the four experimental conditions taken from the time period indicated by the dashed boxes in AD. Colors correspond to the text labels in AD. H, Summary of sodium current obtained immediately after break-in and after 5 min of stimulation normalized to 0 min sodium current in glucose. At 0 min, the oligo and 2DG+oligo conditions were significantly smaller than glucose controls (p < 0.01, 0.0001 for oligo and 2DG+oligo, respectively; two-way repeated-measures ANOVA with Bonferroni corrections performed on raw data) At 5 min, there was no significant difference between glucose and the three remaining conditions (p > 0.05 for all conditions, two-way repeated-measures ANOVA with Bonferroni corrections performed on raw data). Data are represented as mean ± SEM. **p ≤ 0.01; ***p ≤ 0.001; n.s, nonsignificant. I, Action potential waveform changes resulting from oligo-only treatment. Current-clamp recordings were established after incubations as above and a family of depolarizing currents (5–10 pA increment, 1200 ms) was injected to elicit a just-suprathreshold action potential. Peak and maximum rate of rise were measured in 27 control neurons and 25 oligo-treated neurons. The inset shows an exemplar action potential from one cell in each condition superimposed.
Figure 2.
Figure 2.
Presynaptic vesicle release is also impaired when action potentials and calcium influx are bypassed. A, B, Representative autaptic currents evoked by 100 mm K+ for 3 s, as indicated by the horizontal bar. Red traces indicate the same treatment, but in the presence of a mixture of postsynaptic receptor blockers (1 μm NBQX, 50 μm bicuculline), revealing nonsynaptic currents elicited by K+. C, D, Summary of antagonist-sensitive peak PSC amplitude and total charge transfer for the two conditions (n = 12,12; p < 0.001, 0.01, respectively, unpaired, two-tailed Student's t test with Bonferroni corrections) measured from the antagonist-subtracted currents. E, Representative traces of hypertonic sucrose (0.5 m) used to elicit exocytosis of releasable vesicles from neurons in the glucose control (black trace) and 2DG+oligo-treated (blue trace) neurons. F, Summary of sucrose-elicited charge transfer from glucose-treated (n = 5 neurons) and 2DG+oligo-treated (n = 5 neurons) cells (p < 0.05, unpaired, two-tailed Student's t test). Individual data points represent single neurons, bars represent mean ± SEM. *p ≤ 0.05; **p ≤ 0.01; ***p ≤ 0.001.
Figure 3.
Figure 3.
Metabolically compromised neurons exhibit high variance in mPSC frequency and display gradual, massive exocytosis. AC, Representative traces of the indicated experimental conditions. Drug concentrations are as in Figures 1 and 2. Examples B and C represent different cells in the same condition with different spontaneous mPSC release frequency. D, Summary of pooled mPSC frequency in the two conditions, revealing the higher variance in mPSC frequency in 2DG+oligo (n = 21, 22 neurons in glucose and 2DG+oligo conditions, respectively; p = 0.0002, F test). The difference between conditions was not significantly different (p > 0.05, unpaired, two-tailed Student's t test with Bonferroni corrections). EG, Summary of mPSC parameters, separated by mEPSCs (n = 9, 7 neurons in glucose and 2DG+oligo conditions, respectively) and mIPSCs (n = 8, 8 neurons in glucose and 2DG+oligo conditions, respectively). No significant differences were found on any of the parameters between glucose and 2DG+oligo (p > 0.05, unpaired, two-tailed Student's t test with Bonferroni corrections). H, I, Representative traces documenting the effect of control (glucose) or 2DG+oligo application on evoked and spontaneous release during recordings from a neuron on a multineuron island. During recordings in TTX, K+ was applied as in Figure 2 to elicit transmitter release from surrounding terminals. Shown are antagonist-subtracted currents at baseline (black) and after 15 min of control or 2DG+oligo application. J, Summary of the change in total antagonist-subtracted (receptor-generated) charge after 15 min of incubation. Some depression in control K+-evoked PSCs (n = 7) was noted. However, 2DG+oligo (n = 6) caused a complete loss of evoked PSC. A repeated-measures ANOVA revealed a significant interaction between treatment condition and time (*p < 0.01). K, L, mPSC recordings from the neurons shown in H and I. The traces document mPSCs at three 30 s epochs after the baseline K+ application, as labeled. Initially (time = 0), mPSC frequency is high in both cells, a residual effect of K+ application. M, Summary of mPSC frequency change from 30 s epochs during incubation in 2DG+oligo. Same 13 cells represented in J. 2DG+oligo elicited a significantly more sustained mPSC frequency than control (*p < 0.005 main effect of treatment and interaction between time and treatment). NP, The increased mPSC frequency increase was not the result of interaction with K+ stimulation. N, O, Sample records from control and poisoned neurons without preceding K+ stimulation. P, Summary data from multiple cells at early and late time points. A two-way, repeated-measures ANOVA revealed a main effect of poison and a drug by time interaction (p < 0.05). Asterisks indicate Bonferroni corrected post hoc testing. ****p ≤ 0.0001; n.s, not significant. Individual data points represent neurons and bars represent mean ± SEM.
Figure 4.
Figure 4.
Synaptic vesicle cycling is impaired after combined inhibition of glycolysis and oxidative phosphorylation. A, Representative images of presynaptic terminals immunopositive for synapsin I (left, magenta) after induced vesicle cycling in the presence of FM1–43FX (center, green) and merged (right, white), showing the internalization of FM1–43FX during vesicle endocytosis in the presence of glucose. BF, Example merged images after 20 min of preincubation in solution containing 45 mm KCl (B), 2DG (C), oligo (D), 2DG+oligo (E), or 0 mm Ca2+ (F). G, Summary of cycling (A; n = 150 presynaptic terminals for each condition from three replications). Scale bar, 10 μm. *p < 0.05 for all the comparisons between each of the 45 mm KCl, 2DG, and oligo conditions and either the 2DG+oligo or 0 mm Ca2+ condition (45 mm KCl vs 2DG + oligo, p = 0.0127; 2DG vs 2DG+oligo, p < 0.0001; oligo vs 2DG + oligo, p = 0.0026; 45 mm KCl vs 0 mm Ca2+, p < 0.0001; 2DG vs 0 mm Ca2+, p < 0.0001; oligo vs 0 mm Ca2+, p < 0.001). The 2DG+oligo condition was not significantly different from the 0 mm Ca2+ condition (NS, p = 0.0746, Kruskal–Wallis one-way ANOVA followed by Dunn's multiple-comparisons test). Data are represented as mean ± SEM. *p ≤ 0.05; n.s, nonsignificant.
Figure 5.
Figure 5.
Endocytosis is inhibited during metabolic arrest despite continued exocytosis. FM1–43FX incubation occurred during 20 min of glucose (control), sustained depolarization, or 2DG+oligo. A, Representative images show merged fluorescence of synapsin labeling (magenta) and FM1–43 uptake (green). Scale bar, 10 μm. B, Summary of 150 terminals from three independent experiments reveals that, although continued cycling is evident with sustained depolarization, FM1–43 uptake is lost during metabolic arrest despite strong, prolonged exocytosis evident in Figure 3. ***p < 0.001.
Figure 6.
Figure 6.
Oxidative phosphorylation plays a privileged role in recovery from intense presynaptic activity. A, Schematic and representative data showing autaptic EPSCs evoked by action potentials in normal glucose solution before (left) and after (right) vesicle depletion with strong, sustained depolarization with 90 mm K+ for 30 s. Stimulus action currents in this figure and subsequent figures are blanked for clarity. B, C, Representative recovery traces from 2DG (B) and oligo-alone (C) treatments showing poor recovery from vesicle depletion in the oligo alone condition. D, E, Summary of recovery of action-potential-evoked EPSCs after the depletion protocol for 2DG compared with glucose control (D, p > 0.05, two-way ANOVA) and glucose saline in the presence (+oligo) or absence (-oligo) of 1 μm oligomycin (E, p < 0.05 two-way ANOVA). F, G, Summary of axosomatic sodium currents after the depletion protocol for 2DG compared with glucose control (F, p > 0.05, two-way ANOVA) and glucose saline in the presence or absence of oligomycin (G, p > 0.05, two-way ANOVA). Data are represented as mean ± SEM. *p ≤ 0.05; n.s, nonsignificant.
Figure 7.
Figure 7.
Local, on-demand monocarboxylate shuttling does not support the oxidative phosphorylation required for recovery. A, B, Recovery of evoked EPSCs after 30 s of 90 mm K+ from microcultures containing (+astrocyte) or missing (−astrocyte) a local astrocyte bed. Note that both +astrocyte and −astrocyte microcultures were obtained from the same plates. C, Summary of recovery after vesicle depletion in +astrocyte (black) and −astrocyte (red) microcultures (p > 0.05, two-way ANOVA). D, Summary of recovery of sibling −astrocyte EPSCs incubated in control medium (light red) or in lactate (dark red, 1.5 mm, 15 min; p > 0.05, two-way ANOVA). Data are represented as mean ± SEM. n.s, nonsignificant.
Figure 8.
Figure 8.
Oxidative phosphorylation fueling presynaptic recovery is flexibly supplied by neuronal glycolysis or by monocarboxylate transport. A, B, Representative traces of EPSC recovery after monocarboxylate transport inhibition alone (A; 4-CIN, 100 μm) or combined inhibition of glycolysis and monocarboxylate transport (B; 2DG+4-CIN) for 15 min. C, D, Summary of recovery after 30 s of 90 mm K+ after incubation in 4-CIN alone (C, p > 0.05, two-way ANOVA) or combined 2DG+4-CIN (D, p < 0.05, two-way ANOVA). Data are represented as mean ± SEM. *p ≤ 0.05; n.s, nonsignificant.

References

    1. Allen NJ, Rossi DJ, Attwell D (2004) Sequential release of GABA by exocytosis and reversed uptake leads to neuronal swelling in simulated ischemia of hippocampal slices. J Neurosci 24:3837–3849. 10.1523/JNEUROSCI.5539-03.2004 - DOI - PMC - PubMed
    1. Attwell D, Laughlin SB (2001) An energy budget for signaling in the grey matter of the brain. J Cereb Blood Flow Metab 21:1133–1145. - PubMed
    1. Auestad N, Korsak RA, Morrow JW, Edmond J (1991) Fatty acid oxidation and ketogenesis by astrocytes in primary culture. J Neurochem 56:1376–1386. 10.1111/j.1471-4159.1991.tb11435.x - DOI - PubMed
    1. Bekkers JM, Stevens CF (1991) Excitatory and inhibitory autaptic currents in isolated hippocampal neurons maintained in cell culture. Proc Natl Acad Sci U S A 88:7834–7838. 10.1073/pnas.88.17.7834 - DOI - PMC - PubMed
    1. Bittner CX, Loaiza A, Ruminot I, Larenas V, Sotelo-Hitschfeld T, Gutiérrez R, Córdova A, Valdebenito R, Frommer WB, Barros LF (2010) High resolution measurement of the glycolytic rate. Front Neuroenergetics 2: pii: 26. 10.3389/fnene.2010.00026 - DOI - PMC - PubMed

Publication types

MeSH terms