Review
. 2017 Mar 5;372(1715):20160259.
doi: 10.1098/rstb.2016.0259.

Hebbian plasticity requires compensatory processes on multiple timescales

Affiliations
Review

Hebbian plasticity requires compensatory processes on multiple timescales

Friedemann Zenke et al. Philos Trans R Soc Lond B Biol Sci. .

Abstract

We review a body of theoretical and experimental research on Hebbian and homeostatic plasticity, starting from a puzzling observation: while homeostasis of synapses found in experiments is a slow compensatory process, most mathematical models of synaptic plasticity use rapid compensatory processes (RCPs). Even worse, with the slow homeostatic plasticity reported in experiments, simulations of existing plasticity models cannot maintain network stability unless further control mechanisms are implemented. To solve this paradox, we suggest that in addition to slow forms of homeostatic plasticity there are RCPs which stabilize synaptic plasticity on short timescales. These rapid processes may include heterosynaptic depression triggered by episodes of high postsynaptic firing rate. While slower forms of homeostatic plasticity are not sufficient to stabilize Hebbian plasticity, they are important for fine-tuning neural circuits. Taken together we suggest that learning and memory rely on an intricate interplay of diverse plasticity mechanisms on different timescales which jointly ensure stability and plasticity of neural circuits.This article is part of the themed issue 'Integrating Hebbian and homeostatic plasticity'.

Keywords: Hebbian plasticity; heterosynaptic plasticity; homeostasis; metaplasticity; rapid compensatory processes; synaptic scaling.


Figures

Figure 1.
Figure 1.
The timescales of synaptic scaling or metaplasticity are faster in models than reported in experiments. Here, we plot the timescale of either synaptic scaling or homeostatic metaplasticity as used in influential modeling studies (light grey). For comparison, we plot the typical readout time for experimental studies on synaptic scaling and metaplasticity (dark red). Publications suffixed with * describe network models as opposed to the other studies which relied on single neurons. Note that the model marked with † by Toyoizumi et al. [17] is an interesting case which has both RCPs and a slow form of homeostasis. Here, we have aligned it according to its homeostatic timescale. Work referenced in the figure: [,,–35].
Figure 2.
Figure 2.
Illustration of rapid and slow compensatory processes in a variation of Oja's rule. (a) Here, we have used a fast filter time constant τ = 0.1 η−1 (cf. equation (3.2)) and plot the output firing rate yi (solid) and the delayed estimate formula image 
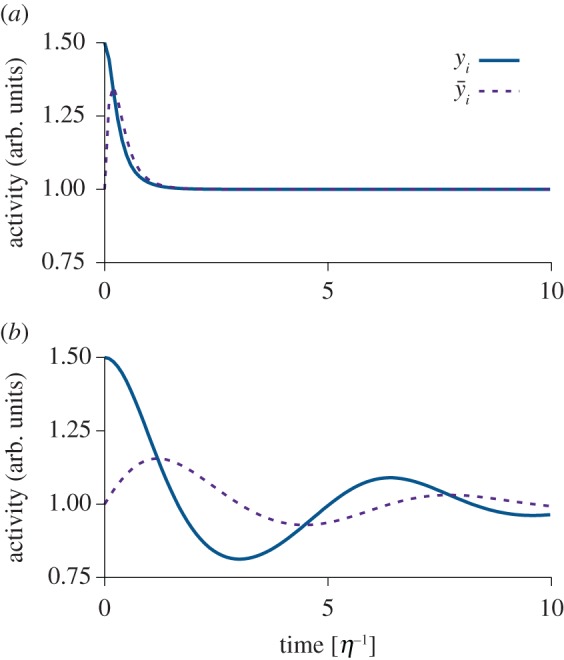
(dashed). (b) Same as in (a), but with τ = 2η−1. Model: we simulated formula image, formula image and y = wx with x ≡ 1.
Figure 3.
Figure 3.
Most plasticity models can reproduce the notion of a plasticity threshold reported in experiments. (a) The change in synaptic efficacy in many plasticity models is a function of variables related to postsynaptic activation. The parameter θ is fixed and marks the transition point (threshold) between LTP and LTD. (b) Schematic of the action of the homeostatic moving threshold θ(t) in the BCM model [5]. When the average formula image 
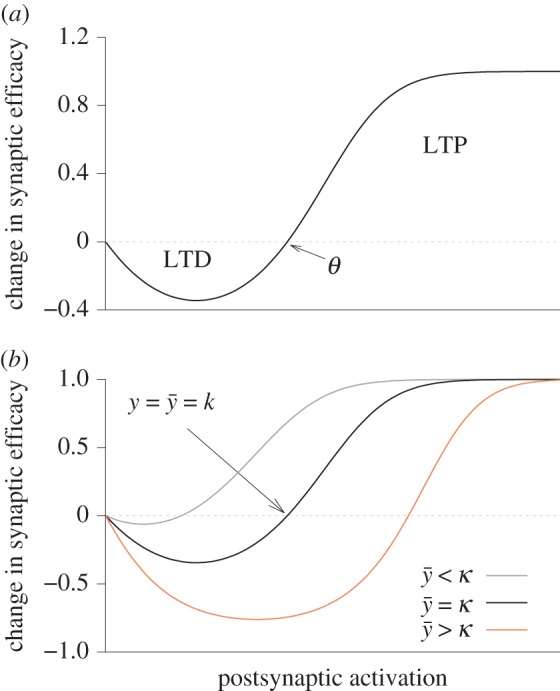
is larger than the target value κ, θ(t) shifts to higher values. Likewise, θ(t) shifts to lower values when formula image is too low. For formula image changes in synaptic efficacy are zero.
Figure 4.
Figure 4.
The effect of slow homeostatic mechanisms and RCPs on the neuronal code. (a) Fluctuating external world stimulus over time. (b) Neural activity ‘A = w × input’ over time. A slow negative feedback mechanism (homeostasis) adjusts w to push A towards a single target (dashed line) which is rarely reached; negative feedback is modelled as formula image. With a slow homeostatic mechanism, a neuron can track input relatively accurately. (c) Same as b, but for a rapid compensatory process (τslow = 50τfast) which drives the activity quickly to the target value. If the timescale of feedback is comparable to that of the stimulus, negative feedback interferes with the neuron's ability to track the stimulus. (d) RCPs enforcing an allowed range (limits indicated by dotted lines). Even though the neuronal activity does not capture all the diversity of the input, it does capture some of it. Here, we modelled the RCPs as the following nonlinear extension of the above model: formula image with f(x) = x for formula image and f(x) = 0 otherwise.
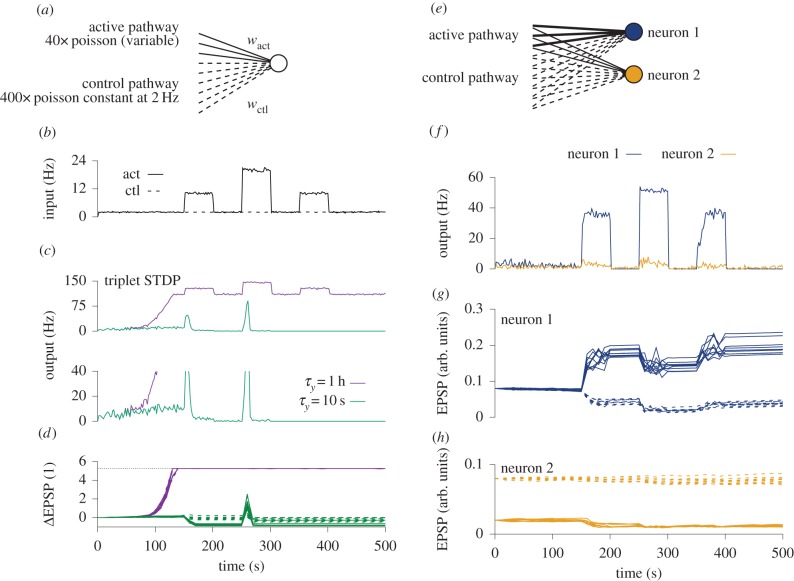
Figure 5.
Figure 5.
Firing rate stabilization, synaptic weights and feature selectivity through RCPs. (a) Schematic figure of single neuron with two distinct input pathways. The ‘active’ pathway consists of 40 Poisson neurons switching their rates synchronously among 2, 10 and 20 Hz. The control pathway consists of 400 neurons all firing constantly at 2 Hz. Synaptic plasticity is modelled with triplet STDP [27] with a BCM-like sliding threshold as defined in equations (3.2)–(3.4). All weights are initialized at the same value and can freely move between hard bounds at zero and ≈6 times the initial value. (b) Population firing rates of the input populations averaged over 2 s bins. Firing rates in the active pathway (solid line) are switched three times from 2 Hz to a higher rate and back (10, 20 and 10 Hz for 50 s each time), whereas firing rates in the control pathway are constant at 2 Hz. (c) Output firing rates of a single postsynaptic neuron. Purple, slow sliding threshold, with time constant τy = 1 h; green, fast sliding threshold, τy = 10 s; (see Zenke et al. [26], κ = 3 Hz in equation (3.4)). Top and bottom show the same firing rate plot for different y-axis ranges. (d) Relative weight changes for 10 randomly chosen weights from each pathway for the slow (purple) and the fast (green) sliding threshold. Solid lines correspond to active pathway weights and dashed lines to the control pathway. Note that for the fast sliding threshold the active pathway develops weaker synapses than the control pathway. For the slow sliding threshold, all weights saturate. (e) Simplified sketch of the same set-up as in (a), but with two postsynaptic neurons. The only difference between the two neurons is the choice of initial conditions of the synaptic weights. For neuron 2, the active pathway weights are initialized at a lower value than for neuron 1. All synaptic weights exhibit triplet STDP combined with heterosynaptic plasticity [103]. (f) Output firing rates of the two neurons over time. Neuron 1 (blue) responds selectively (with rates more than 30 Hz) to the elevated inputs in the active pathway (cf. b). Neuron 2 (orange) continues to fire with low firing rates. (g) Evolution of weights over time for neuron 1. Active pathway weights are plotted as solid lines and control pathway weights are dashed. For neuron 1, the synapses in the active pathway undergo LTP during the first strong stimulation of the active pathway. However, weights quickly saturate. Synapses in the control pathway exhibit heterosynaptic depression. (h) Same as g, but for neuron 2. The weights in the active pathway are slightly depressed during initial stimulation.
Figure 6.
Figure 6.
Reproducible responses to input stimuli with varying strength. (a) Population firing rate of active input pathway for the continuation of the simulation shown in figure 5b,e–h. The neuron is stimulated 16 times with four interleaved steps of increasing input firing rate in the active pathway. (b) Output firing rate of neuron 1 (200 ms bins; cf. figure 5f). After the first set of stimuli, responses to the later sets remain graded and are overall reproducible. (c) Data points from (a) and (b) (input and output) plotted against each other.
Figure 7.
Figure 7.
Stable activity in a recurrent neural model with ongoing plasticity. (a) Memory recall in associative cell assemblies through selective delay activity in a network which previously has learned to distinguish between four repeating input patterns [103]. The coloured bars at the top indicate time and duration of external stimulation with one out of four stimuli. The colour indicates stimulus identity. The spike raster in the middle shows spiking activity of 256 randomly chosen excitatory cells from the network. The graph at the bottom shows the firing rate of the four subpopulations defined by the cell assemblies in the network. The multistable plasticity model of equation (7.1) is active throughout the simulation. (b) Histogram of the coefficient of variation of the inter-spike interval of excitatory cells in the network during the interval indicated by the black range bar in (a). (c) As in (b), but for mean neuronal firing rates over the same interval. (d) Distribution of synaptic efficacies of plastic recurrent synapses at the end of the network simulation. Figure adapted from Zenke [122] and Zenke et al. [103].
Figure 8.
Figure 8.
Hypothetical evolution of synaptic state variable as a function of time during a hypothetical LTP induction experiment. The linear ramp over the entire duration of the plasticity protocol is a common assumption underlying many plasticity protocols. However, since the synaptic state during plasticity induction is typically not observable, many time courses and thus plasticity modes are compatible with the data. Note, that most plasticity models will interpret the ‘synaptic state’ as the synaptic efficacy, whereas in experiments the synaptic efficacy may follow after a short delay.

References

    1. Turrigiano GG, Leslie KR, Desai NS, Rutherford LC, Nelson SB. 1998. Activity-dependent scaling of quantal amplitude in neocortical neurons. Nature 391, 892–896. (10.1038/36103) - DOI - PubMed
    1. Hebb DO. 1949. The organization of behavior: a neuropsychological theory. New York, NY: John Wiley & Sons.
    1. Morris RGM, Anderson E, Lynch GS, Baudry M. 1986. Selective impairment of learning and blockade of long-term potentiation by an N-methyl-d-aspartate receptor antagonist, AP5. Nature 319, 774–776. (10.1038/319774a0) - DOI - PubMed
    1. Martin SJ, Grimwood PD, Morris RGM. 2000. Synaptic plasticity and memory: an evaluation of the hypothesis. Annu. Rev. Neurosci. 23, 649–711. (10.1146/annurev.neuro.23.1.649) - DOI - PubMed
    1. Bienenstock E, Cooper L, Munro P. 1982. Theory for the development of neuron selectivity: orientation specificity and binocular interaction in visual cortex. J. Neurosci. 2, 32–48. - PMC - PubMed

Publication types

LinkOut - more resources