. 2018 Feb;19(2):464-475.
doi: 10.1111/mpp.12538. Epub 2017 Mar 9.

Arabidopsis thaliana GLUTATHIONE-S-TRANSFERASE THETA 2 interacts with RSI1/FLD to activate systemic acquired resistance

Affiliations

Arabidopsis thaliana GLUTATHIONE-S-TRANSFERASE THETA 2 interacts with RSI1/FLD to activate systemic acquired resistance

Zeeshan Zahoor Banday et al. Mol Plant Pathol. 2018 Feb.

Abstract

A partly infected plant develops systemic acquired resistance (SAR) and shows heightened resistance during subsequent infections. The infected parts generate certain mobile signals that travel to the distal tissues and help to activate SAR. SAR is associated with epigenetic modifications of several defence-related genes. However, the mechanisms by which mobile signals contribute to epigenetic changes are little known. Previously, we have shown that the Arabidopsis REDUCED SYSTEMIC IMMUNITY 1 (RSI1, alias FLOWERING LOCUS D; FLD), which codes for a putative histone demethylase, is required for the activation of SAR. Here, we report the identification of GLUTATHIONE-S-TRANSFERASE THETA 2 (GSTT2) as an interacting factor of FLD. GSTT2 expression increases in pathogen-inoculated as well as pathogen-free distal tissues. The loss-of-function mutant of GSTT2 is compromised for SAR, but activates normal local resistance. Complementation lines of GSTT2 support its role in SAR activation. The distal tissues of gstt2 mutant plants accumulate significantly less salicylic acid (SA) and express a reduced level of the SA biosynthetic gene PAL1. In agreement with the established histone modification activity of FLD, gstt2 mutant plants accumulate an enhanced level of methylated and acetylated histones in the promoters of WRKY6 and WRKY29 genes. Together, these results demonstrate that GSTT2 is an interactor of FLD, which is required for SAR and SAR-associated epigenetic modifications.

Keywords: epigenetic modifications; flowering locus D; glutathione-S-transferase; phenylalanine ammonia lyase 1; reduced systemic immunity 1; salicylic acid; systemic acquired resistance.


Figures

Figure 1
Figure 1
Physical interaction of FLOWERING LOCUS D (FLD) and GLUTATHIONE‐S‐TRANSFERASE THETA 2 (GSTT2). (A) Interacting partners of REDUCED SYSTEMIC IMMUNITY 1 (RSI1)/FLD obtained in yeast two‐hybrid (Y2H) screening of an Arabidopsis cDNA library. p53 and T7‐antigen were used as positive control for interaction; Lam (laminin protein of nuclear membrane) and T7‐antigen were used as negative control for interaction. (B) Schematic representation of annotated domains of FLD and GSTT2. Numbers indicate amino acid positions. N and C indicate N‐ and C‐termini, respectively; SWM, SWIRM; PAO, polyamine oxidase; MyBL, Myb‐like extension; CL, C‐terminal like. (C) Interaction of domains of FLD and GSTT2 in Y2H. Cells were plated in quadruple dropout medium (SD‐Leu/‐Trp/‐His/‐Ade). (D) Co‐immunoprecipitation of FLD and GSTT2 in Nicotiana benthamiana leaves transiently expressing GSTT2‐HA and FLD‐Myc, using tag‐specific antibody for immunoprecipitation (IP) or western blotting (WB). (E) Bimolecular fluorescence complementation (BiFC) of FLD and GSTT2. Both FLD and GSTT2 fused with truncated N‐ and C‐termini of yellow fluorescent protein (YFP) were co‐expressed in onion epidermal cells. The interaction and co‐localization were visualized by confocal microscopy. All photographs were taken at the same magnification. Scale bar is 50 µm. DAPI, 4′,6‐diamidino‐2‐phenylindole; DIC, differential interference contrast. Arabidopsis cDNA library screening (A) was performed once and other experiments were performed at least twice with similar results.
Figure 2
Figure 2
GLUTATHIONE‐S‐TRANSFERASE THETA 2 (GSTT2) expression after mock or pathogen inoculation. (A) GSTT2 expression in local inoculated tissues of wild‐type (WT, Col‐0) plants at given time points after inoculation with Pseudomonas syringae pv tomato DC3000 (Pst), P. syringae pv tomato DC3000 carrying the AvrRpt2 gene (Avr‐Pst) or 10 mm MgCl2 (Mock). (B) GSTT2 expression in uninoculated systemic tissues of WT plants after local inoculation with Pst, Pst‐Avr or 10 mm MgCl2 (Mock). Five‐week‐old, soil‐grown plants were inoculated with 1 × 10⁷ colony‐forming units (CFU)/mL of Avr‐Pst, 5 × 10⁵ CFU/mL of Pst or 10 mm MgCl2 (Mock). After 3 days, local and uninoculated systemic tissues were harvested and the expression of GSTT2 was analysed by quantitative reverse‐transcription real‐time polymerase chain reaction (qRT‐PCR). Each time point represents the mean ± standard deviation (n = 3). Asterisks indicate significant difference in expression from the corresponding mock‐treated samples as determined by Student's t‐test (*P < 0.05, **P < 0.001). Experiments were repeated twice with similar results.
Figure 3
Figure 3
Bacterial numbers and expression of defence‐related genes. (A) Pseudomonas syringae pv maculicola ES4326 (Psm) counts and disease symptoms in wild‐type (WT) and gstt2 plants which were previously either induced for systemic acquired resistance (SAR) by P. syringae pv tomato DC3000 carrying the AvrRpt2 gene (Avr‐Pst) (Avr) or mock induced by 10 mm MgCl2 (m). (B, C) Bacterial counts and disease symptoms in local leaves of WT and gstt2 plants after inoculation with P. syringae pv tomato DC3000 (Pst) (B) or Avr‐Pst (C) pathogens. (D–H) Expression of PR1, WRKY29, WRKY6, FMO1 and SnRK2.8 in systemic leaves, 3 days after inoculation of lower leaves with either 10 mm MgCl2 (Mock) or Avr‐Pst (Avr). Transcript accumulation was determined by quantitative reverse‐transcription real‐time PCR (qRT‐PCR). (I) Psm counts in WT, complementation (GSTT2 expressing; Cm1–Cm3) and vector transformed (Vc1, Vc2) lines, 3 days after inoculation of the lower leaves with either 10 mm MgCl2 (Mock) or Avr‐Pst (Avr). In (A–C) and (I), each bar represents the mean ± standard deviation of four samples, each containing four leaf discs of 5 mm in diameter. In (D–H), each bar represents the mean ± standard deviation of three RNA samples. Letters above the bars indicate significant differences in bacterial counts or transcript accumulation from each other by one‐way analysis of variance (ANOVA), Holm–Sidak method (P < 0.05 or P < 0.001). Pathogen growth experiments were repeated three times and expression analyses were repeated twice with similar results.
Figure 4
Figure 4
Salicylic acid (SA) accumulation and the expression of ISOCHORISMATE SYNTHASE 1 (ICS1) and PHENYLALANINE AMMONIA LYASE 1 (PAL1) in wild‐type (WT) and gstt2 mutants. (A) Total SA accumulated in the systemic leaves of WT, gstt2 and complemented (Cm1, Cm2) lines at 2 days after infiltration of the lower leaves with 10 mm MgCl2 (Mock) or Pseudomonas syringae pv tomato DC3000 carrying the AvrRpt2 gene (Avr‐Pst) (Avr). (B, C) ICS1 and PAL1 expression in the systemic leaves of WT and gstt2 plants after infiltration of the lower leaves with 10 mm MgCl2 (Mock) or 1 × 10⁷ colony‐forming units (CFU)/mL Avr‐Pst. Transcript accumulation was determined by quantitative reverse‐transcription real‐time PCR (qRT‐PCR). In (A), letters above the bars indicate significant difference in SA accumulation from each other by one‐way analysis of variance (ANOVA), Holm–Sidak method (P < 0.05). In (C), **P < 0.001 indicates significant difference between corresponding WT and gstt2 samples as determined by Student's t‐test. Experiments were repeated at least twice with similar results.
Figure 5
Figure 5
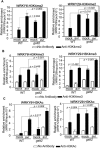
H3K4me2/3 and H3KAc occupancy at WRKY6 and WRKY29 promoters of wild‐type (WT) and gstt2 plants. (A) H3K4me2 occupancy at WRKY6 and WRKY29 promoters. (B) H3K4me3 occupancy at WRKY6 and WRKY29 promoters. (C) H3K(9 + 14 + 18 + 23 + 27)Ac occupancy at the promoters of WRKY6 and WRKY29. Each bar represents the relative enrichment normalized with input ± standard deviation of three independent samples. P values, determined by Student's t‐test, are indicated above the bars. Experiments were repeated twice with similar results.

References

    1. Aasland, R. , Stewart, A.F. and Gibson, T. (1996) The SANT domain: a putative DNA‐binding domain in the SWI‐SNF and ADA complexes, the transcriptional co‐repressor N‐CoR and TFIIIB. Trends Biochem. Sci. 21, 87–88. - PubMed
    1. Alvarez, M.E. , Pennell, R.I. , Meijer, P.J. , Ishikawa, A. , Dixon, R.A. and Lamb, C. (1998) Reactive oxygen intermediates mediate a systemic signal network in the establishment of plant immunity. Cell, 92, 773–784. - PubMed
    1. Aravind, L. and Iyer, L.M. (2002) The SWIRM domain: a conserved module found in chromosomal proteins points to novel chromatin‐modifying activities. Genome Biol. 3, research0039.1‐research0039.7. - PMC - PubMed
    1. Attaran, E. , Zeier, T.E. , Griebel, T. and Zeier, J. (2009) Methyl salicylate production and jasmonate signaling are not essential for systemic acquired resistance in Arabidopsis. Plant Cell, 21, 954–971. - PMC - PubMed
    1. Banday, Z.Z. and Nandi, A.K. (2015) Interconnection between flowering time control and activation of systemic acquired resistance. Front. Plant Sci. 6, 174. - PMC - PubMed

Publication types

MeSH terms