. 2017 Jan 5;20(1):135-148.
doi: 10.1016/j.stem.2016.09.004. Epub 2016 Oct 27.

Predictive Markers Guide Differentiation to Improve Graft Outcome in Clinical Translation of hESC-Based Therapy for Parkinson's Disease

Affiliations

Predictive Markers Guide Differentiation to Improve Graft Outcome in Clinical Translation of hESC-Based Therapy for Parkinson's Disease

Agnete Kirkeby et al. Cell Stem Cell. .

Abstract

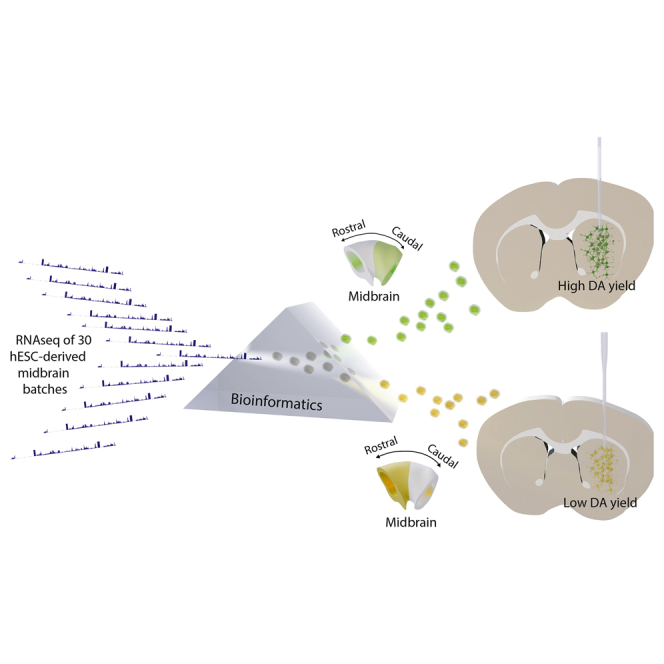
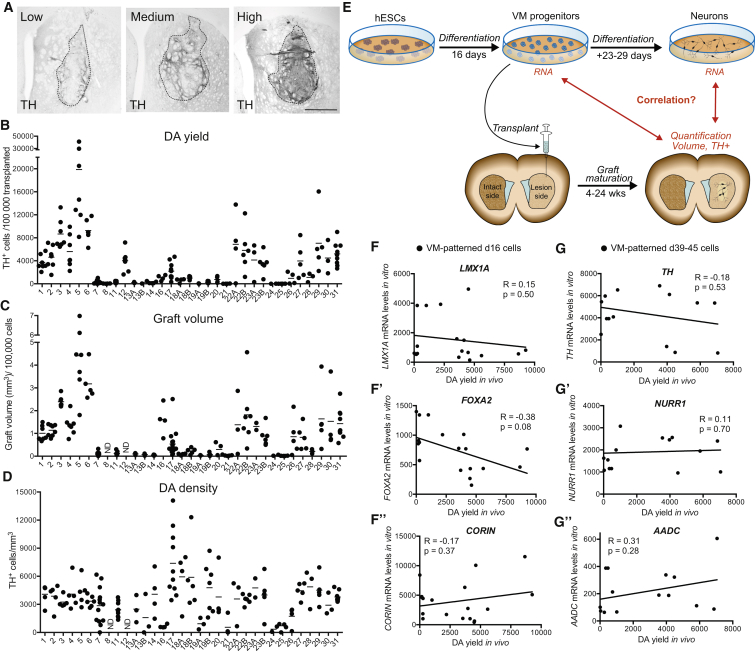
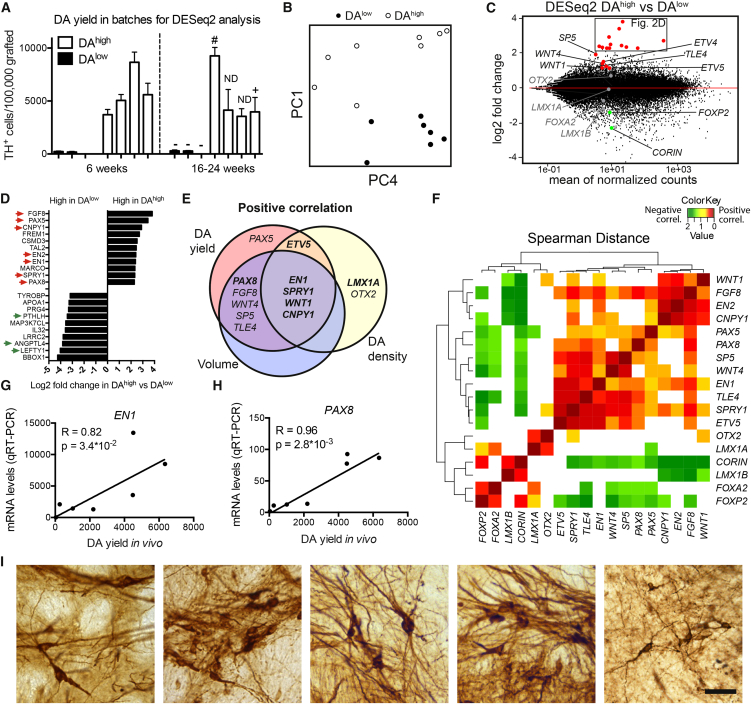
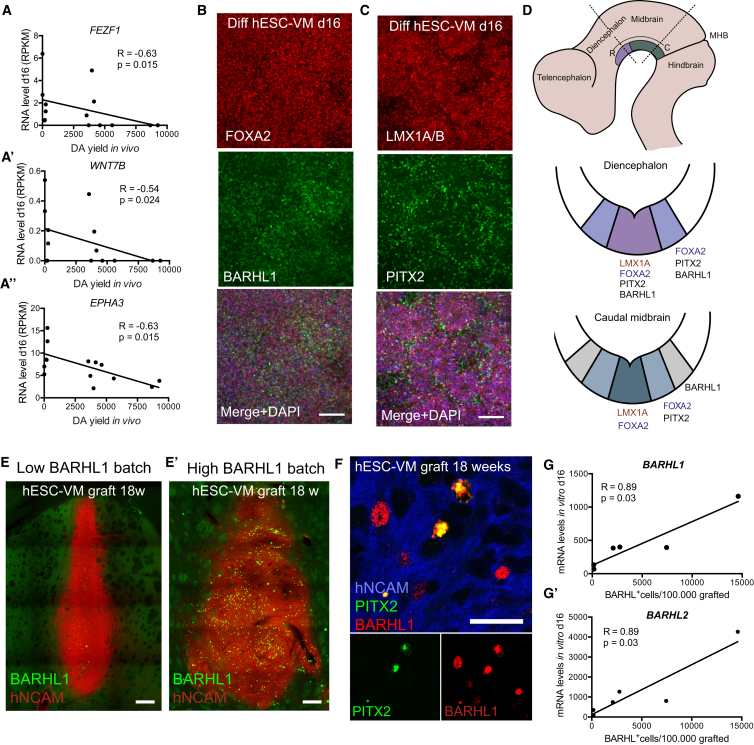
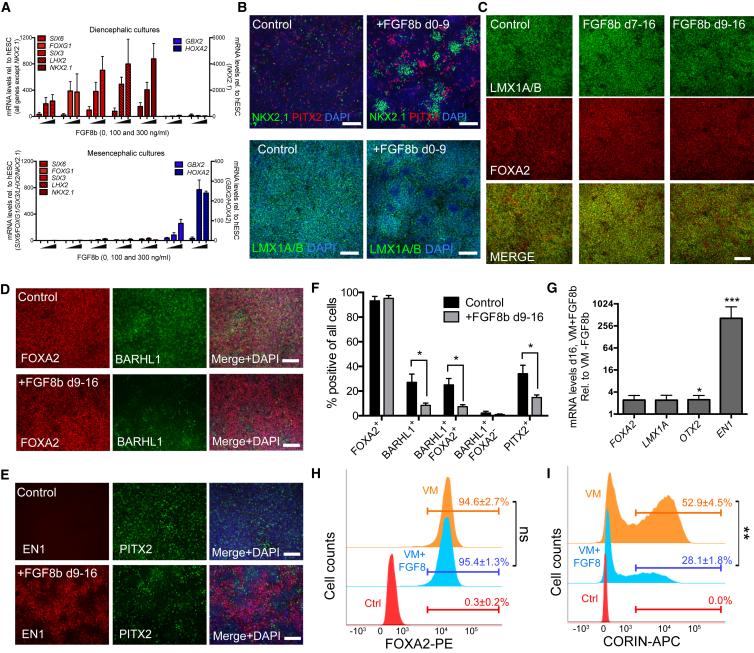
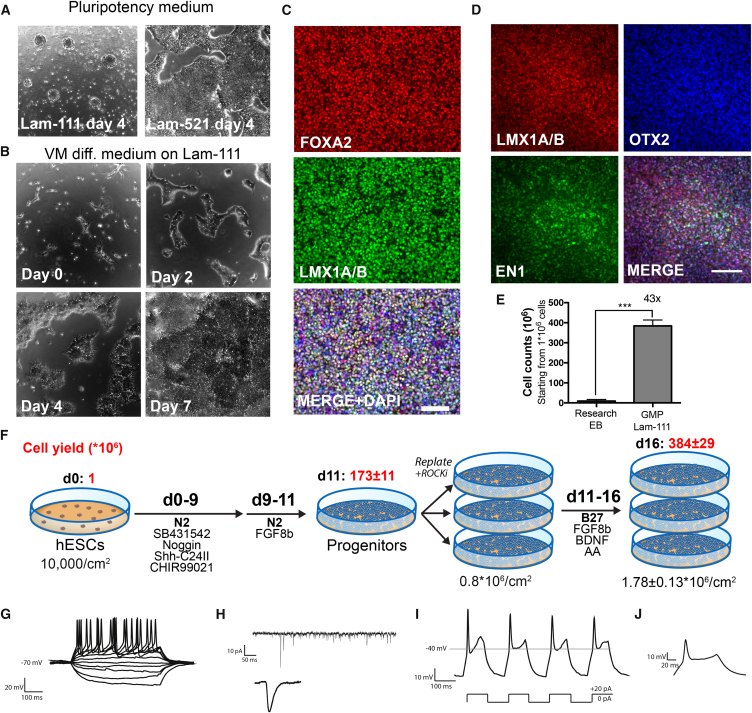
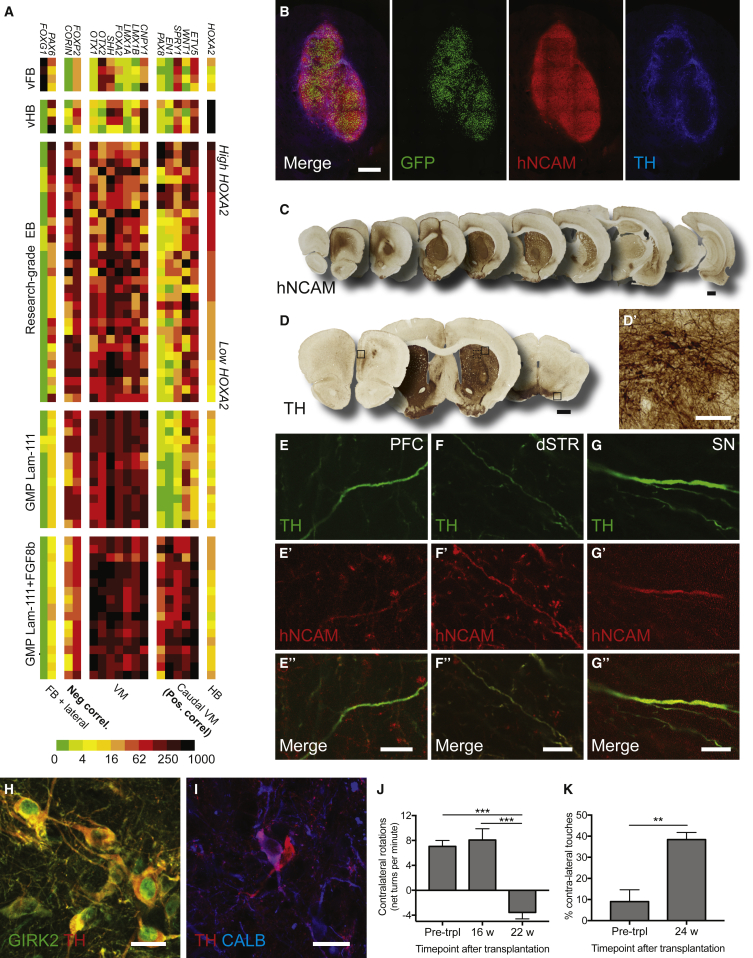
Stem cell treatments for neurodegenerative diseases are expected to reach clinical trials soon. Most of the approaches currently under development involve transplantation of immature progenitors that subsequently undergo phenotypic and functional maturation in vivo, and predicting the long-term graft outcome already at the progenitor stage remains a challenge. Here, we took an unbiased approach to identify predictive markers expressed in dopamine neuron progenitors that correlate with graft outcome in an animal model of Parkinson's disease through gene expression analysis of >30 batches of grafted human embryonic stem cell (hESC)-derived progenitors. We found that many of the commonly used markers did not accurately predict in vivo subtype-specific maturation. Instead, we identified a specific set of markers associated with the caudal midbrain that correlate with high dopaminergic yield after transplantation in vivo. Using these markers, we developed a good manufacturing practice (GMP) differentiation protocol for highly efficient and reproducible production of transplantable dopamine progenitors from hESCs.

Keywords: FGF8; GMP; MHB; Parkinson’s disease; STN; VM; diencephalon; dopaminergic neurons; good manufacturing practice; hESCs; human embryonic stem cells; midbrain-hindbrain boundary; subthalamic nucleus; transplantation; ventral midbrain.


Figures

None
Graphical abstract
Figure 1
Figure 1
VM-Patterned Batches of hESCs Result in Variable Transplantation Outcome that Is Not Correlated with Common mesDA Markers (A) We observed a variability in graft size and number of DA neurons after in vivo maturation. Scale bar, 500 μm. (B–D) Quantifications of (B) DA yield in individual animals from each experiment (TH+ cells per 100,000 grafted cells), (C) graft volume in individual animals based on immunostaining for human nuclei normalized to 100,000 grafted cells, and (D) DA density in grafts from individual animals (TH+ cells/mm3). See Table S1 for details on experiments. (E) Schematic summary of study outline. (F–F″) Mean DA yield in each graft experiment plotted versus gene expression of FOXA2, LMX1A, and CORIN in the transplanted cell population on day of transplantation (d16). (G–G″) Mean DA yield in each graft experiment plotted versus gene expression of TH, NR4A2 (NURR1), and DDC (AADC) in the transplanted cell population after 39–45 days of in vitro maturation. Results from Spearman correlation analysis are given as R and p values in each graph and tendencies of correlation are shown by linear regression lines. All mRNA values are shown as fold change relative to undifferentiated hESCs. Bars in (B)–(D) = mean.
Figure 2
Figure 2
RNA-Seq Analysis of Transplanted VM-Patterned Progenitors Reveals a Positive Correlation between DA Yield and Markers of the Caudal VM (A) For unbiased gene expression analysis, graft experiments were divided into DAhigh and DAlow groups based on the total number of TH+ cells in the grafts. DAergic function of the grafts was assessed in grafts with long-term maturation (>16 weeks) through amphetamine-induced rotation (“−”, lack of functional recovery; “+”, functional recovery; ND, not determined) or through functional positron emission tomography (PET) imaging (#). Data are presented as mean ± SEM. (B) PCA plot of results from RNA-seq analysis of d16 cell samples from (A) revealed clustering of DAlow and DAhigh samples on the PC1 axis. (C) Scatter plot showing fold changes of individual genes in the DESeq2 analysis. Selected genes have been color coded and labeled. Red, higher expression in DAhigh samples (adj. p < 0.01); gray, no significant difference; green, higher expression in DAlow samples (adj. p < 0.01). (D) Graph showing the fold changes of the top and bottom differentially expressed genes from the DESeq2 analysis comparing the DAhigh versus DAlow cell batches. Genes related to the MHB and the diencephalic domains are marked by red and green arrows, respectively. (E) Selected gene hits were validated through direct correlation analysis. RNA levels of MHB genes and common VM markers in d16 transplanted cell batches were correlated to graft outcome, and the Venn diagram shows positive correlations defined by Spearman correlation analysis with p < 0.05 toward DA yield, DA density, and graft volume. Correlations verified by qRT-PCR are shown in boldface type. See Figure S1 and Table S2 for a complete dataset. (F) Spearman distance analysis of RNA levels in 29 VM cell batches shows co-regulation of MHB genes, whereas LMX1A, OTX2, FOXA2, and CORIN are uncoupled or negatively coupled to the MHB gene cluster. Color coding labels only statistically significant correlations (p < 0.05). (G and H) An unrelated set of grafting experiments validated the predictive power of key genes EN1 and PAX8 through direct correlation of mRNA levels measured by qRT-PCR of EN1 (G) and PAX8 (H) and DA yield in vivo. Results from Spearman correlation analysis are given as R and p values in each graph and correlations are visualized with linear regression lines. (I) Representative images of TH+ neurons from five different cell batches with high expression of predictive markers reveal mature A9-like morphology of the grafted cells. Scale bar, 50 μm.
Figure 3
Figure 3
VM-Patterned hESC Cultures Contain Cells of Diencephalic STN Identity (A–A″) Negative correlation between RNA levels of the diencephalic markers FEZF1, WNT7B, and EPHA3 in transplanted cells (d16) and DA yield in grafts. (B and C) Immunostainings of VM-patterned hESC cultures (d16) reveal the presence of STN domain fates (BARHL1+/FOXA2+ and PITX2+/LMX1A/B+ cells). See Figure S2 for mature neuronal cultures. (D) Schematic overview of expression domains of PITX2 and BARHL1 in the diencephalic STN region and in lateral midbrain domains based on data in Kee et al. (2016) and Figure S2. (E and E′) Examples of BARHL1+ cell content in grafts derived from cell batches with low (E) or high (E′) BARHL1 RNA levels at the day of transplantation. Images are digitally stitched from multiple high-magnification images. (F) Confocal imaging of 18-week-old grafts showing the presence of BARHL1+/PITX2+ and BARHL1+/PITX2 cells. (G and G′) Graphs showing positive correlations between BARHL1 (G) and BARHL2 (G′) RNA levels at the time of transplantation (qRT-PCR) and the number of BARHL1+ cells in the mature grafts. Results from Spearman correlation analysis are given as R and p values in each graph, and correlations are visualized with linear regression lines (A and G). Scale bars, 100 μm (B and C), 200 μm (E and E′), and 25 μm (F).
Figure 4
Figure 4
Timed Delivery of FGF8b Causes Fate Switch from Diencephalic to Caudal VM Progenitors (A) qRT-PCR analysis (d10) of differentiating hESCs shows that treatment with FGF8b during VM patterning from d0 to d9 induces increased expression of forebrain markers (red) and hindbrain markers (blue) in ventral diencephalic (CHIR = 0.4 uM) and ventral mesencephalic (CHIR = 0.8 uM) cultures, respectively. (B) Immunostainings (d16) reveal patches of PITX2+ and NKX2.1+ cells and patches of LMX1A/B cells in VM cultures treated with FGF8b from d0 to d9. (C) LMX1A/B+/FOXA2+ VM phenotype was maintained in cultures treated with FGF8b from d7 to d16 or d9 to d16. (D–G) d16 cultures treated with FGF8b from d9 to d16 have decreased levels of BARHL1+ cells (D, quantified in F, n = 3) and PITX2+ cells (E, quantified in F, n = 3] and increased expression of EN1 (immunostaining in E and qRT-PCR in G). (H and I) FACS plots of control and VM-patterned cultures with and without FGF8b treatment (d16) show unchanged percentages of FOXA2+ progenitors and (I) decreased percentages of CORIN+ progenitors. (H) and (I) show representative FACS plots with mean % ± SEM of replicate experiments (n = 3). All scale bars, 100 μm. For all bar graphs, data are presented as mean ± SEM.
Figure 5
Figure 5
Differentiation of hESCs on a GMP-Compatible Lam-111 Matrix Produces High Yield of VM Progenitors (A) Culturing of hESCs on Lam-111 in pluripotency medium resulted in detachment and formation of spheres, whereas pluripotent cells efficiently attached to the Lam-521 matrix. (B) Seeding of low-density hESCs on Lam-111 matrix in neural differentiation medium resulted in confluent neuralized cultures after 7 days of differentiation. (C and D) Cells differentiated according to the GMP protocol showed a very high co-expression of LMX1A/B and FOXA2 (C) and of OTX2, LMX1A/B, and EN1 (D) by immunostaining. Scale bars, 100 μm. (E) Comparison of cell yield to research-grade EB-based protocol showed a 43-fold increase in differentiated cell yield from the GMP-adapted Lam-111 protocol (n = 12–20). (F) Schematic overview of GMP differentiation protocol with average cell yields (mean ± SEM) shown in red above when starting from 1 × 106 cells plated at a density of 10,000 cells/cm2 on day 0 (n = 12). (G) Representative trace of action potentials induced with depolarizing current injections from VM-patterned neurons generated using the GMP protocol maturated for 45 days demonstrates physiologically active neurons (n = 11/11). (H) Spontaneous post-synaptic currents indicative of synaptic activity and input (n = 4/6). (I) An example of rebound depolarization after brief membrane depolarization characteristic of dopaminergic phenotype (n = 4/5). (J) Inset showing respective trace from (I) on an expanded scale. Data are presented as mean ± SEM. See Figure S4E for statistics on electrophysiology.
Figure 6
Figure 6
Differentiation of hESCs from GMP-Compatible Protocol Produces VM Progenitors with Reproducibly High Expression of Predictive Markers that Give Rise to Functional DA Neurons In Vivo (A) hESCs differentiated according to either research-grade EB protocol or GMP-grade Lam-111 protocol were assessed for RNA expression by qRT-PCR analysis on d16 of differentiation. Differentiations toward ventral forebrain (vFB) and ventral hindbrain (vHB) were included as controls. Addition of FGF8b to the GMP protocol (d9–d16) induced robust and reproducible induction of caudal VM markers, which we have shown to be predictive of TH-rich grafts. Values are color coded and normalized to the sample with highest expression for each gene ( = 1,000). See Figure S5 for validation of primers. (B) Graft overview of RC17 grafts at 25 weeks post-transplantation to the 6-OHDA-lesioned rat striatum. Transplanted cells are visualized by nuclear GFP expression and are rich in hNCAM and TH. (C, D, and D′) Overview of graft-derived innervation to the host brain (C) and graft-derived TH innervation (D and D′). (E–G″) Double labeling of hNCAM and TH shows graft-derived TH+ fibers in the prefrontal cortex (PFC), dorso-lateral striatum (dSTR), and substantia nigra (SN). (H and I) Many of the graft-derived TH+ neurons co-expressed GIRK2 (H) and few co-expressed CALB (I). (J and K) Grafted animals showed complete reversal of amphetamine-induced rotations at 22 weeks after grafting, n = 8 (J), and reduction of asymmetrical paw use in the cylinder test, n = 8 (K). Data are presented as mean ± SEM. Scale bars, 500 μm (B), 1,000 μm (C and D), 100 μm (D′), 10 μm (E″–G″), and 25 μm (H and I). Images in (B)–(D) are digitally stitched from multiple high-magnification images.

Comment in

References

    1. Arenas E., Denham M., Villaescusa J.C. How to make a midbrain dopaminergic neuron. Development. 2015;142:1918–1936. - PubMed
    1. Barker R.A., Drouin-Ouellet J., Parmar M. Cell-based therapies for Parkinson disease—past insights and future potential. Nat. Rev. Neurol. 2015;11:492–503. - PubMed
    1. Cameron K., Tan R., Schmidt-Heck W., Campos G., Lyall M.J., Wang Y., Lucendo-Villarin B., Szkolnicka D., Bates N., Kimber S.J. Recombinant laminins drive the differentiation and self-organization of hESC-derived hepatocytes. Stem Cell Reports. 2015;5:1250–1262. - PMC - PubMed
    1. Chakradhar S. An eye to the future: researchers debate best path for stem cell-derived therapies. Nat. Med. 2016;22:116–119. - PubMed
    1. Chen Y., Xiong M., Dong Y., Haberman A., Cao J., Liu H., Zhou W., Zhang S.C. Chemical control of grafted human PSC-derived neurons in a mouse model of Parkinson’s disease. Cell Stem Cell. 2016;18:817–826. - PMC - PubMed

MeSH terms