. 2017 Jan 17:7:40814.
doi: 10.1038/srep40814.

Helminth-induced Ly6Chi monocyte-derived alternatively activated macrophages suppress experimental autoimmune encephalomyelitis

Affiliations

Helminth-induced Ly6Chi monocyte-derived alternatively activated macrophages suppress experimental autoimmune encephalomyelitis

Cesar Terrazas et al. Sci Rep. .

Abstract

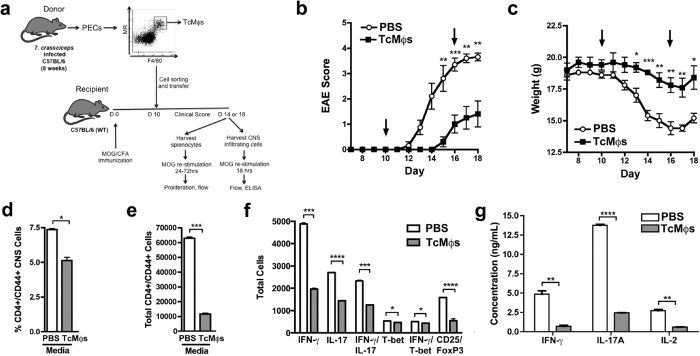
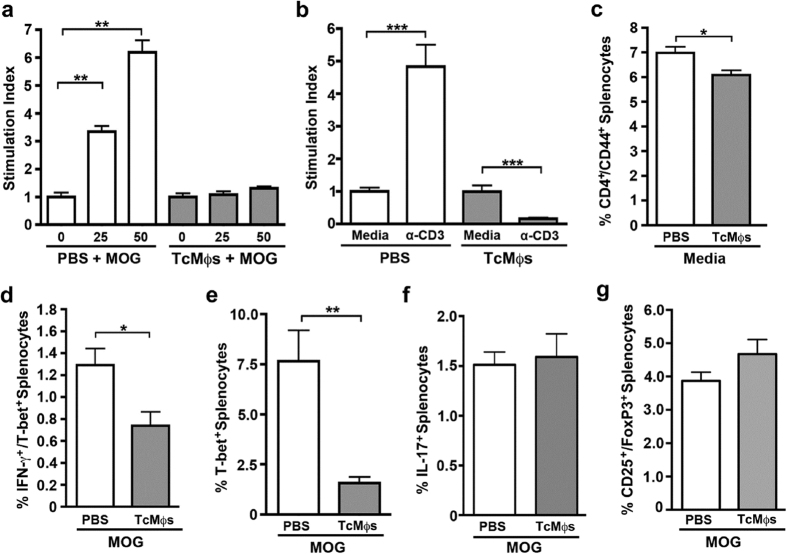
Helminths cause chronic infections and affect the immune response to unrelated inflammatory diseases. Although helminths have been used therapeutically to ameliorate inflammatory conditions, their anti-inflammatory properties are poorly understood. Alternatively activated macrophages (AAMϕs) have been suggested as the anti-inflammatory effector cells during helminth infections. Here, we define the origin of AAMϕs during infection with Taenia crassiceps, and their disease-modulating activity on the Experimental Autoimmune Encephalomyelitis (EAE). Our data show two distinct populations of AAMϕs, based on the expression of PD-L1 and PD-L2 molecules, resulting upon T. crassiceps infection. Adoptive transfer of Ly6C+ monocytes gave rise to PD-L1+/PD-L2+, but not PD-L1+/PD-L2- cells in T. crassiceps-infected mice, demonstrating that the PD-L1+/PD-L2+ subpopulation of AAMϕs originates from blood monocytes. Furthermore, adoptive transfer of PD-L1+/PD-L2+ AAMϕs into EAE induced mice reduced disease incidence, delayed disease onset, and diminished the clinical disability, indicating the critical role of these cells in the regulation of autoimmune disorders.


Figures

Figure 1
Figure 1. Macrophages acquire different phenotypes during T. crassiceps infection.
C57BL/6 WT mice were i.p. infected with 40 metacestodes of T. crassiceps (ORF strain) and euthanized after 2, 4, 8 and 12 weeks. Peritoneal exudate cells were obtained from naïve or infected mice and analyzed for expression of PD-L1, PD-L2 and mannose receptor (MR) by flow cytometry. (a) Representative dot plots of the kinetic of AAMϕs in the peritoneal cavity. (b) Analysis of the absolute numbers of macrophages (CD11b+/F4/80+) after T. crassiceps infection. (c) Total number of PD-L1+/PD-L2 macrophages. (d) Total number of PD-L1+/PD-L2+ macrophages during the course of the infection. Data are representative of 3 independent experiments (n = 3 animals at each time point) and are expressed as mean ± SE.
Figure 2
Figure 2. Heterogeneity of macrophage origin during T. crassiceps infection.
C57BL/6 WT mice or C57BL/6 CX3CR1gfp/+ mice were infected with 40 metacestodes of T. crassiceps and euthanized after 2, 4, 8 and 12 weeks. PECs were recovered and analyzed by flow cytometry. CD11b+/PD-L2+ cells (yellow) were gated and overlaid in dot plots. (a) Representative dot plots of PD-L2, Ly6C, CCR2 and CX3CR1 expression in peritoneal macrophages during the course of infection. (b) Absolute numbers of CX3CR1+/PD-L2+, (c) CCR2+/PD-L2+ macrophages, and Ly6C+/PD-L2+ macrophages (d), after T. crassiceps infection. Data are representative of 3 independent experiments (n = 3 animals at each time point) and are expressed as mean ± SE.
Figure 3
Figure 3. PD-L2+ macrophages require CCR2 expression to accumulate during T. crassiceps infection and are derived from Ly6Chi monocytes.
C57BL/6 WT mice and Ccr2−/− mice were i.p. infected with 40 metacestodes of T. crassiceps, peritoneal cells were obtained after 2, 4, 8 and 12 weeks. The number of macrophages and the expression of PD-L1 and PD-L2 were evaluated by flow cytometry. (a) Representative dot plots of the kinetic of macrophage accumulation in WT or Ccr2−/− infected mice. (b) Dot plots depicting the kinetic of PD-L1 and PD-L2 expression in macrophages (F4/80+CD11b+). (c) Analysis of total PECs in WT or Ccr2−/− mice. (d) Absolut number of macrophages (F4/80+CD11b+), (e) Macrophages expressing PD-L1 and (f) macrophages expressing PD-L1 and PD-L2. Data are representative of 3 independent experiments (n = 3 animals at each time point) and are expressed as mean ± SE. (g) Intravenous adoptive transfer of cell trace labeled Ly6Chi monocytes from bone marrow into naïve or 8 weeks Taenia-infected mice. Five days post-transfer, monocytes were identified as cell trace positive and overlaid in dot plots for the analysis of PD-L1, PD-L2, Ly6C and F4/80 expression. Data representative of 2 independent experiments (n = 2).
Figure 4
Figure 4. Blood-derived macrophages become alternatively activated during T. crassiceps infection and suppress Th1 and Th2 responses in vitro.
Resident F4/80+/CX3CR1 and blood-derived macrophages F4/80+/CX3CR1+ were sorted from 8 wks Taenia-infected mice (a) Evaluation of Arginase1, Chil3 and Retnla expression by qPCR in naïve resident, thioglycollate elicited macrophages, and resident and blood-derived macrophages from Taenia infected mice. Data represents fold change over resident naïve macrophages. (b) Microarray comparison (Log2 transformed data) of 72 h thioglycollate (blue dots) elicited macrophages and blood-derived macrophages (red dots) from 8wks Taenia-infected mice. (c) Heat map of log 2 transformed counts of upregulated or downregulated genes (2 fold, p < 0.05) identified in (b). (d) Biological processes associated with overexpressed genes in Taenia crassiceps-blood-derived macrophages using DAVID database. (e) Network of most downregulated and upregulated genes in Taenia crassiceps blood-derived macrophages vs thioglycollate macrophages and its association with IL-4 generated in Ingenuity pathway software. Red upregulated genes, green downregulated genes, Orange and blue arrows represent predicted activation or inhibition, respectively. (f) Naïve splenocytes were stimulated with anti CD3/CD28 and co-cultured with sorted blood-derived macrophages from Taenia-infected mice. (f) Proliferation of CD4+ cells evaluated by CFSE dilution after 72 h. (g) Cytokine production in macrophages/T cell co-cultures. In (a–c) macrophages were pooled from three mice and data represent two replicates. In (f,g) data are representative of one of two independent experiments using two replicates. Significance was calculated using t-test. *p < 0.05, **p < 0.01, ***p < 0.001.
Figure 5
Figure 5. PD-L2+ macrophages from T. crassiceps-infected mice regulate the course of EAE.
(a) Diagram of experimental design (mouse drawing adapted from ©Motifolio, Inc). (b,c) Mice were injected with CFA/MOG35–55 followed by pertussis toxin 2 and 24 hours later to induce EAE in 11-week female B6 mice. They were subsequently injected with PBS or macrophages isolated from mice infected with Taenia crassiceps on days 10 and 16 (arrows). The plots from one experiment are representative of two independent experiments. (b) EAE scores are shown as mean +/−SEM (see Table 1 for a more detailed analysis). (c) Mouse weights are measured in grams and shown as mean +/−SEM. (D-F) Cells were isolated from the brain and spinal cord of mice, treated with vehicle control or MOG35–55 peptide at 25 μg/mL, and processed for flow cytometry. (d) Percentage and (e) total number of CD4+/CD44+ cells found in the CNS. (f) Isolated cells from CNS were treated with MOG and gated on CD4+/CD44+ cells (IFN-γ, IL-17, IFN-γ/IL-17, T-bet, IFN-γ/T-bet) or CD25+/FoxP3+ cells (Tregs) and total number of IFN-γ+, IL-17+, IFN-γ+/IL-17+, T-bet+, IFN-γ+/T-bet+, or CD25+/FoxP3+ are shown. (g) Concentration of IFN-γ, IL-17A or IL-2 measured by ELISA. Significance was calculated using t-test. *p < 0.05, **p < 0.01, ***p < 0.001, ****p < 0.0001.
Figure 6
Figure 6. PD-L2+ T. crassiceps macrophages suppress the pathogenic T cell response in spleen.
(a) Splenocytes from mice injected with either PBS or PD-L2+ macrophages (Tc-Mϕs) were treated with media containing vehicle control or with increasing concentrations of MOG35–55 peptide (25 and 50 μg/ml) and proliferation was measured by 3H-thymidine incorporation. (b) Splenocytes from EAE mice injected with either PBS as a control or Taenia crassiceps-sorted macrophages were plated with media alone or on anti-mouse CD3 coated plates and proliferation was measured by 3H-thymidine incorporation. Stimulation index is the cpm for MOG or anti-CD3 concentrations divided by cpm for media alone. (c–f) Splenocytes were analyzed by flow cytometry and CD4+/CD44+ cells were gated on to identify activated CD4+ helper T cells (c). The CD4+/CD44+ population was examined to identify the percentage of IFN-γ+/T-bet+ cells (d), T-bet+ cells (E), IL-17+ cells (f) and CD25+/FoxP3+ cells (g). Significance was calculated using ANOVA (a) or t-test (b–f). The p value was indicated as follows: *p < 0.05, **p < 0.01, ***p < 0.001.

References

    1. Martinez F. O. & Gordon S. The M1 and M2 paradigm of macrophage activation: time for reassessment. F1000Prime Rep 6 (2014). - PMC - PubMed
    1. Jablonski K. A. et al.. Novel Markers to Delineate Murine M1 and M2 Macrophages. PLoS One 10, e0145342 (2015). - PMC - PubMed
    1. Murray P. J. et al.. Macrophage Activation and Polarization: Nomenclature and Experimental Guidelines. Immunity 41, 14–20 (2014). - PMC - PubMed
    1. Ginhoux F., Schultze J. L., Murray P. J., Ochando J. & Biswas S. K. New insights into the multidimensional concept of macrophage ontogeny, activation and function. Nat. Immunol. 17, 34–40 (2016). - PubMed
    1. Hoeffel G. et al.. C-Myb(+) erythro-myeloid progenitor-derived fetal monocytes give rise to adult tissue-resident macrophages. Immunity 42, 665–78 (2015). - PMC - PubMed

Publication types

MeSH terms