. 2017 Jan 17:7:40633.
doi: 10.1038/srep40633.

A novel spontaneous model of epithelial-mesenchymal transition (EMT) using a primary prostate cancer derived cell line demonstrating distinct stem-like characteristics

Affiliations

A novel spontaneous model of epithelial-mesenchymal transition (EMT) using a primary prostate cancer derived cell line demonstrating distinct stem-like characteristics

Naomi Harner-Foreman et al. Sci Rep. .

Abstract

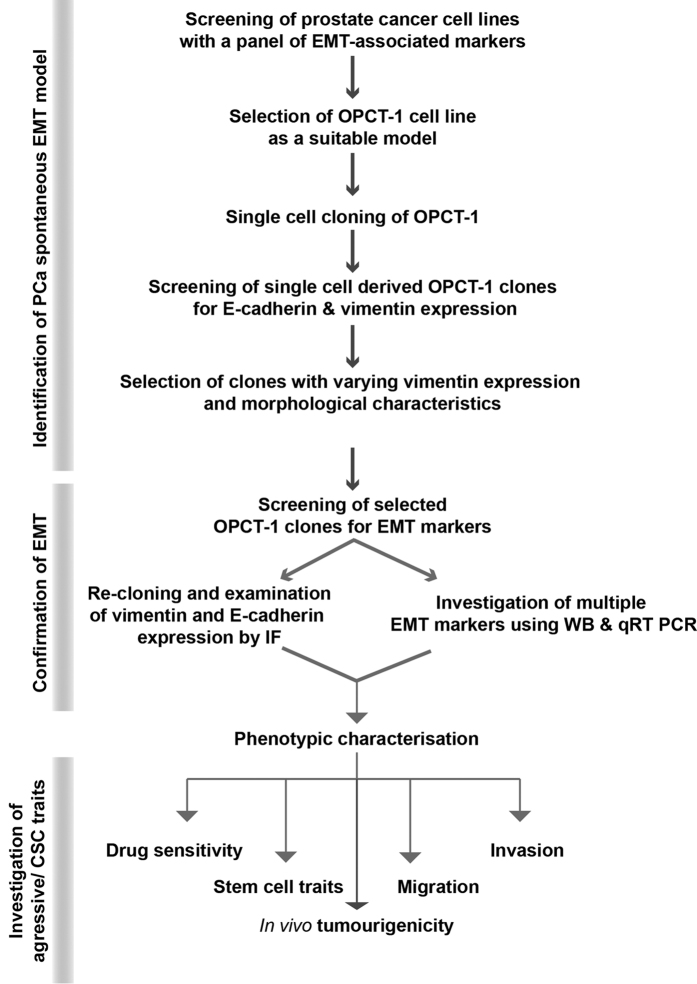
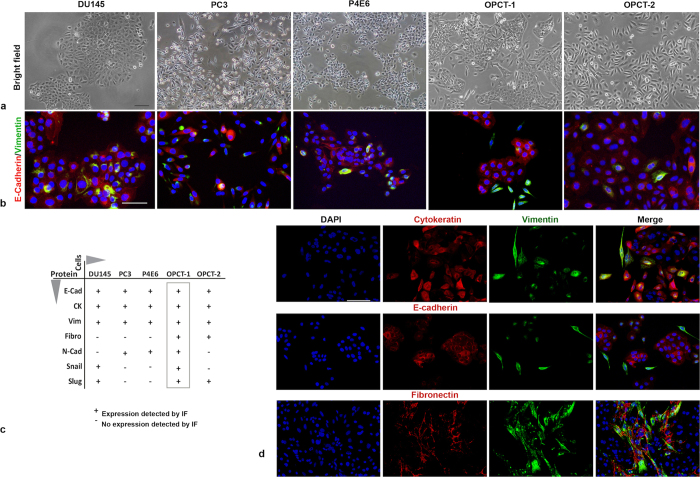
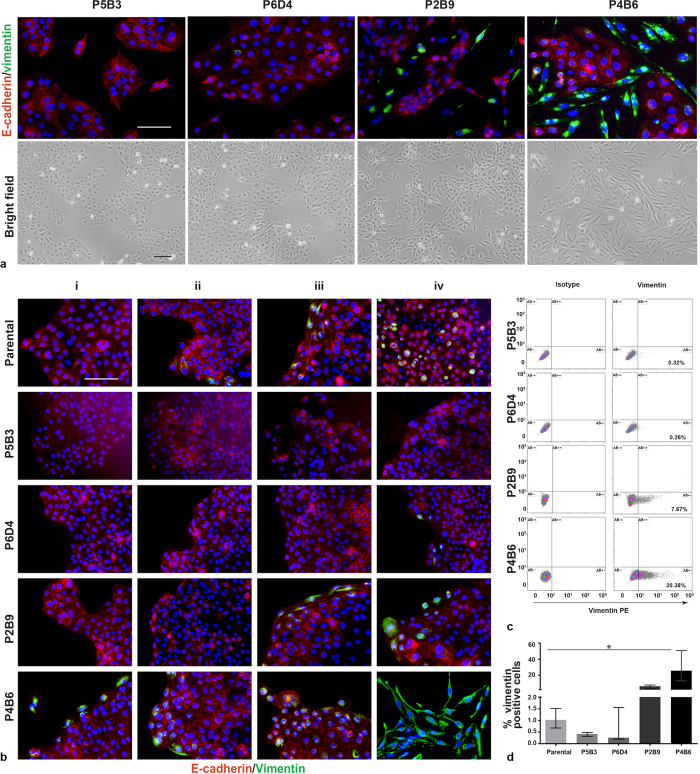
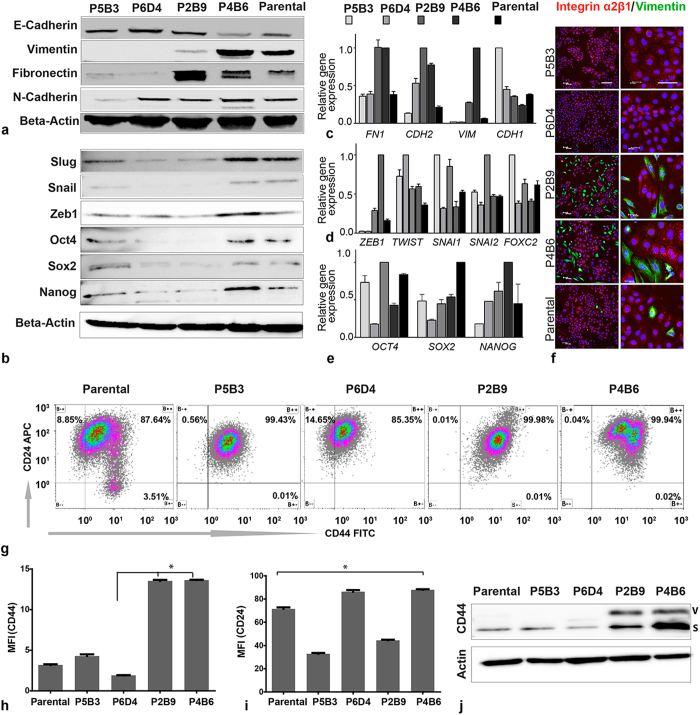
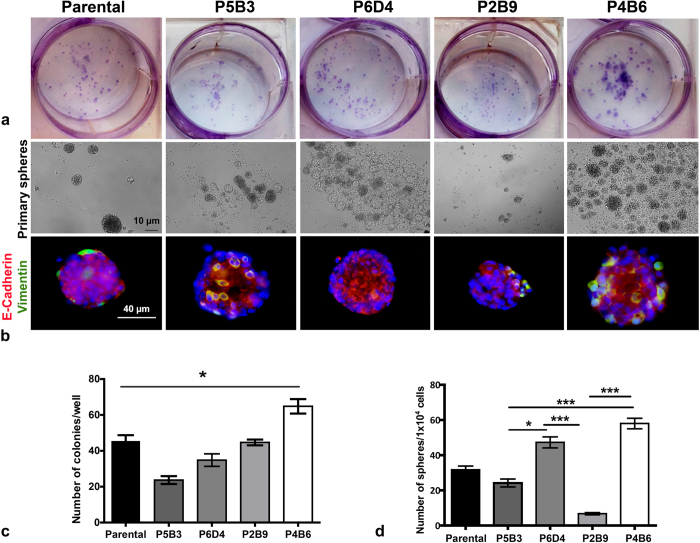
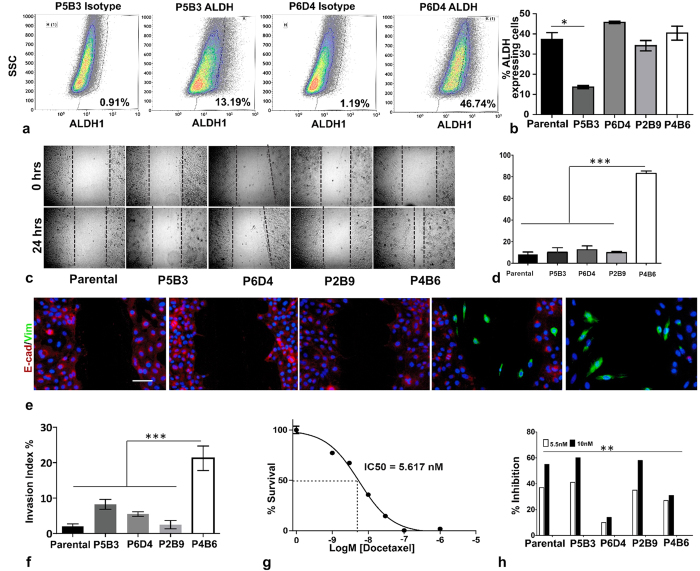
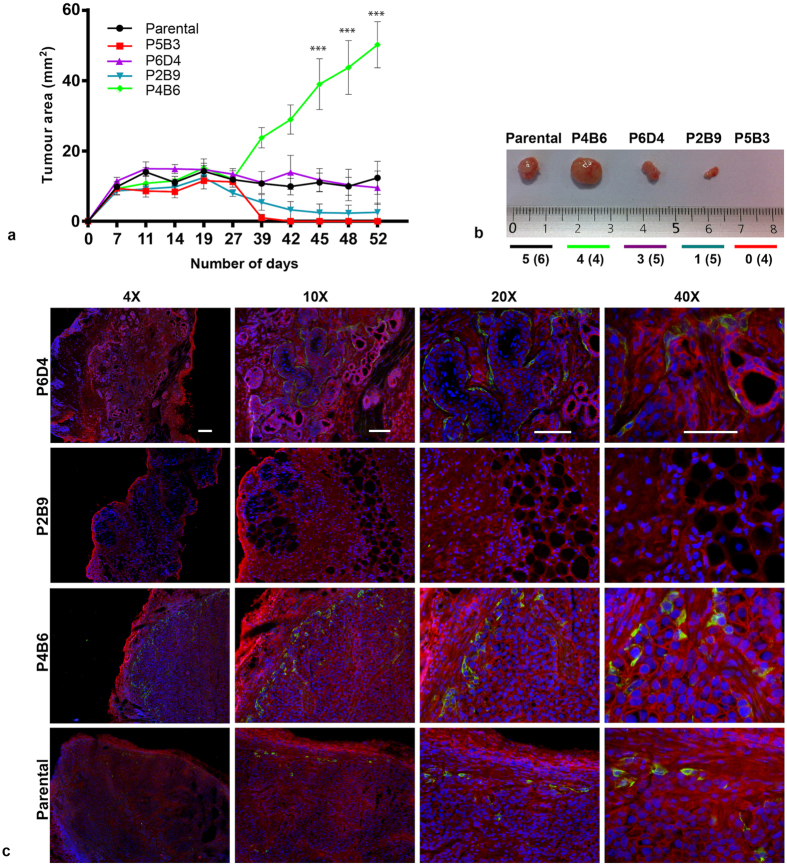
Cells acquire the invasive and migratory properties necessary for the invasion-metastasis cascade and the establishment of aggressive, metastatic disease by reactivating a latent embryonic programme: epithelial-to-mesenchymal transition (EMT). Herein, we report the development of a new, spontaneous model of EMT which involves four phenotypically distinct clones derived from a primary tumour-derived human prostate cancer cell line (OPCT-1), and its use to explore relationships between EMT and the generation of cancer stem cells (CSCs) in prostate cancer. Expression of epithelial (E-cadherin) and mesenchymal markers (vimentin, fibronectin) revealed that two of the four clones were incapable of spontaneously activating EMT, whereas the others contained large populations of EMT-derived, vimentin-positive cells having spindle-like morphology. One of the two EMT-positive clones exhibited aggressive and stem cell-like characteristics, whereas the other was non-aggressive and showed no stem cell phenotype. One of the two EMT-negative clones exhibited aggressive stem cell-like properties, whereas the other was the least aggressive of all clones. These findings demonstrate the existence of distinct, aggressive CSC-like populations in prostate cancer, but, importantly, that not all cells having a potential for EMT exhibit stem cell-like properties. This unique model can be used to further interrogate the biology of EMT in prostate cancer.


Figures

Figure 1
Figure 1. Flow chart demonstrating the steps involved in the identification of a prostate cancer cell line with non-exogenously induced EMT events, followed by the generation and interrogation of a model to investigate the relationship between EMT and CSCs in human prostate cancer.
Figure 2
Figure 2. Identification of OPCT-1 as a suitable model for the study of spontaneous EMT in prostate cancer.
(a) Bright field images of human prostate cancer cell lines derived from metastatic lesions: DU145 and PC3, and primary tissues: P4E6, OPCT-1 and OPCT-2 (Image magnification at x10). (b) Dual immunofluorescent staining of DU145, PC3, P4E6, OPCT-1 and OPCT-2 using antibodies against E-cadherin (red) and vimentin (green) (n = 3). (c) Table summarising the results of the IF screening of DU145, PC3, P4E6, OPCT-1 and OPCT-2 cells for the expression of several EMT-associated markers. (d) Summary composite of OPCT-1 stained with common markers used to investigate EMT: Cytokeratin pan/vimentin, E-cadherin/vimentin, fibronectin/vimentin. Scale bar: 50 μM.
Figure 3
Figure 3
(a) Representative bright field images of four OPCT-1 clones of interest; P5B3, P6D4, P2B9 and P4B6 and their corresponding dual immunofluorescent (IF) staining profile using antibodies against E-cadherin (red) and vimentin (green). Nuclear staining (blue) was achieved using mounting media with DAPI. (n = 3). (b) Dual immunofluorescent staining of re-cloned clones P5B3, P6D4, P2B9, P4B6 and parental OPCT-1. Column i–iv are the representative images of separate wells from across the three assays. Scale bar: 50 μM. (c) Representative flow cytometric data of vimentin-positive cells present in each of the clones and parental OPCT-1, % of vimentin-positive cells are given in the bottom right quadrant. Intracellular staining of vimentin was achieved using mouse anti-human vimentin-PE and mouse IgG1k-PE isotype control antibody was used as a staining control. (d) Bar graph showing the percentage of vimentin-positive cells, each bar represents % median expression and the error bars represent the interquartile range. Significant differences were calculated, using the non-parametric Kruskal Wallis test (p = 0.0048; Kruskal Wallis statistic <14.94; df = 4.) (n = 4).
Figure 4
Figure 4
(a,b) Representative Western blot images of selected EMT and cancer stem cell associated marker expression by clones P5B3, P6D4, P2B9, P4B6 and parental OPCT-1 (n = 5). Beta-actin was used as a loading control in each set of the experiments. (c) Relative gene expression of common EMT associated marker genes fibronectin, E-cadherin, vimentin and N-cadherin (n = 3). (d) Quantitative gene expression analysis of common EMT transcription factors ZEB1, TWIST, SNAI1, SNAI2 and FOXC2. (e) Quantitative gene expression analysis of embryonic stem cell genes NANOG, OCT4 and SOX2. Real-time PCR values were normalised to the housekeeping gene HPRT (n = 3), expression of each gene was normalised to its highest expressing sample among the five genotypes studied. Each bar represents the mean of three independent experiments and the error bars represent the standard deviation. (f) Dual immunofluorescence staining of vimentin (green) and integrin α2β1 (red) in parental and all clonal progenies at two magnifications 10× (left column) and 20× (right column). Scale bar: 50 μM. (g) Dot plot showing the flow cytometry surface staining of CD44 and CD24 molecules on parental and clonal progenies of OPCT-1. (h) Staining intensity of CD44 assessed by mean fluorescence (n = 4). (i) Staining intensity of CD24 assessed by mean fluorescence (n = 4). (j) Western blot image showing expression of CD44 v & s variants. Unprocessed original scans of the blots are shown in Supplementary Figure 9.
Figure 5
Figure 5. Assessment of stem cell characteristics of OPCT-1 clonal progenies.
(a) Representative images of the colonies. Cells were plated at clonal density, cultured for a period of 10 days, fixed with ethanol and stained with crystal violet prior to enumerating the colonies. (b) Representative bright field and immunofluorescence images from the sphere-forming assay performed on clones P5B3, P6D4, P2B9, P4B6 and parental OPCT-1. Cells were plated in ultra-low adherent 24-well plates at clonal density in normal medium, and cultured over a period of 12 days (n = 3). Scale bar: 50 μM. (c) Bar graph showing the number of colonies obtained from parental and each of the OPCT-1 clones, each bar represent the mean ± SEM. Significant differences were calculated by the nonparametric Friedman test. (p = 0.0003, Friedman Statistic < 21.01, df = 4). (d) Bar graph showing number of primary sphere-formation., each bar represents the mean of three assays and the error bars represent the SEM. Significant differences were calculated by the non-parametric Kruskal-Wallis test. (p = 0.0001, Kruskal-Wallis statistic < 54.60, df = 4), Dunn’s multiple comparison test was used for pairwise comparisons. the number of cells seeded in each assay is indicated on the Y axis.
Figure 6
Figure 6
(a) The results of the Aldefluor assay, with representative flow cytometric data from which the percentage of ALDH1hi cells present in each of the clones and parental OPCT-1 was determined. Representative data showing the least and the most ALDH1 activity as a density dot-plot. Side scatter is represented on the Y-axis and ALDH1 staining is represented on the X-axis. Representative isotype control staining is also given (n = 3). (b) Percentge of ALDH1 high cells in parental and clonal progenies of OPCT-1. Data presented as median ± interquartile range. Significant differences were calculated by the nonparametric Kruskal-Wallis test (p = 0.0244, Kruskal-Wallis statistic = 12.89, df = 4 n = 4). (c) Representative images from the in vitro scratch assay showing wound closure after 24 h of wounding. (d) Percentage of wound closure after 24 h represented as bar graph. (e) Dual immunofluorescent staining was used to determine the phenotype of migratory cells, E-cadherin (red) and vimentin (green). Scale bar: 50 μM. (f) Results of the Matrigel invasion assay. Data are presented as the median ± interquartile range. Significant differences were calculated by the nonparametric Friedman test. (p = 0.0024, Friedman statistic = 18.49 n = 3). (g) Dose response curve of parental OPCT-1 cell line to docetaxel measured using the thymidine proliferation assay. The cell line was treated with a range of concentrations of docetaxel to reveal a dose-dependent growth response. The IC50 concentration of the drug was calculated using GraphPad Prism software (n = 3). The y-axis represents the normalised drug response, the x-axis represents the drug concentration used in Log molar scale. The calculated IC50 (5.62 nM) is given on the graph. (h) Bar graph demonstrating the proliferation of the OPCT-1 clones and parental OPCT-1 treated with control media, the docetaxel IC50 dose (5.5 nM) and double the docetaxel IC50 dose (11 nM) of parental OPCT-1, assessed using the thymidine proliferation assay. Data were analysed by means of a Factorial ANOVA using STATSTICA software (p = 0.014715, F < 2.318, n = 5).
Figure 7
Figure 7
(a) In vivo tumourigenesis assay. Clones P5B3, P6D4, P2B9, P4B6 and parental OPCT-1 were injected subcutaneously into the right flanks of male athymic nude mice (6 animals per cell line). Tumour growth was monitored using calliper measurements and mice were euthanised once one of the tumours reached 1 cm in diameter. Data are presented as the mean tumour area ± SD. Statistical significance was calculated using the Student’s t-test (significance indicated as asterisks). (b) Representative tumours excised from tumour-bearing mice arranged in descending order of the clones’ in vitro vimentin positivity. (c) Immunofluorescent staining of tumour sections derived from clones P5B3, P6D4, P2B9, P4B6 and parental OPCT-1 for E-cadherin (red) and vimentin (green) expression. Representative images. (×10, ×20 and ×40 magnification, n = 3). Scale bar: 50 μM.

References

    1. Al-Hajj M., Wicha M. S., Benito-Hernandez A., Morrison S. J. & Clarke M. F. Prospective identification of tumorigenic breast cancer cells. Proceedings of the National Academy of Sciences 100, 3983–3988 (2003). - PMC - PubMed
    1. Jordan C. T. Cancer Stem Cells: Controversial or Just Misunderstood? Cell Stem Cell 4, 203–205 (2009). - PMC - PubMed
    1. Singh A. K. et al. Tumor heterogeneity and cancer stem cell paradigm: Updates in concept, controversies and clinical relevance. Int. J. Cancer 136, 1991–2000 (2014). - PubMed
    1. Calabrese C. et al. A Perivascular Niche for Brain Tumor Stem Cells. Cancer Cell 11, 69–82 (2007). - PubMed
    1. Vermeulen L. et al. Single-cell cloning of colon cancer stem cells reveals a multi-lineage differentiation capacity. Proceedings of the National Academy of Sciences 105, 13427–13432 (2008). - PMC - PubMed

Publication types

MeSH terms