. 2017 Jan 17:7:39102.
doi: 10.1038/srep39102.

Diversity and carbon storage across the tropical forest biome

Martin J P Sullivan  1 Joey Talbot  1 Simon L Lewis  1   2 Oliver L Phillips  1 Lan Qie  1 Serge K Begne  1   3 Jerôme Chave  4 Aida Cuni-Sanchez  2 Wannes Hubau  1 Gabriela Lopez-Gonzalez  1 Lera Miles  5 Abel Monteagudo-Mendoza  6   7 Bonaventure Sonké  3 Terry Sunderland  8   9 Hans Ter Steege  10   11 Lee J T White  12   13   14 Kofi Affum-Baffoe  15 Shin-Ichiro Aiba  16 Everton Cristo de Almeida  17 Edmar Almeida de Oliveira  18 Patricia Alvarez-Loayza  19 Esteban Álvarez Dávila  20 Ana Andrade  21 Luiz E O C Aragão  22 Peter Ashton  23 Gerardo A Aymard C  24 Timothy R Baker  1 Michael Balinga  25 Lindsay F Banin  26 Christopher Baraloto  27 Jean-Francois Bastin  28   29 Nicholas Berry  30 Jan Bogaert  31 Damien Bonal  32 Frans Bongers  33 Roel Brienen  1 José Luís C Camargo  34 Carlos Cerón  35 Victor Chama Moscoso  7 Eric Chezeaux  36 Connie J Clark  37 Álvaro Cogollo Pacheco  38 James A Comiskey  39   40 Fernando Cornejo Valverde  41 Eurídice N Honorio Coronado  42 Greta Dargie  1 Stuart J Davies  43 Charles De Canniere  44 Marie Noel Djuikouo K  45 Jean-Louis Doucet  46 Terry L Erwin  40 Javier Silva Espejo  7 Corneille E N Ewango  47   48 Sophie Fauset  1   49 Ted R Feldpausch  22 Rafael Herrera  50   51 Martin Gilpin  1 Emanuel Gloor  1 Jefferson S Hall  52 David J Harris  53 Terese B Hart  54   55 Kuswata Kartawinata  56   57 Lip Khoon Kho  58 Kanehiro Kitayama  59 Susan G W Laurance  60 William F Laurance  60 Miguel E Leal  61 Thomas Lovejoy  62 Jon C Lovett  1 Faustin Mpanya Lukasu  63 Jean-Remy Makana  47 Yadvinder Malhi  64 Leandro Maracahipes  65 Beatriz S Marimon  18 Ben Hur Marimon Junior  18 Andrew R Marshall  66   67 Paulo S Morandi  18 John Tshibamba Mukendi  63 Jaques Mukinzi  47   68 Reuben Nilus  69 Percy Núñez Vargas  7 Nadir C Pallqui Camacho  7 Guido Pardo  70 Marielos Peña-Claros  33   71 Pascal Pétronelli  72 Georgia C Pickavance  1 Axel Dalberg Poulsen  73 John R Poulsen  37 Richard B Primack  74 Hari Priyadi  8   75 Carlos A Quesada  21 Jan Reitsma  76 Maxime Réjou-Méchain  4 Zorayda Restrepo  77 Ervan Rutishauser  78 Kamariah Abu Salim  79 Rafael P Salomão  80 Ismayadi Samsoedin  81 Douglas Sheil  8   82 Rodrigo Sierra  83 Marcos Silveira  84 J W Ferry Slik  78 Lisa Steel  85 Hermann Taedoumg  3 Sylvester Tan  86 John W Terborgh  37 Sean C Thomas  87 Marisol Toledo  71 Peter M Umunay  88 Luis Valenzuela Gamarra  6 Ima Célia Guimarães Vieira  80 Vincent A Vos  70   89 Ophelia Wang  90 Simon Willcock  91   92 Lise Zemagho  3
Affiliations

Diversity and carbon storage across the tropical forest biome

Martin J P Sullivan et al. Sci Rep. .

Abstract

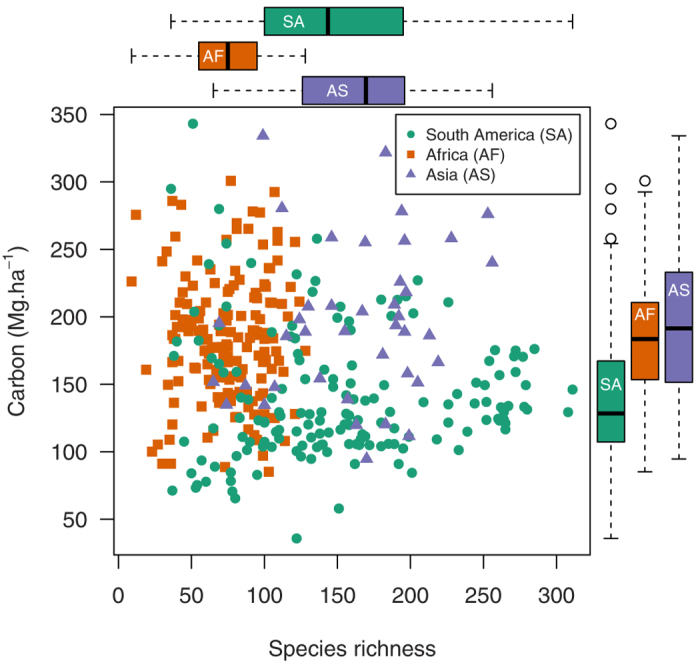
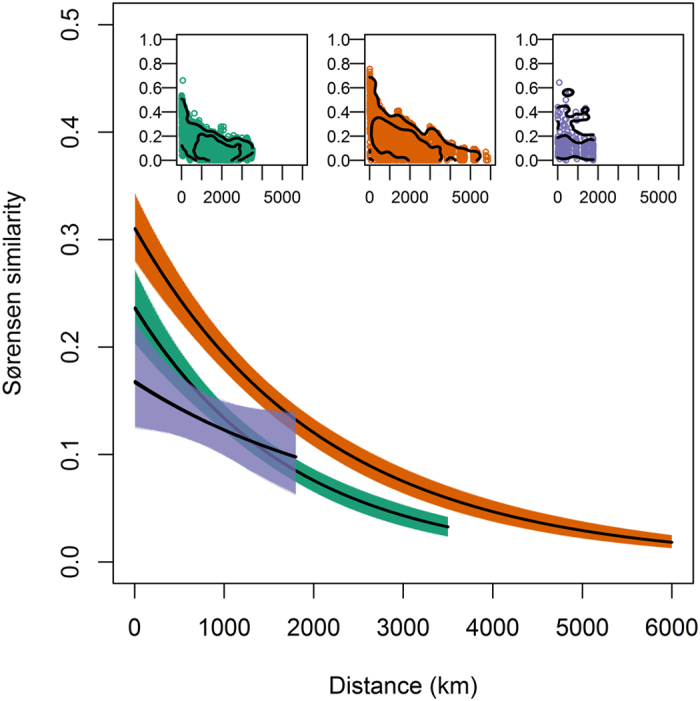
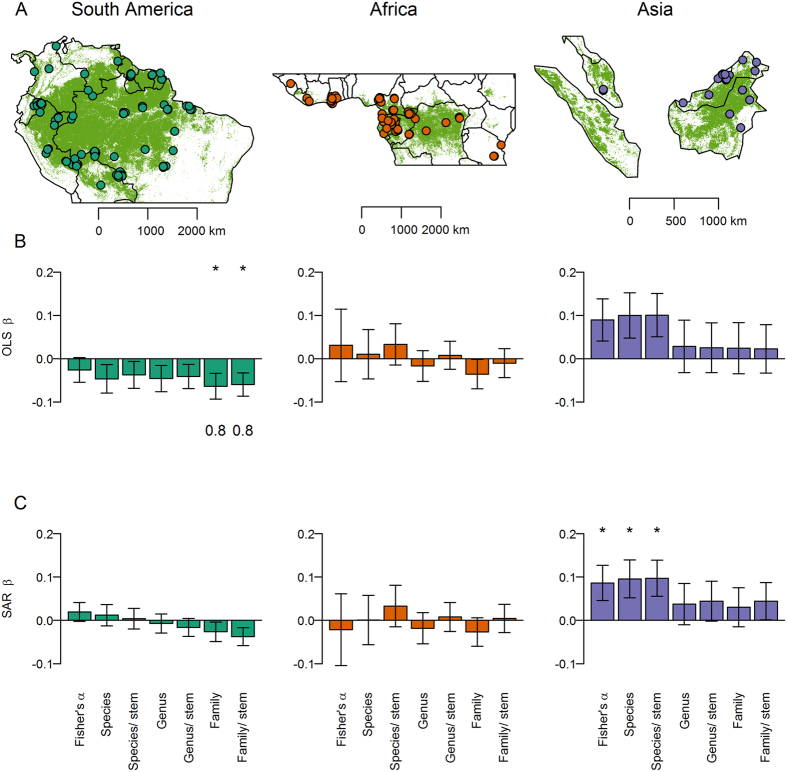
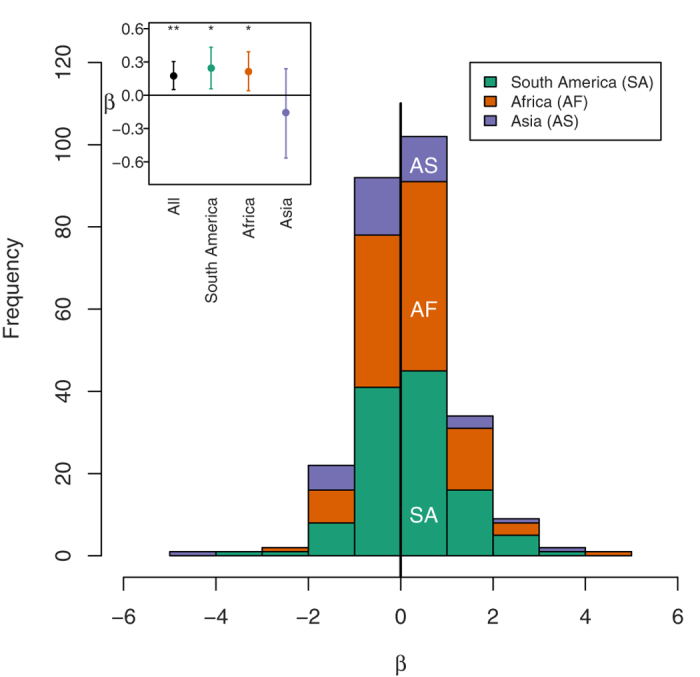
Tropical forests are global centres of biodiversity and carbon storage. Many tropical countries aspire to protect forest to fulfil biodiversity and climate mitigation policy targets, but the conservation strategies needed to achieve these two functions depend critically on the tropical forest tree diversity-carbon storage relationship. Assessing this relationship is challenging due to the scarcity of inventories where carbon stocks in aboveground biomass and species identifications have been simultaneously and robustly quantified. Here, we compile a unique pan-tropical dataset of 360 plots located in structurally intact old-growth closed-canopy forest, surveyed using standardised methods, allowing a multi-scale evaluation of diversity-carbon relationships in tropical forests. Diversity-carbon relationships among all plots at 1 ha scale across the tropics are absent, and within continents are either weak (Asia) or absent (Amazonia, Africa). A weak positive relationship is detectable within 1 ha plots, indicating that diversity effects in tropical forests may be scale dependent. The absence of clear diversity-carbon relationships at scales relevant to conservation planning means that carbon-centred conservation strategies will inevitably miss many high diversity ecosystems. As tropical forests can have any combination of tree diversity and carbon stocks both require explicit consideration when optimising policies to manage tropical carbon and biodiversity.


Figures

Figure 1
Figure 1. No relationship across the tropical forest biome between carbon stocks per unit area and tree species richness.
Green circles = plots in South America (n = 158), orange squares = Africa (n = 162) and purple triangles = Asia (n = 40). Boxplots show variation in species richness and biomass carbon stocks in each continent. Both carbon and species richness differed significantly between continents (Table 2), but no significant correlation exists between carbon and species richness, neither within each continent (τ ≤ 0.132, P ≥ 0.12), nor across all three (linear regression weighted by sampling density in each continent, β < −0.001, t = 0.843, P = 0.4, weights = 1.2 for South America, 0.6 for Africa and 1.8 for Asia). Results for other diversity metrics are similar (Supplementary Fig. S13).
Figure 2
Figure 2. Decay in similarity (Sørensen index) of tree communities with distance in South America (green), Africa (orange) and Asia (purple).
Solid lines show fitted relationships of the form ln(similarity) = α + β × distance + ε. Estimated α and β parameters for each continent are given in Supplementary Fig. S12, ε denotes binomial errors. Differences in the α parameter indicate differences in the similarity of neighbouring stands, while differences in the β parameter indicate differences in the distance decay of tree community similarity. Filled polygons show 95% confidence intervals derived from 10000 bootstrap resamples. Data underlying these relationships are shown in insets, with contours (0.05 and 0.25 quantiles) overlain to show the density of points following kernel smoothing.
Figure 3
Figure 3. Stand-level effect of diversity on carbon stocks per unit area.
(A) Location of clusters of forest inventory plots in South America (n = 158 plots), Africa (n = 162 plots) and Asia (n = 40 plots) (some cluster centroids are not visible due to over plotting). (B & C) Diversity metric coefficients in multiple regressions relating carbon to diversity, climate and soil. Results have been presented for (B) non-spatial (OLS) and (C) simultaneous autoregressive error (SAR) models. Bars show model-averaged parameter estimates, with error bars showing standard errors. Asterisks denote variables that were significant in the average model (P < 0.05), with the summed AICC weights of models in which a variable appears shown beneath bars (where >0.75). Taxa/stem denotes richness estimates per 300 stems. SAR models indicate that increasing species richness by 1 SD (from 86 to 151 species.ha−1) increased carbon by 1.5 Mg.ha−1 in South America, 0.2 Mg.ha−1 in Africa and 15.8 Mg.ha−1 in Asia (note only the relationship in Asia was statistically significant). Green shading in (A) shows the extent of broadleaved evergreen and fresh water regularly flooded forest classes from. Model coefficients are given in Supplementary Table 5. Maps were created in R version 3.02 (http://www.R-project.org/) using base maps from maps package version 2.3–9 (http://CRAN.R-project.org/package=maps).
Figure 4
Figure 4. Variation in the coefficient (β) of the relationship between species richness and carbon among 0.04 ha subplots within 266 1 ha plots.
Coefficients come from multiple regression models also containing the number of stems as a second-order polynomial term to allow for a saturating relationship. Coefficients from plots in South America are shown in green, Africa in orange and Asia in purple. Mean values of coefficients are shown in the inset, with error bars showing 95% confidence intervals derived from 10000 bootstrap resamples (with replacement) of the dataset, with asterisks denoting significant differences from zero (one-sample Wilcoxon test, **P < 0.01, *P < 0.05). Across all plots, doubling species richness in 0.04 ha subplots increased carbon by 6.9%. The horizontal line in the inset and bold vertical line in the main figure show where coefficients = 0. β is in units of ln(Mg.ha−1 carbon) per ln(tree species).

References

    1. Dirzo R. et al.. Defaunation in the Anthropocene. Science 345, 401–406, doi: 10.1126/science.1251817 (2014). - DOI - PubMed
    1. Thomas C. D. et al.. Extinction risk from climate change. Nature 427, 145–148, doi: http://www.nature.com/nature/journal/v427/n6970/suppinfo/nature02121_S1....(2004). - PubMed
    1. ter Steege H. et al.. Estimating the global conservation status of more than 15,000 Amazonian tree species. Science Advances 1, doi: 10.1126/sciadv.1500936 (2015). - DOI - PMC - PubMed
    1. Lewis S. L., Edwards D. P. & Galbraith D. Increasing human dominance of tropical forests. Science 349, 827–832, doi: 10.1126/science.aaa9932 (2015). - DOI - PubMed
    1. Moilanen A. et al.. Prioritizing multiple-use landscapes for conservation: methods for large multi-species planning problems. Vol. 272 (2005). - PMC - PubMed

Publication types