. 2017 Apr;11(4):920-931.
doi: 10.1038/ismej.2016.175. Epub 2017 Jan 17.

Impacts of chemical gradients on microbial community structure

Affiliations

Impacts of chemical gradients on microbial community structure

Jianwei Chen et al. ISME J. 2017 Apr.

Abstract

Succession of redox processes is sometimes assumed to define a basic microbial community structure for ecosystems with oxygen gradients. In this paradigm, aerobic respiration, denitrification, fermentation and sulfate reduction proceed in a thermodynamically determined order, known as the 'redox tower'. Here, we investigated whether redox sorting of microbial processes explains microbial community structure at low-oxygen concentrations. We subjected a diverse microbial community sampled from a coastal marine sediment to 100 days of tidal cycling in a laboratory chemostat. Oxygen gradients (both in space and time) led to the assembly of a microbial community dominated by populations that each performed aerobic and anaerobic metabolism in parallel. This was shown by metagenomics, transcriptomics, proteomics and stable isotope incubations. Effective oxygen consumption combined with the formation of microaggregates sustained the activity of oxygen-sensitive anaerobic enzymes, leading to braiding of unsorted redox processes, within and between populations. Analyses of available metagenomic data sets indicated that the same ecological strategies might also be successful in some natural ecosystems.


Conflict of interest statement

The authors declare no conflict of interest.

Figures
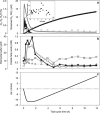
Figure 1
Figure 1
Concentrations of substrates and products during tidal cycling. (a) Concentrations of 15-NO2 (circles) and dissolved O2 (black line showing transient accumulation) in the culture, and headspace concentrations of O2 (gray line), 30N2 (black line showing continuous accumulation) and 46N2O (light gray line) during tidal cycling on day 87. The inset shows the denitrification rate as a function of dissolved oxygen concentration. (b) Concentrations of formate (open squares), elemental sulfur (solid squares), acetate (gray squares) and succinate (triangles) during the same cycle. (c) Cumulative electron balance during the tidal cycle. Δe is the difference between electrons supplied in the form of glucose, acetate and amino acids, and electrons accepted by the supplied nitrate, nitrite and oxygen.
Figure 2
Figure 2
Outcome of microbial community assembly in the chemostat. Abundances in 16S rRNA gene tag libraries of the dominant representative (black areas, 97% identity cut-off) of the five most abundant clades (gray areas, 92% identity cut-off) and number of operational taxonomic units (OTUs) within each clade (black circles, 97% identity cut-off) show selection of clades and of dominant representatives within the clades.
Figure 3
Figure 3
Unraveling of communal metabolism based on gene activities, protein expression and mathematical modeling. (a) Metabolic reactions used for metabolic modeling. (b) Relative population abundances and overall biomass yield for the thermodynamically sorted (reactions ac) and unsorted (reactions dv) scenarios compared with the experimental observations. (c) Selected gene activities and layout of the ‘braided' communal metabolism predicted by the model. Each population (bins A–F) is shown as a node (pink circles) in the network, with arrows showing the conversion of substrates into products by each population. The conversion of the supplied carbon and energy sources is shown from bottom to top and the conversion of the supplied electron acceptors is shown from left to right. Pink arrows show the amount of biomass produced for each population and the amount of storage materials produced, which was not assigned to any specific population. Width of all arrows is proportional to the calculated elemental flows (mmol C, O, N, S per day, horizontal and vertical scale bar in lower left corner). The table shows transcriptome-inferred gene activities of key metabolic modules for the six abundant populations (bins A–F). Bold numbers indicate that expression was detected experimentally by proteomics. Red and blue numbers indicate upregulation in the presence and absence of oxygen, respectively.
Figure 4
Figure 4
Aerobic denitrification by suspended bacteria. (a) Aggregated cells sampled from the culture. (b) Suspended cells obtained by filtration. (c) Production of nitrogen (circles) and nitrous oxide (squares) as a function of oxygen concentration. (d) Inhibition of oxygen consumption after injection of 0.8 mm nitrate (arrow, black line) compared to control (gray line). (e) Inhibition of oxygen consumption as a function of oxygen concentration in the presence (black) and absence (gray) of nitrate. Scale bar, 5 μm.
Figure 5
Figure 5
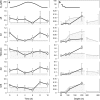
Normalized abundance (shaded areas) and activity (lines) of anaerobic genes in the environment. (a) Oxic marine sediment used as inoculum for the continuous cultures. (b) Chilean oxygen minimum zone (Canfield et al., 2010). bd, bd-type terminal oxidase; dsr, dissimilatory sulfate reductase; HeCuOx, heme-copper oxidases; nirS, cd-type nitrite reductase; pfl, pyruvate formate lyase. Error bars indicate standard deviations.

References

    1. Albert DB, Martens CS. (1997). Determination of low-molecular-weight organic acid concentrations in seawater and pore-water samples via HPLC. Mar Chem 56: 27–37.
    1. Billerbeck M, Werner U, Polerecky L, Walpersdorf E, DeBeer D, Huettel M. (2006). Surficial and deep pore water circulation governs spatial and temporal scales of nutrient recycling in intertidal sand flat sediment. Mar Ecol Prog Ser 326: 61–76.
    1. Bolger AM, Lohse M, Usadel B. (2014). Trimmomatic: a flexible trimmer for Illumina sequence data. Bioinformatics 30: 2114–2120. - PMC - PubMed
    1. Bordel S. (2010). Steepest entropy increase is justified by information theory. the relations between Ziegler's principle, Onsager's formalism and Prigogine's principle. Phys A Stat Mech Appl 389: 4564–4570.
    1. Canfield DE, Steward FJ, Thamdrup B, De Brabandere L, Dalsgaart T, Delong EF et al. (2010). A cryptic sulfur cycle in oxygen-minimum-zone waters off the Chilean coast. Science 330: 1375–1378. - PubMed