. 2017 Feb 8;17(2):652-659.
doi: 10.1021/acs.nanolett.6b03517. Epub 2017 Jan 23.

Noninvasive Targeted Transcranial Neuromodulation via Focused Ultrasound Gated Drug Release from Nanoemulsions

Affiliations

Noninvasive Targeted Transcranial Neuromodulation via Focused Ultrasound Gated Drug Release from Nanoemulsions

Raag D Airan et al. Nano Lett. .

Abstract

Targeted, noninvasive neuromodulation of the brain of an otherwise awake subject could revolutionize both basic and clinical neuroscience. Toward this goal, we have developed nanoparticles that allow noninvasive uncaging of a neuromodulatory drug, in this case the small molecule anesthetic propofol, upon the application of focused ultrasound. These nanoparticles are composed of biodegradable and biocompatible constituents and are activated using sonication parameters that are readily achievable by current clinical transcranial focused ultrasound systems. These particles are potent enough that their activation can silence seizures in an acute rat seizure model. Notably, there is no evidence of brain parenchymal damage or blood-brain barrier opening with their use. Further development of these particles promises noninvasive, focal, and image-guided clinical neuromodulation along a variety of pharmacological axes.

Keywords: Neuromodulation; focused ultrasound; gated drug release; nanoparticles.


Conflict of interest statement

The authors declare the following competing financial interest(s): Dr. Nicholas Ellen has worked in the past as a paid consultant for FUS Instruments, Inc.

Figures

Figure 1
Figure 1
Schematic of focused ultrasound-gated drug delivery nanoparticles’ preparation and use. (A) To produce the propofol-loaded nanoemulsions, first the block copolymer (yellow and blue lines) and drug (red circles) are dissolved into THF, which is followed by a solvent extraction into PBS to produce propofol-loaded polymeric micelles. These micelles then emulsify liquid perfluoropentane (PFP; light blue) through sonication at 20 kHz. (B) In use, the propofol-loaded nanoemulsions with a liquid PFP core are sonicated at a higher frequency such as 1 MHz in these experiments. That sonication induces a liquid to gas phase transition of the PFP which thins the encoated drug-loaded polymer shell, inducing drug release.
Figure 2
Figure 2
Schematic and in vitro characterization of nanoparticles enabling ultrasound-gated release of propofol for targeted neuromodulation. (A) Schematic of in vitro testing apparatus. A PCR tube containing the aqueous particle sample (green) was held at the focal spot of the FUS transducer. A layer of hexane was applied on top of the sample (yellow) to serve as a chemical sink for the released propofol. (B) Sonication induces release of propofol from particles into the medium with a dose response after a threshold peak in situ pressure of 0.5 MPa (left) and after a threshold burst length of 10 ms (right). The response to burst length saturates at 50–100 ms. N = 3–4 samples/group. (C) Histogram of particle sizes assessed by direct particle tracking demonstrates a single nanoscale peak centered at 317.6 ± 148.2 nm (mean ±SD). (D) After 2 h of incubation, particles were tested for release with 1.5 MPa peak in situ pressure and 50 ms burst lengths (N = 4 samples/group). There was intact release ability after incubation, although release efficacy is relatively reduced at room (25 °C) and in vivo (37 °C) temperatures.
Figure 3
Figure 3
Biodistribution and clearance in vivo of the propofol-loaded nanoparticles. (A) Time course of the amount of an initial bolus of particles found in the intravascular space, as assessed by fluorescence of timed whole-blood samples after administration of propofol-loaded particles doped with an infrared fluorescent dye, compared to assessment of the serum fluorescence to determine the unbound dye kinetics. Presented are mean ± SD, normalized by the initial whole-blood sample fluorescence (N = 4 rats). (B) Organ distribution of particle uptake at 24 h (mean ± SD for 4 rats) show that particles are sequestered in expected organs such as liver, spleen, and lung with minimal amounts seen in kidney and heart that may represent blood pool activity. No significant uptake is seen in the brain. Values are presented as their percentage of the total fluorescence across the harvested organs. (C) Sample bright field (left), fluorescence (middle), and bright field/fluorescence merged (right) images for the spleen (S), kidney (K), liver (Li), heart (H), lung (Lu), and brain (B) after harvest from a single rat.
Figure 4
Figure 4
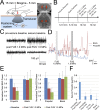
Focused ultrasound-gated propofol release is potent enough to silence seizure activity. (A) Schematic of rat positioning for this demonstration of in vivo efficacy. After removal of the dorsal scalp fur, rats were placed supine on the bed of a focused ultrasound transducer, coupled to the transducer via degassed water (light blue), a Kapton membrane filled with degassed water (orange-brown), and ultrasound gel (not pictured). Rats underwent seizure induction using the chemoconvulsant PTZ. A sonication focus (red ellipse) was developed at one target within each hemisphere, 2.5 mm lateral to midline, and 15 mm caudal to the eye center, which equals ∼5 mm caudal to bregma. Expected location of the two sonication foci are overlaid onto ex vivo MRI images with the red ellipse indicating the fwhm of the sonication focus. (B) Schematic of experiment timing for seizure induction, particle administration, and FUS application. (C) Sample traces of EEG voltage from one rat receiving propofol-loaded particles before and after seizure-induction and focused ultrasound application at the indicated pressures. (D) Total EEG power normalized by baseline averaged across rats receiving particles loaded with either propofol (blue) or no drug (blank, red) across experiment time (N = 7 propofol, 5 blank). Gray bars indicate time of FUS application at the indicated estimated in situ peak pressures in 50 ms bursts applied every 1 s for 60 s. An electrical artifact precluded EEG analysis during FUS applications. (E) Mean ± SD of normalized total (left) and theta band (right) EEG power in the indicated time period across rats receiving propofol-loaded particles or blank particles (N = 7 propofol, 5 blank). Two-way ANOVA across animals receiving both FUS treatments demonstrates significant differences with FUS application (p < 0.01) and with particle content (p < 0.05). Posthoc multiple comparison corrected tests show significant (p < 0.01) differences of EEG power between baseline and each of the post FUS application periods for the propofol particle treated rats only. (F) Mean ± SD of the HPLC-quantified serum propofol concentration of samples from N = 4 rats taken immediately after propofol-loaded particle administration, immediately after sonication, and 10 min post sonication, compared to a blank serum sample. There was no appreciable serum propofol peak for the post sonication samples.
Figure 5
Figure 5
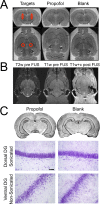
MRI and histological evaluation of brains following focused-ultrasound gated propofol release. (A) Sample whole-brain ex vivo 17.6 T MRI of rats treated with either propofol-loaded particles or blank particles and that underwent the seizure model and FUS application of Figure 4. Red ellipses in the left images indicate the expected location and fwhm of the sonication foci, overlaid onto the “Blank” images. Black spots at the periphery of the brain on the MRI images are microscopic air bubbles that show a susceptibility related blooming artifact. Notably no such findings are present near the expected sonication field to indicate tissue damage due to either particle administration or sonication. (B) The 11.7 T in vivo MRI images taken presonication (T2 and T1 weighted images left and center) and postparticle administration, postsonication, and postcontrast administration (right) show no evidence of parenchymal damage or blood-brain barrier opening due to particle administration and sonication. (C) Cresyl violet histology shows no evidence of parenchymal damage on either wide-field views (top, 4×) or magnified views (bottom, scale bar 40 μm) for either propofol-loaded or blank particle-treated animals that received the full sonication protocol of Figure 4. The more medial dorsal dentate gyrus (DG) was within the sonication trajectory. The more lateral ventral dentate gyrus was not within the sonication trajectory and serves as a negative control for assessment of damage.

References

    1. Jorgenson L. A.; et al. Philos. Trans. R. Soc. London B. Biol. Sci. 2015, 370, 214–222. - PMC - PubMed
    1. Kim H.; Park M. Y.; Lee S. D.; Lee W.; Chiu A.; Yoo S.-S. NeuroReport 2015, 26, 211–215. 10.1097/WNR.0000000000000330. - DOI - PMC - PubMed
    1. King R. L.; Brown J. R.; Newsome W. T.; Pauly K. B. Ultrasound Med. Biol. 2013, 39, 312–331. 10.1016/j.ultrasmedbio.2012.09.009. - DOI - PubMed
    1. King R. L.; Brown J. R.; Pauly K. B. Ultrasound Med. Biol. 2014, 40, 1512–1522. 10.1016/j.ultrasmedbio.2014.01.020. - DOI - PubMed
    1. Legon W.; Sato T. F.; Opitz A.; Mueller J.; Barbour A.; Williams A.; Tyler W. J. Nat. Neurosci. 2014, 17, 322–329. 10.1038/nn.3620. - DOI - PubMed

MeSH terms