. 2017 Mar;29(3):603-642.
doi: 10.1162/NECO_a_00936. Epub 2017 Jan 17.

Interpretation of the Precision Matrix and Its Application in Estimating Sparse Brain Connectivity during Sleep Spindles from Human Electrocorticography Recordings

Affiliations

Interpretation of the Precision Matrix and Its Application in Estimating Sparse Brain Connectivity during Sleep Spindles from Human Electrocorticography Recordings

Anup Das et al. Neural Comput. 2017 Mar.

Abstract

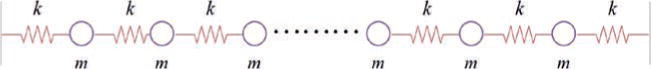
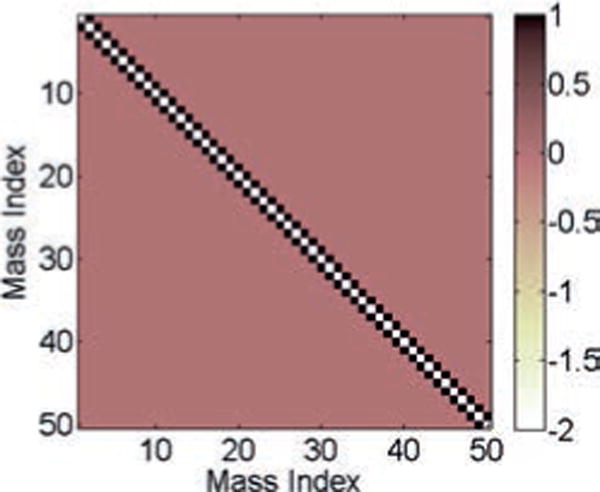
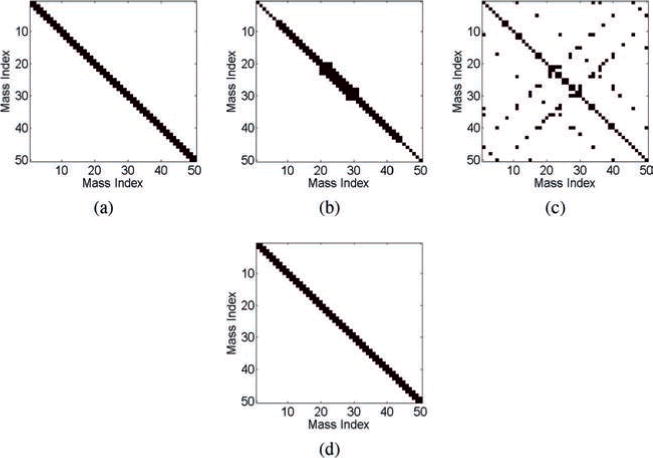
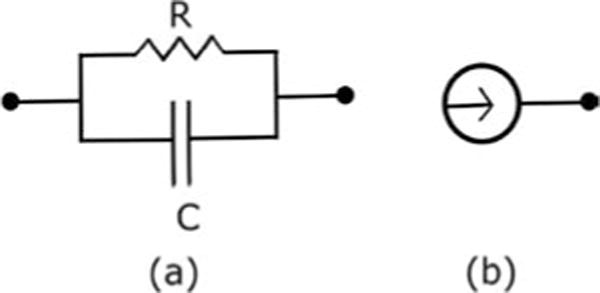
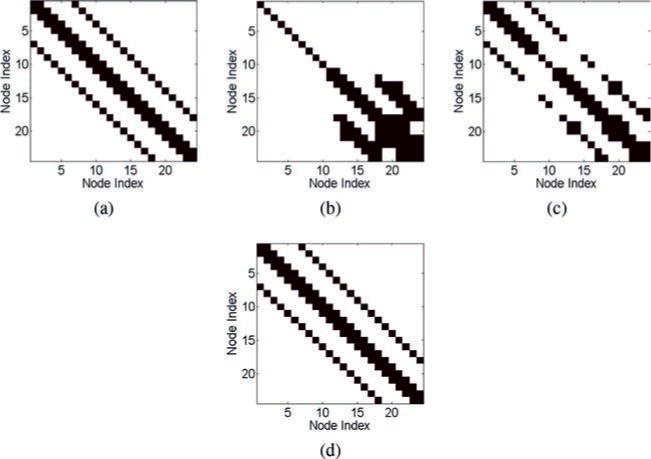
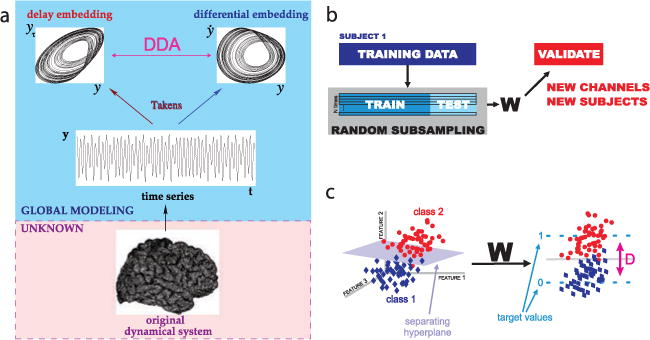
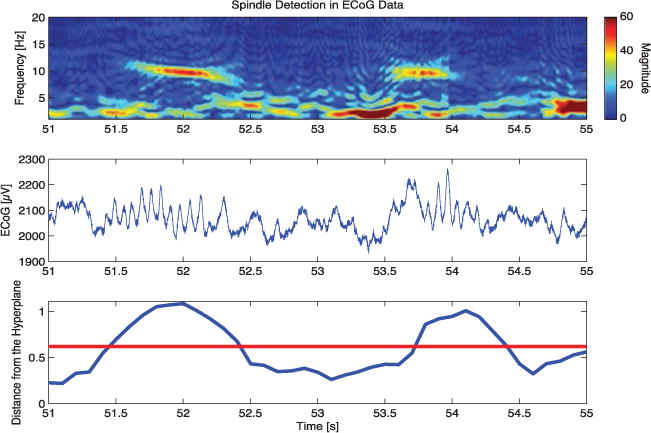
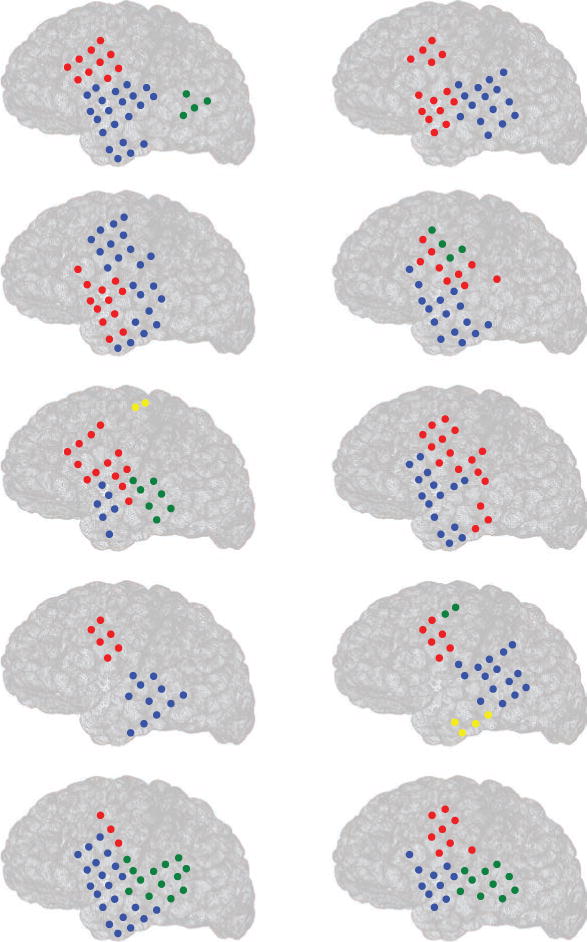
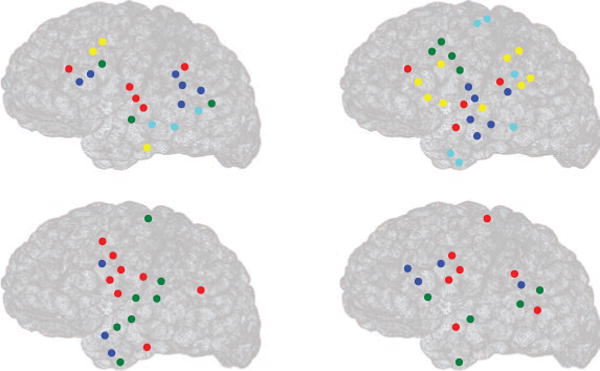
The correlation method from brain imaging has been used to estimate functional connectivity in the human brain. However, brain regions might show very high correlation even when the two regions are not directly connected due to the strong interaction of the two regions with common input from a third region. One previously proposed solution to this problem is to use a sparse regularized inverse covariance matrix or precision matrix (SRPM) assuming that the connectivity structure is sparse. This method yields partial correlations to measure strong direct interactions between pairs of regions while simultaneously removing the influence of the rest of the regions, thus identifying regions that are conditionally independent. To test our methods, we first demonstrated conditions under which the SRPM method could indeed find the true physical connection between a pair of nodes for a spring-mass example and an RC circuit example. The recovery of the connectivity structure using the SRPM method can be explained by energy models using the Boltzmann distribution. We then demonstrated the application of the SRPM method for estimating brain connectivity during stage 2 sleep spindles from human electrocorticography (ECoG) recordings using an [Formula: see text] electrode array. The ECoG recordings that we analyzed were from a 32-year-old male patient with long-standing pharmaco-resistant left temporal lobe complex partial epilepsy. Sleep spindles were automatically detected using delay differential analysis and then analyzed with SRPM and the Louvain method for community detection. We found spatially localized brain networks within and between neighboring cortical areas during spindles, in contrast to the case when sleep spindles were not present.


Figures

Figure 1
Figure 1
The spring-mass model. The black dots denote continuation of springs and masses.
Figure 2
Figure 2
The connectivity matrix or the ground-truth matrix C for the spring-mass model.
Figure 3
Figure 3
Results of the estimation methods for the spring-mass model. (a) The ground-truth matrix. (b) The estimated connection matrix from the correlation method (16% error). (c) The estimated connection matrix from the inverse covariance method (53% error). (d) The estimated connection matrix from the SRPM method (0% error). In panels a–d, black denotes either a diagonal element or a connectivity between two masses via a spring, and white denotes no connectivity.
Figure 4
Figure 4
Elements of the RC circuit model. (a) Parallel RC circuit between a pair of nodes. (b) Thermal current associated with a node.
Figure 5
Figure 5
The tree network.
Figure 6
Figure 6
The connectivity matrix or the ground-truth matrix A (≡ G) for the tree network.
Figure 7
Figure 7
Results of the estimation methods for the tree network in the RC circuit model. (a) The ground-truth matrix. (b) The estimated connection matrix from the correlation method (29% error). (c) The estimated connection matrix from the inverse covariance method (7% error). (d) The estimated connection matrix from the SRPM method (0% error). In panels a–d, black denotes either a diagonal element or a connectivity between two nodes, and white denotes no connectivity.
Figure 8
Figure 8
The mesh network.
Figure 9
Figure 9
The connectivity matrix or the ground-truth matrix A (≡ G) for the mesh network.
Figure 10
Figure 10
Results of the estimation methods for the mesh network in the RC circuit model. (a) The ground-truth matrix. (b) The estimated connection matrix from the correlation method (40% error). (c) The estimated connection matrix from the inverse covariance method (11% error). (d) The estimated connection matrix from the SRPM method (0% error). In panels a–d, black denotes either a diagonal element or a connectivity between two nodes, and white denotes no connectivity.
Figure 11
Figure 11
Delay differential analysis (DDA). (a) For an unknown dynamical system (such as the brain) from which we can record the value of a single variable over time (such as ECoG data), embedding theory states that we can recover the nonlinear invariant properties of the original system. DDA combines delay and differential embeddings in a functional form that allows time-domain classification of the data. (b) Performance of DDA model forms is evaluated with repeated random subsampling cross-validation. The data are repeatedly divided at random into training and testing sets. (c) Applying the weights (set by SVD) to the DDA features transforms from the feature space to a one-dimensional distance from the hyperplane of separation. This value is used as a measure of performance for classification.
Figure 12
Figure 12
DDA spindle detection. The top panel shows a spectrogram of the ECoG data for a 4 second time period in which two sleep spindles are detected. The middle panel shows the same data in the time domain after the application of a 60 Hz notch filter for visualization. The bottom panel shows the spindle detection index from DDA; higher values above the set threshold, in red, correspond to the presence of spindles.
Figure 13
Figure 13
Estimating brain connectivity during sleep spindles from human ECoG data by the SRPM method in 10 epochs from a patient. Circles denote electrode locations, and clusters (of strongest activity) put together by the LMCD have the same color. For example, in the left top panel, there are three clusters of strongest activity denoted by red, blue, and green.
Figure 14
Figure 14
Estimating brain connectivity during absence of spindles from human ECoG data by the SRPM method in 4 epochs from a patient. Circles denote electrode locations, and clusters (of strongest activity) put together by the LMCD have the same color. For example, in the left top panel, there are five clusters of strongest activity, denoted by red, blue, green, yellow, and cyan.

References

    1. Allen EA, Damaraju E, Plis SM, Erhardt EB, Eichele E, Calhoun VD. Tracking whole-brain connectivity dynamics in the resting state. Cerebral Cortex. 2012;24:663–676. - PMC - PubMed
    1. Anand A, Li Y, Wang Y, Wu J, Gao S, Bukhari L, Lowe MJ. Antidepressant effect on connectivity of the mood-regulating circuit: An FMRI study. Neuropsychopharmacology. 2005;30(7):1334–1344. - PubMed
    1. Andrade KC, Spoormaker VI, Dresler M, Wehrle R, Holsboer F, Samann PG, Czisch M. Sleep spindles and hippocampal functional connectivity in human NREM sleep. Journal of Neuroscience. 2011;31(28):10331–10339. - PMC - PubMed
    1. Andrillon T, Nir Y, Staba RJ, Ferrarelli F, Cirelli C, Tononi G, Fried I. Sleep spindles in humans: Insights from intracranial EEG and unit recordings. Journal of Neuroscience. 2011;31(49):17821–17834. - PMC - PubMed
    1. Banerjee O, El Ghaoui L, d’Aspremont A. Model selection through sparse maximum likelihood estimation for multivariate gaussian or binary data. Journal of Machine Learning Research. 2008;9:485–516.

Publication types