. 2017 Jan 17;12(1):e0167810.
doi: 10.1371/journal.pone.0167810. eCollection 2017.

Influences of Host Community Characteristics on Borrelia burgdorferi Infection Prevalence in Blacklegged Ticks

Affiliations

Influences of Host Community Characteristics on Borrelia burgdorferi Infection Prevalence in Blacklegged Ticks

Holly B Vuong et al. PLoS One. .

Abstract

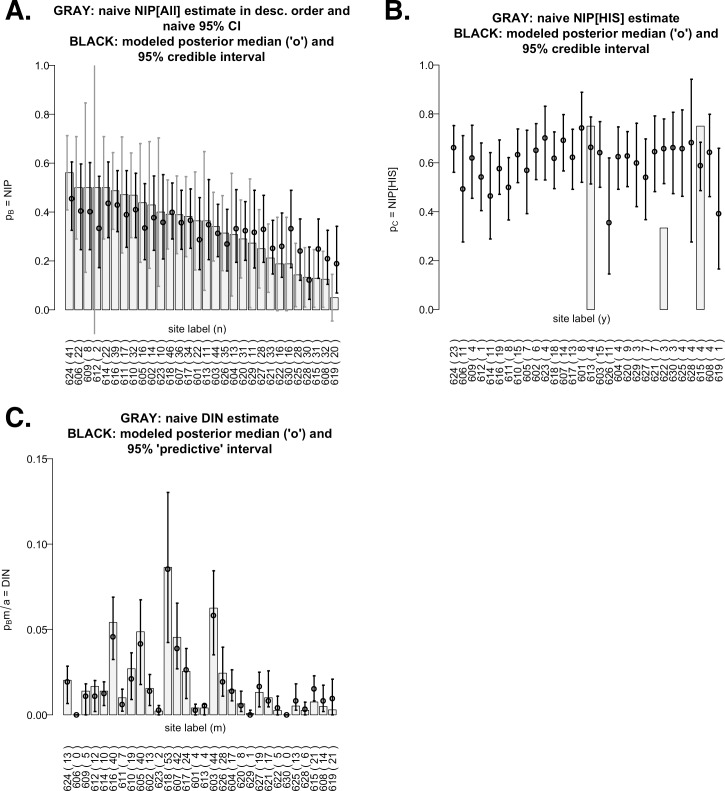
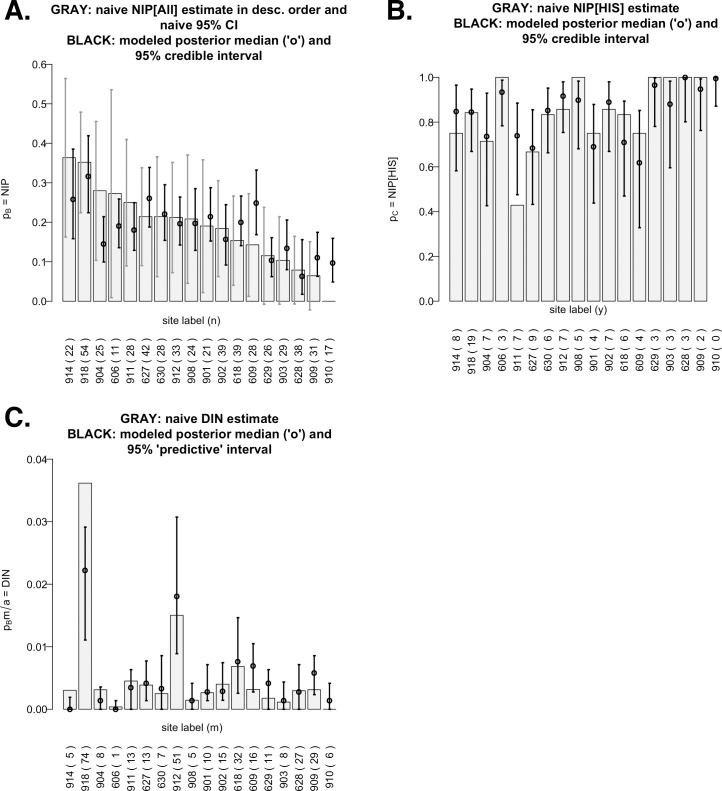
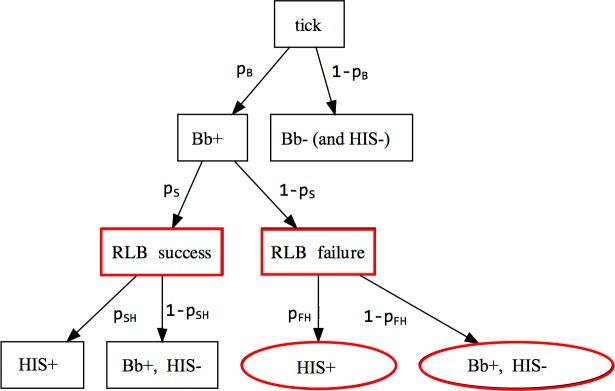
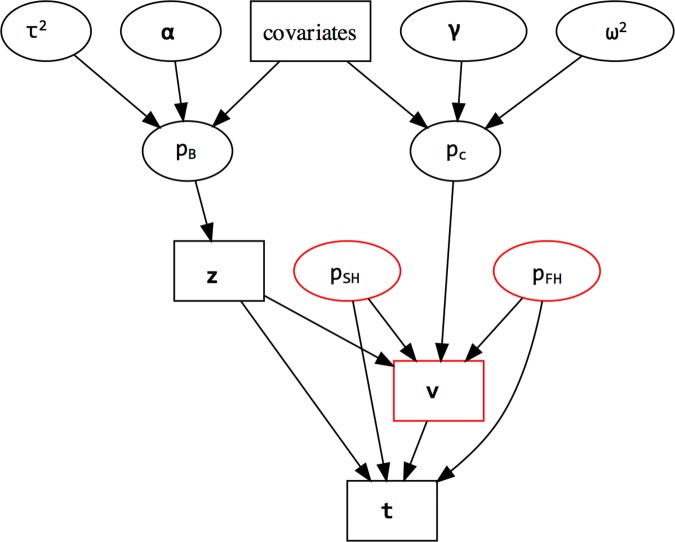
Lyme disease is a major vector-borne bacterial disease in the USA. The disease is caused by Borrelia burgdorferi, and transmitted among hosts and humans, primarily by blacklegged ticks (Ixodes scapularis). The ~25 B. burgdorferi genotypes, based on genotypic variation of their outer surface protein C (ospC), can be phenotypically separated as strains that primarily cause human diseases-human invasive strains (HIS)-or those that rarely do. Additionally, the genotypes are non-randomly associated with host species. The goal of this study was to examine the extent to which phenotypic outcomes of B. burgdorferi could be explained by the host communities fed upon by blacklegged ticks. In 2006 and 2009, we determined the host community composition based on abundance estimates of the vertebrate hosts, and collected host-seeking nymphal ticks in 2007 and 2010 to determine the ospC genotypes within infected ticks. We regressed instances of B. burgdorferi phenotypes on site-specific characteristics of host communities by constructing Bayesian hierarchical models that properly handled missing data. The models provided quantitative support for the relevance of host composition on Lyme disease risk pertaining to B. burgdorferi prevalence (i.e. overall nymphal infection prevalence, or NIPAll) and HIS prevalence among the infected ticks (NIPHIS). In each year, NIPAll and NIPHIS was found to be associated with host relative abundances and diversity. For mice and chipmunks, the association with NIPAll was positive, but tended to be negative with NIPHIS in both years. However, the direction of association between shrew relative abundance with NIPAll or NIPHIS differed across the two years. And, diversity (H') had a negative association with NIPAll, but positive association with NIPHIS in both years. Our analyses highlight that the relationships between the relative abundances of three primary hosts and the community diversity with NIPAll, and NIPHIS, are variable in time and space, and that disease risk inference, based on the role of host community, changes when we examine risk overall or at the phenotypic level. Our discussion focuses on the observed relationships between prevalence and host community characteristics and how they substantiate the ecological understanding of phenotypic Lyme disease risk.


Conflict of interest statement

The authors have declared that no competing interests exist.

Figures

Fig 1
Fig 1
Graphical displays of 2006 raw data and modeled results of overall nymphal infection prevalence (NIPAll; panel A), NIPHIS (panel B), and overall density of infected nymphs (DINAll; panel C). All bar charts are ordered by descending values on the x-axis. A: Shown as gray bars are the thirty site-specific naïve NIPALL estimates (= y/n where n = # of test ticks; y = # of ticks which tested positive for B. burgdorferi) and each corresponding naïve 95% confidence interval (= y/n ± 1.96 SEnaïve(y/n) based on sample proportions, also in gray) for the true NIPAll (= pB) at that site. In contrast, each black interval is a 95% credible interval (Bayesian confidence interval) using the posterior inference from our Bayesian model. Superimposed on each credible interval is the posterior median (a Bayesian estimate of the site’s true NIPALL). B: Same as panel A but for conditional NIPHIS estimates (= h/y where h = # of ticks whose RLB procedure indicated HIS+; RLB failure on any of the y positive ticks would lead to an indeterminate h/y). Only three sites yielded complete RLB results; their naïve confidence intervals were not computed due to small ys (hence, an invalid SE formula). In contrast, our Bayesian model provides valid estimates and 95% credible intervals for the true NIPHIS (= pC) for all 30 sites (shown in black). C: Similar to panels A–B but for naïve DINAll estimates (= [m/a]x[y/n] where m = # of nymphs dragged over a distance of a) and model-based estimates (= [m/a] x [posterior inference for pB]). Due to the uncertainty in m (unreplicated and hence, unmodeled), our model-based inference for DINAll here should be interpreted with care (see S4 File).
Fig 2
Fig 2
Graphical displays of 2009 raw data and modeled results of overall nymphal infection prevalence (NIPAll; panel A), NIPHIS (panel B), and overall density of infected nymphs (DINAll; panel C). All bar charts are ordered by descending values on the x-axis. Same information as for Fig 1 (year 2006), but for the eighteen sites in 2009.
Fig 3
Fig 3. Tree diagram with all possible states and associated probabilities for a test tick.
The probabilities are: pB (nymphal infection rate (NIPAll) of B. burgdorferi), pS (conditional probability of a successful RLB test, given infection), pSH (conditional probability that the test tick is HIS+, given RLB success), and pFH (conditional probability that the test tick is HIS+, given RLB failure). Note that pc (conditional NIPHIS, given infection) is equal to pSpSH + (1 − pS)pFH. Observable states are in boxes, and unobservable states are in ovals. Red nodes do not apply to 2009 because pS = 1.
Fig 4
Fig 4. Visual representation of the integrative Bayesian hierarchical approach, upon which our GLM is constructed.
All quantities depicted are site-specific except for regression coefficient vectors (α,γ) and variance parameters (τ2,ω2) which are study- (year-) specific. Both pB and pC depend on the same covariates. These two sets of dependencies are integrated through (1) the direct collective influence of pc,pSH, and pFH, and z (vector of 1’s and 0’s denoting the state of B. burgdorferi infection for test ticks), on v (vector of 1’s and 0’s denoting success/failure of RLB tests), and (2) the direct collective influence of pSH,pFH, z, and v on t (vector of 1’s and 0’s denoting HIS presence/absence on test ticks). Model parameters are in ovals and data are in boxes. Red nodes are not modeled for the 2009 data because v1 (non-stochastic). Model statements and details of the statistical analyses appear in S4 File.

References

    1. Smith I, Broos A, de Jong C, Zeddeman A, Smith C, Smith G, et al. Identifying Hendra virus diversity in Pteropid bats. PLoS One. Public Library of Science; 2011;6: e25275 10.1371/journal.pone.0025275 - DOI - PMC - PubMed
    1. Kyle JL, Harris E. Global spread and persistence of dengue. Annu Rev Microbiol. Annual Reviews; 2008;62: 71–92. 10.1146/annurev.micro.62.081307.163005 - DOI - PubMed
    1. Streicker DG, Turmelle AS, Vonhof MJ, Kuzmin I V, McCracken GF, Rupprecht CE. Host phylogeny constrains cross-species emergence and establishment of rabies virus in bats. Science. 2010;329: 676–9. 10.1126/science.1188836 - DOI - PubMed
    1. Power AG, Borer ET, Hosseini P, Mitchell CE, Seabloom EW. The community ecology of barley/cereal yellow dwarf viruses in Western US grasslands. Virus Res. Elsevier B.V.; 2011;159: 95–100. 10.1016/j.virusres.2011.05.016 - DOI - PubMed
    1. Suzán G, Marcé E, Giermakowski JT, Mills JN, Ceballos G, Ostfeld RS, et al. Experimental evidence for reduced rodent diversity causing increased Hantavirus prevalence. Wilby A, editor. PLoS One. Public Library of Science; 2009;4: e5461 10.1371/journal.pone.0005461 - DOI - PMC - PubMed

Publication types