. 2017 Jan 17;12(1):e0169555.
doi: 10.1371/journal.pone.0169555. eCollection 2017.

Three-Dimensional Assessment of Temporomandibular Joint Using MRI-CBCT Image Registration

Affiliations

Three-Dimensional Assessment of Temporomandibular Joint Using MRI-CBCT Image Registration

Mohammed A Q Al-Saleh et al. PLoS One. .

Abstract

Purpose: To introduce a new approach to reconstruct a 3D model of the TMJ using magnetic resonance imaging (MRI) and cone-beam computed tomography (CBCT) registered images, and to evaluate the intra-examiner reproducibility values of reconstructing the 3D models of the TMJ.

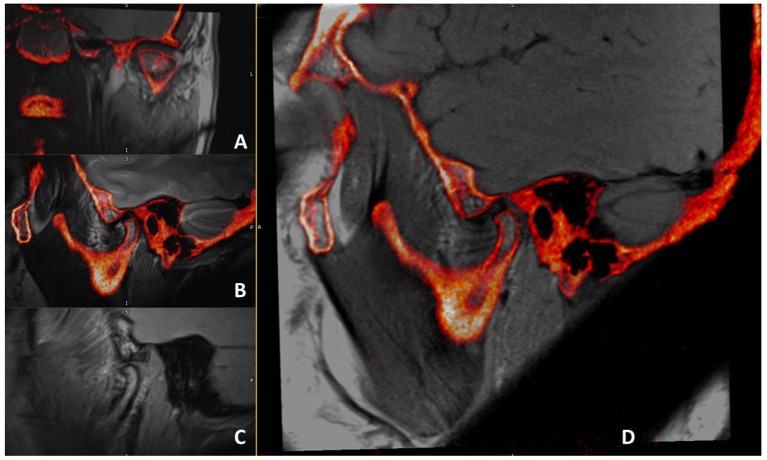
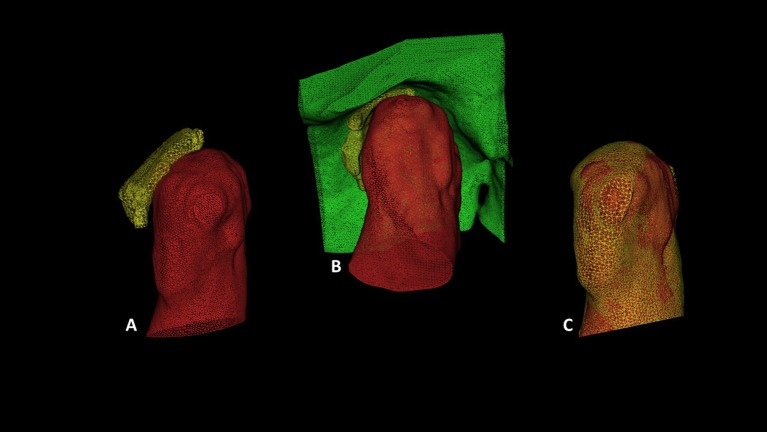
Methods: MRI and CBCT images of five patients (10 TMJs) were obtained. Multiple MRIs and CBCT images were registered using a mutual information based algorithm. The articular disc, condylar head and glenoid fossa were segmented at two different occasions, at least one-week apart, by one investigator, and 3D models were reconstructed. Differences between the segmentation at two occasions were automatically measured using the surface contours (Average Perpendicular Distance) and the volume overlap (Dice Similarity Index) of the 3D models. Descriptive analysis of the changes at 2 occasions, including means and standard deviation (SD) were reported to describe the intra-examiner reproducibility.

Results: The automatic segmentation of the condyle revealed maximum distance change of 1.9±0.93 mm, similarity index of 98% and root mean squared distance of 0.1±0.08 mm, and the glenoid fossa revealed maximum distance change of 2±0.52 mm, similarity index of 96% and root mean squared distance of 0.2±0.04 mm. The manual segmentation of the articular disc revealed maximum distance change of 3.6±0.32 mm, similarity index of 80% and root mean squared distance of 0.3±0.1 mm.

Conclusion: The MRI-CBCT registration provides a reliable tool to reconstruct 3D models of the TMJ's soft and hard tissues, allows quantification of the articular disc morphology and position changes with associated differences of the condylar head and glenoid fossa, and facilitates measuring tissue changes over time.


Conflict of interest statement

The authors have declared that no competing interests exist.

Figures

Fig 1
Fig 1. Multiple MRI sequences and CBCT images after registration.
A: Oblique coronal PD-weighted MRI-CBCT registered image; B: Oblique sagittal T2-weighted MRI-CBCT registered image; C: Open mouth oblique sagittal PD-weighted MRI only. D: Oblique sagittal PD-weighted MRI-CBCT registered image.
Fig 2
Fig 2. Sequence of the different automated image processing steps from the set of two input images to the final fused output image.
Fig 3
Fig 3
Illustration shows a joint histogram of 2 successfully registered multimodal images (A: MRI and B: CBCT) using normalized maximum mutual information approach. The Y-axis in the histogram represents the voxels intensities’ distribution from MRI and CT, Z-axis represents the voxels’ values of the MRI and X-axis represents the voxel’s values of the CBCT image. The radio-opaque (bright) molar tooth in the CBCT has similar intensity distribution to the low intensity (dark) region in the MRI, therefore, voxels from both images were matched and correspond to each other in the histogram. The finally fused registered image using this technique is displayed in Fig 3-C.
Fig 4
Fig 4. Illustration shows lateral (sagittal) view of the TMJ to explain the resampling process of 2 images of the TMJ.
A: An MRI for the TMJ with 8 sagittal sections each with 3mm thickness and inter-section gap of 0.3mm. B: Resampled sagittal sections of the MRI to match section thickness of CBCT image. C: CBCT image with 0.3mm of section thickness. D: Merged MRI and CBCT images with similar section thickness. The red lines represent the intersection gap from the MRI that is filled with a repeated adjacent image section. The resampling process allows for the computation of mutual information for MRI and CBCT images with different resolutions.
Fig 5
Fig 5. Tissues segmentation.
A: Oblique sagittal PD-weighted MRI(gray)-CBCT(red) registered image showing outlined/segmented articular disc and condylar head and TMJ structure of the temporal bone. B: Oblique sagittal PD-weighted MRI only showing the outlined/segmented osseous structures from the co-registered CBCT. C: Oblique coronal PD-weighted MRI-CBCT registered image showing the same outlined/segmented structures.
Fig 6
Fig 6. Tissues segmentation in MRI(gray)-CBCT(red) registered images.
A: Oblique sagittal PD-weighted MRI-CBCT registered image showing outlined/segmented articular disc (yellow) and condylar head and TMJ structure of the temporal bone (bright red). B: A yellow 3D cropping box of about 2.5cm3 in dimensions was manually drawn to export the cropped TMJ structures only as STL files. C: Oblique coronal PD-weighted MRI-CBCT registered image showing the medio-lateral dimensions of the same cropping box highlighting the cropped TMJ structures.
Fig 7
Fig 7. Illustration shows lateral (sagittal) view of the TMJ in 3D models rendered using STL files.
A: shows the condylar head (red) and the articular disc (yellow). B: shows the condylar head (red); glenoid fossa (green) and articular disc in between the 2 structures (yellow); C: shows overlapped condyles from two trials of segmentation by the same reader.

References

    1. Pullinger AG, Seligman DA. Multifactorial analysis of differences in temporomandibular joint hard tissue anatomic relationships between disk displacement with and without reduction in women. J Prosthet Dent 2001. October;86(4):407–419. 10.1067/mpr.2001.118563 - DOI - PubMed
    1. Major PW, Kinniburgh RD, Nebbe B, Prasad NG, Glover KE. Tomographic assessment of temporomandibular joint osseous articular surface contour and spatial relationships associated with disc displacement and disc length. Am J Orthod Dentofacial Orthop 2002. February;121(2):152–161. - PubMed
    1. Cortes D, Exss E, Marholz C, Millas R, Moncada G. Association between disk position and degenerative bone changes of the temporomandibular joints: an imaging study in subjects with TMD. Cranio 2011. April;29(2):117–126. 10.1179/crn.2011.020 - DOI - PubMed
    1. Kober C, Hayakawa Y, Kinzinger G, Gallo G, Yamamoto M, Sano T, et al. 3D-visualization of the temporomandibular joint with focus on the articular disc based on clinical T1-, T2-, and proton density weighted MR images. International Journal of Computer Assisted Radiology and Surgery 2007;2:203–210.
    1. Hayakawa Y, Kober C, Otonari-Yamamoto M, Otonari T, Wakoh M, Sano T. An approach for three-dimensional visualization using high-resolution MRI of the temporomandibular joint. Dentomaxillofac Radiol 2007. September;36(6):341–347. 10.1259/dmfr/12894471 - DOI - PubMed

MeSH terms