Potential Underestimation of Sleep Apnea Severity by At-Home Kits: Rescoring In-Laboratory Polysomnography Without Sleep Staging
- PMID: 28095966
- PMCID: PMC5359331
- DOI: 10.5664/jcsm.6540
Potential Underestimation of Sleep Apnea Severity by At-Home Kits: Rescoring In-Laboratory Polysomnography Without Sleep Staging
Abstract
Study objectives: Home sleep apnea testing (HSAT) is increasingly available for diagnosing obstructive sleep apnea (OSA). One key limitation of most HSAT involves the lack of sleep staging, such that the respiratory event index is calculated using the total recording time (TRT) rather than total sleep time (TST).
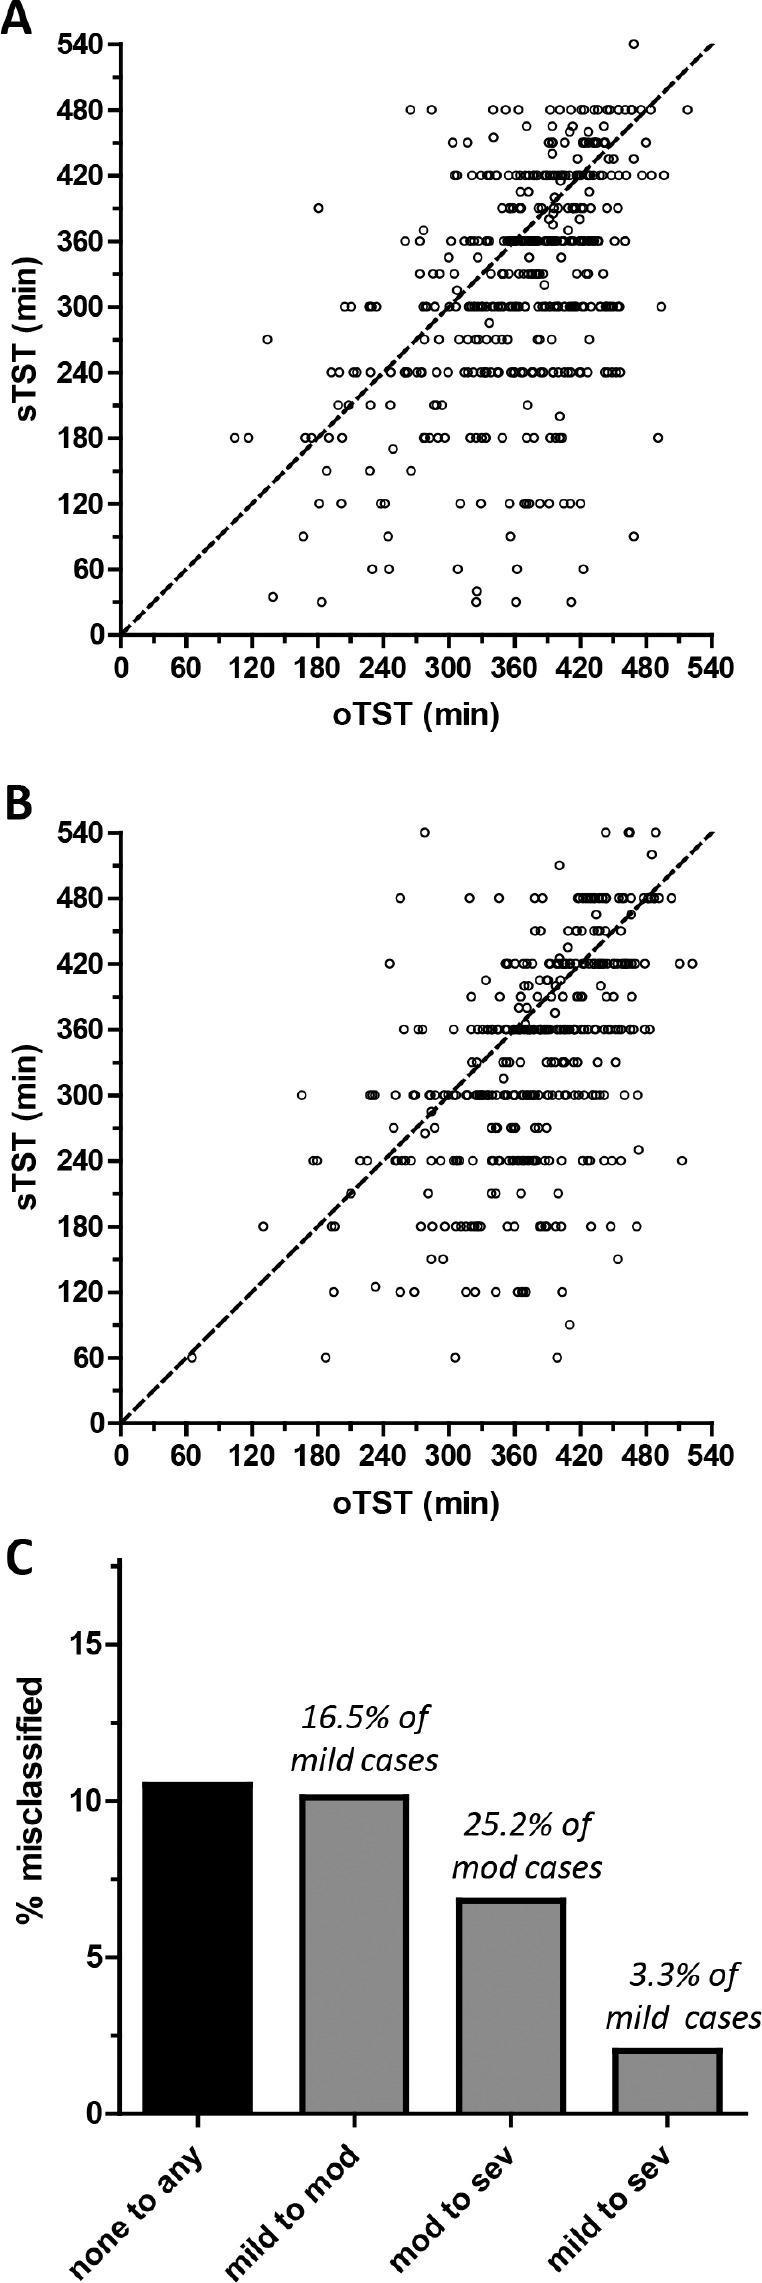
Methods: We performed a retrospective analysis of n = 838 diagnostic polysomnography (PSG) nights from our center; n = 444 with OSA (4% rule, apneahypopnea index (AHI) ≥ 5), and n = 394 with AHI < 5. We recalculated the AHI using time in bed (TIB) instead of TST, to assess the predicted underestimation risk of OSA severity.
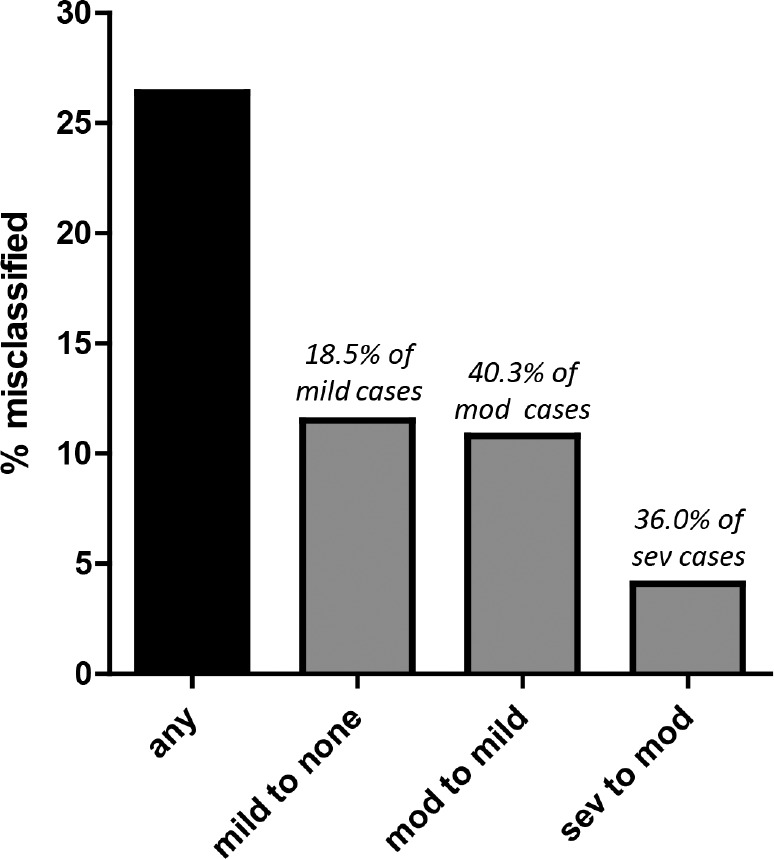
Results: Of all the patients with OSA, 26.4% would be reclassified as having less severe or no OSA after recalculating the AHI using TIB rather than TST. Of the n = 275 with mild OSA, 18.5% would be reclassified as not having OSA. The risk of underestimation was higher in those with moderate or severe OSA. Of the n = 119 moderate OSA cases, 40.3% would be reclassified as mild, and of the n = 50 severe OSA cases, 36.0% would be reclassified as moderate. Age strongly correlated with the degree of underestimation of the AHI, because age was significantly correlated with time awake during PSG.
Conclusions: The risk of sleep apnea underestimation is predicted to be substantial in a tertiary sleep center population. Phenotyping errors included risk of falsely negative results (from mild to normal), as well as category errors: moderate or severe moving to mild or moderate severity, respectively. Clinicians should recognize this underestimation limitation, which directly affects diagnostic phenotyping and thus therapeutic decisions.
Commentary: A commentary on this article appears in this issue on page 531.
Keywords: diagnosis; prediction; underestimation.
© 2017 American Academy of Sleep Medicine
Figures
Comment in
-
Underestimation of Sleep Apnea With Home Sleep Apnea Testing Compared to In-Laboratory Sleep Testing.J Clin Sleep Med. 2017 Apr 15;13(4):531-532. doi: 10.5664/jcsm.6534. J Clin Sleep Med. 2017. PMID: 28356176 Free PMC article. No abstract available.
References
-
- Westbrook PR, Levendowski DJ, Cvetinovic M, et al. Description and validation of the apnea risk evaluation system: a novel method to diagnose sleep apneahypopnea in the home. Chest. 2005;128(4):2166–2175. - PubMed
-
- Bianchi MT, Williams KL, McKinney S, Ellenbogen JM. The subjective-objective mismatch in sleep perception among those with insomnia and sleep apnea. J Sleep Res. 2013;22(5):557–568. - PubMed
MeSH terms
LinkOut - more resources
Full Text Sources
Other Literature Sources