. 2017 Mar;120(3):229-234.
doi: 10.1016/j.ymgme.2017.01.003. Epub 2017 Jan 10.

Glycogen storage disease type Ia mice with less than 2% of normal hepatic glucose-6-phosphatase-α activity restored are at risk of developing hepatic tumors

Affiliations

Glycogen storage disease type Ia mice with less than 2% of normal hepatic glucose-6-phosphatase-α activity restored are at risk of developing hepatic tumors

Goo-Young Kim et al. Mol Genet Metab. 2017 Mar.

Abstract

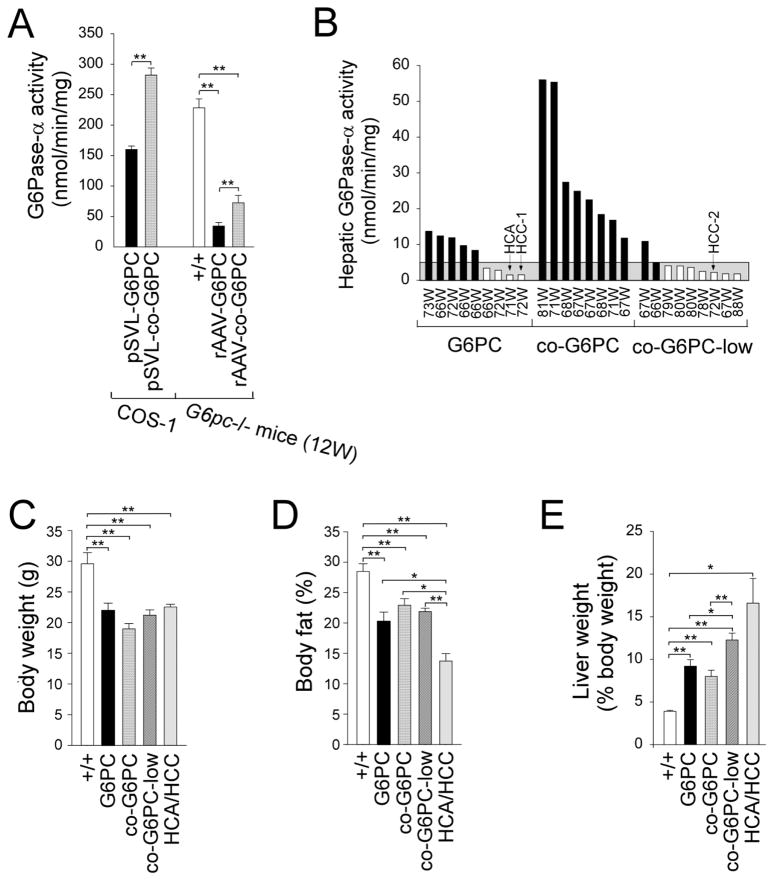
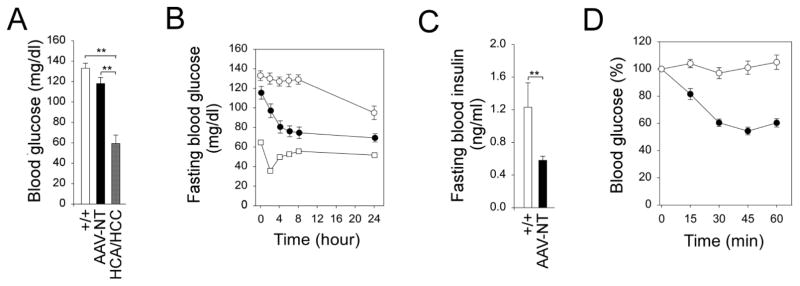
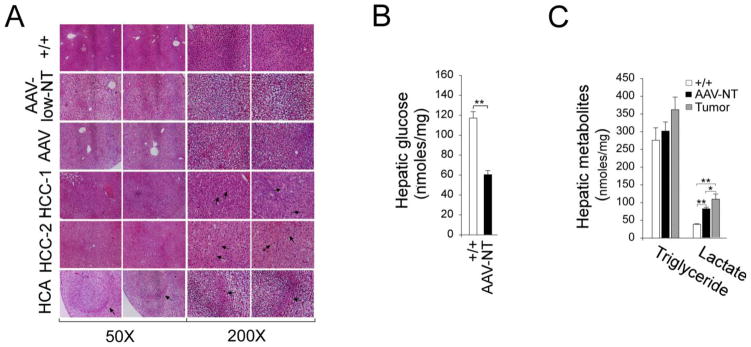
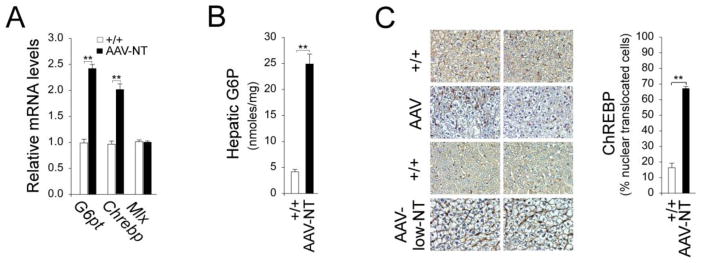
Glycogen storage disease type Ia (GSD-Ia), characterized by impaired glucose homeostasis and chronic risk of hepatocellular adenoma (HCA) and carcinoma (HCC), is caused by a deficiency in glucose-6-phosphatase-α (G6Pase-α or G6PC). We have previously shown that G6pc-/- mice receiving gene transfer mediated by rAAV-G6PC, a recombinant adeno-associated virus (rAAV) vector expressing G6Pase-α, and expressing 3-63% of normal hepatic G6Pase-α activity maintain glucose homeostasis and do not develop HCA/HCC. However, the threshold of hepatic G6Pase-α activity required to prevent tumor formation remained unknown. In this study, we constructed rAAV-co-G6PC, a rAAV vector expressing a codon-optimized (co) G6Pase-α and showed that rAAV-co-G6PC was more efficacious than rAAV-G6PC in directing hepatic G6Pase-α expression. Over an 88-week study, we showed that both rAAV-G6PC- and rAAV-co-G6PC-treated G6pc-/- mice expressing 3-33% of normal hepatic G6Pase-α activity (AAV mice) maintained glucose homeostasis, lacked HCA/HCC, and were protected against age-related obesity and insulin resistance. Of the eleven rAAV-G6PC/rAAV-co-G6PC-treated G6pc-/- mice harboring 0.9-2.4% of normal hepatic G6Pase-α activity (AAV-low mice), 3 expressing 0.9-1.3% of normal hepatic G6Pase-α activity developed HCA/HCC, while 8 did not (AAV-low-NT). Finally, we showed that the AAV-low-NT mice exhibited a phenotype indistinguishable from that of AAV mice expressing ≥3% of normal hepatic G6Pase-α activity. The results establish the threshold of hepatic G6Pase-α activity required to prevent HCA/HCC and show that GSD-Ia mice harboring <2% of normal hepatic G6Pase-α activity are at risk of tumor development.

Keywords: Gene therapy; Hepatocellular adenoma; Hepatocellular carcinoma; Recombinant adeno-associated virus vector.


Conflict of interest statement

Conflict of interest

The authors have declared that no conflict of interest exists.

Figures

Fig. 1
Fig. 1
Functional characterization of G6PC and co-G6PC constructs and phenotype analysis of rAAV-treated G6pc−/− mice. (A) Analysis of G6PC and co-G6PC constructs by transient expression and gene transfer into G6pc−/− mice. Transient expression assays were performed in COS-1 cells using two independent pSVL-G6PC or pSVL-co-G6PC isolates, each in four separate transfections. In vivo gene delivery was performed by infusing 2-week-old G6pc−/− with 6 × 10¹² vp/kg of rAAV-G6PC (n = 4) or rAAV-co-G6PC (n = 4), and hepatic G6Pase-α activity was analyzed at age 12 weeks. +/+, wild-type mice. (B–E) Phenotypic analysis of 66–88 week-old wild-type and rAAV-treated G6pc−/− mice. Two-week-old G6pc−/− were infused with 6 × 10¹² vp/kg of rAAV-G6PC (G6PC; n = 9), 6 × 10¹² vp/kg of rAAV-co-G6PC (co-G6PC; n = 8), or 2 × 10¹² vp/kg of rAAV-co-G6PC (co-G6PC-low; n = 9) and phenotyped at age 66–88 weeks. (B) Hepatic microsomal G6Pase-α activity is shown at the indicated ages in weeks (W). Hepatic G6Pase-α activity in age-matched wild-type mice (+/+, n = 23) averaged 171.4 ± 5.7 units. The grey area denotes G6Pase activity of ≤5 units. Mice with G6Pase activities ≥ 5 units and <5 units were shown in black and white bars, respectively. (C–E) Body weight (C), body fat (D), and liver weight (E) values in wild-type (+/+, n = 12), rAAV-G6PC (n = 7), rAAV-co-G6PC (n = 8), rAAV-co-G6PC-low (n = 8), and HCA/HCC-bearing (n = 3) mice.
Fig. 2
Fig. 2
Phenotype, fasting blood glucose profile and insulin tolerance profile of 66–88 week-old wild-type and rAAV-treated G6pc−/− mice. (A) Blood glucose levels in wild-type (+/+, n = 12), AAV-NT (n = 22), and HCA/HCC-bearing (n = 3) mice. (B) Fasting blood glucose profiles in wild-type (○, n = 12), AAV-NT (●, n = 20) mice, and a single HCA-bearing mouse (□). (C) Twenty-four hour fasted blood insulin levels in wild-type (+/+, n = 12) and AAV-NT (n = 22) mice. (D) Insulin tolerance profiles of wild-type (○, n = 12) and AAV-NT (●, n = 20) mice. Values are reported as a percent of respective level of each group at zero time. Data represent the mean ± SEM; **P < 0.005.
Fig. 3
Fig. 3
Histological analysis and hepatic metabolites in 66–88 week-old wild-type, rAAV-treated G6pc−/− mice, and HCA/HCC lesions. The data were analyzed for wild-type (+/+, n = 12), AAV-NT (n = 22), and the single HCA-bearing mice after 24 hours of fasting. The 2 HCC-bearing mice did not undergo fasting. (A) H&E stained liver sections. In HCA-bearing liver, the HCA lesion is denoted by arrows. In HCC-1 and HCC-2, arrows denote anisocytotic and anisokaryotic hepatocytes. Scale bar: 200 μm. (B) Hepatic glucose levels. (C) Hepatic triglyceride and lactate levels. Data represent the mean ± SEM; **P < 0.005.
Fig. 4
Fig. 4
Hepatic ChREBP signaling in 66–88 week-old rAAV-treated G6pc−/− mice. For hepatic G6P and quantitative RT-PCR, the data were analyzed for wild-type (+/+, n = 12) and AAV-NT (n = 22) mice after 24 hours of fasting. (A) Quantification of G6pt, Chrebp and Mlx mRNA by real-time RT-PCR. (B) Hepatic G6P contents. (C) Immunohistochemical analysis of hepatic ChREBP nuclear localization and quantification of nuclear ChREBP-translocated cells. Representative plates shown are at magnifications of x400, analyzed in wild-type (+/+, n = 5), AAV-NT, including AAV (n = 6), and AAV-low-NT (n = 6) mice. Data represent the mean ± SEM; **P < 0.005.

Similar articles

Cited by

References

    1. Chou JY, Matern D, Mansfield BC, Chen YT. Type I glycogen storage diseases: disorders of the glucose-6-phosphatase complex. Curr Mol Med. 2002;2:121–143. - PubMed
    1. Chou JY, Jun HS, Mansfield BC. Glycogen storage disease type I and G6Pase-β deficiency: etiology and therapy. Nat Rev Endocrinol. 2010;6:676–688. - PMC - PubMed
    1. Pan CJ, Lei KJ, Annabi B, Hemrika W, Chou JY. Transmembrane topology of glucose-6-phosphatase. J Biol Chem. 1998;273:6144–6148. - PubMed
    1. Greene HL, Slonim AE, O’Neill JA, Jr, Burr IM. Continuous nocturnal intragastric feeding for management of type 1 glycogen-storage disease. N Engl J Med. 1976;294:423–425. - PubMed
    1. Chen YT, Cornblath M, Sidbury JB. Cornstarch therapy in type I glycogen storage disease. N Engl J Med. 1984;310:171–175. - PubMed

Publication types

MeSH terms

Supplementary concepts