. 2017 Apr 20;129(16):2233-2245.
doi: 10.1182/blood-2016-06-724831. Epub 2017 Jan 17.

Functional role and therapeutic targeting of p21-activated kinase 4 in multiple myeloma

Affiliations

Functional role and therapeutic targeting of p21-activated kinase 4 in multiple myeloma

Mariateresa Fulciniti et al. Blood. .

Abstract

Dysregulated oncogenic serine/threonine kinases play a pathological role in diverse forms of malignancies, including multiple myeloma (MM), and thus represent potential therapeutic targets. Here, we evaluated the biological and functional role of p21-activated kinase 4 (PAK4) and its potential as a new target in MM for clinical applications. PAK4 promoted MM cell growth and survival via activation of MM survival signaling pathways, including the MEK-extracellular signal-regulated kinase pathway. Furthermore, treatment with orally bioavailable PAK4 allosteric modulator (KPT-9274) significantly impacted MM cell growth and survival in a large panel of MM cell lines and primary MM cells alone and in the presence of bone marrow microenvironment. Intriguingly, we have identified FGFR3 as a novel binding partner of PAK4 and observed significant activity of KPT-9274 against t(4;14)-positive MM cells. This set of data supports PAK4 as an oncogene in myeloma and provide the rationale for the clinical evaluation of PAK4 modulator in myeloma.


Figures
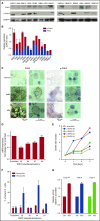
Figure 1.
Figure 1.
PAK4 expression affects growth and survival in MM. (A) Protein lysates from a panel of MM cell lines were analyzed for PAK4 and p-PAK4 expression by WB. GAPDH was used as loading control. One representative experiment of 2 is shown. (B) PAK4 and p-PAK4 relative expression levels. Data reported represent mean of 3 independent experiments. (C) Representative images of PAK4 and p-PAK4 immunocytochemistry stain in BM from normal, SMM, and symptomatic MM individuals. Scale bars: 100 μm and 5 μm. (D) Genetic depletion of PAK4 was achieved using 4 different tetracycline-inducible pTRIPz-Turbo-RFP vectors (Thermo Scientific, Pittsburgh, PA) containing the target sequence or scrambled control. Transfected MM1S cells were plated in growth medium in the absence or presence of 2.5 μg/mL doxycycline. qPCR analysis (right panel) was performed at day 3, confirming decreased PAK4 mRNA levels in cells expressing inducible PAK4 shRNAs compared with scrambled cells. (E) Cellular proliferation was evaluated by (3H)-thymidine uptake and presented as growth rate increase compared with t = 0. In medium containing doxycycline, reduced expression of PAK4 is accompanied by a reduction of cell growth rate compared with control cells. (F) Apoptosis was evaluated after 3 days of induction with 2.5 μg/mL doxycycline, using Annexin V and propidium iodide (PI) staining followed by flow cytometry acquisition and analysis. (G) Caspases activation was evaluated after 3 days of induction with 2.5 μg/mL doxycycline by luminescence assay.
Figure 2.
Figure 2.
PAK4 triggers MEK/ERK pathway activation in MM cells. (A) WB analysis of PAK4 expression in RPMI 8226 cells overexpressing PAK4. (B) Effect of PAK4 overexpression in RPMI 8226 cells was evaluated over time by (3H)-thymidine uptake and presented as fold change increase compared with day 1. (C) In vivo evaluation of the effects of PAK4 overexpression on MM cells. Growth curve assesses tumor size after injection of an equal number of PAK4 overexpression or empty vector cells subcutaneously into the right posterior flank region of severe combined immunodeficiency mice. Data are shown as the mean values ± standard deviation. (D) PAK4 mRNA levels were evaluated in control and PAK4-overexpressing cells by qPCR analysis. Data are presented as fold change increase from corresponding control cells. (E) Effect of PAK4 overexpression in H929, MM1S, INA6, and KMS12BM MM cell lines was evaluated over time by (3H)-thymidine uptake and presented as fold change increase compared with day 1. (F) WBs showing inhibition of indicated signaling proteins in H929 and RPMI 8226 myeloma cells ectopically expressing PAK4, compared with respective control. GAPDH was used as loading control. One representative blot of 2 is shown. (G) Control and ectopically expressing PAK4 cells were treated with and without U0126 (10 µM) or LY29004 (10 µM) for 48 hours. Cell proliferation was assessed by (3H)-thymidine uptake and presented as count per minute (CPM). (H) MM1S cells transfected with inducible tetracycline-inducible pTRIPz-Turbo-RFP vector #23 or control were treated with 2.5 μg/mL doxycycline for 3 consecutive days. WB analysis was performed using indicated mAbs. *P < .05; **P < .005; ***P < .0005. CNT, control; NS, not significant; WT, wild type.
Figure 3.
Figure 3.
Discovery and characterization of PAMs. MS-751 cells were labeled with either heavy or light amino acids, lysed, and incubated with ×50 free KPT-7523 or DMSO, respectively, for 2 hours. The lysates were then incubated with KPT-7523 resin overnight. Samples were combined and washed, and then either digested on beads or run on sodium dodecyl sulfate–polyacrylamide gel electrophoresis (SDS-PAGE), separated by molecular weight ranges, and then digested. Proteins were quantified by mass spectroscopy and analyzed. Both the (A) on-bead digestion and (B) in-gel digestion revealed PAK4 (red circle) as the major target of KPT-7523, with minor targets identified as red dots. (C) Cell lysates from MS-751, HeLa, and U2OS cells were treated with ×50 free KPT-7523, free KPT-7523–polyethylene glycol, or DMSO for 2 hours. The lysates were then passed over KPT-7523 resin overnight at 4°C. The resin was washed with buffer and run on SDS-PAGE for WB with PAK4. PAK4 specifically bound to KPT-7523 resin in all 3 cell lines tested. (D) MDA-MB-231 cells were treated with either DMSO or 10 µM KPT-7523 for 48 hours and then collected by lysing. The lysates were incubated with either KPT-7523 resin, KPT-9101 resin (inactive compound), or untagged resin overnight at 4°C. Resin was washed and run on SDS-PAGE and probed for PAK1-6. KPT-7523 resin bound specifically to PAK4. KPT-9101 and untagged resin did not bind to PAK4. (E) PAK4 regulatory (1-290 aa) and kinase (291-591 aa) domains were produced and purified from E coli. The purified protein was incubated with KPT-7523 resin overnight, washed, and then run on SDS-PAGE. PAK4 antibody measured specific binding of PAK4 kinase domain to KPT-7523. (F) Structure of the clinical candidate KPT-9274.
Figure 4.
Figure 4.
KPT-9274 inhibits MM cell growth and survival and overcomes promoting effect of the BM milieu. (A) A panel of 23 HMMCLs was treated with different doses of KPT-9274 for 48 hours, and cell survival was assessed by CTG. IC50 analysis was performed with GraphPad software. (B) CD138+ MM cells from 4 MM patients were cultured in the presence of different concentrations of KPT-9274 for 48 hours. Cell viability was assessed by CTG and expressed as percent change from untreated cells (left panel). IC50 analysis is also shown (right panel). (C) H929, MM1S, and OPM2 cells were cultured with and without BMSC, and in the presence of different doses of KPT-9264 for 48 hours. Cell proliferation was assessed by (3H)-thymidine uptake assay and presented as percent change from untreated cells cultured in the absence of BMSC. (D) BM from 6 myeloma patients was diluted with RPMI to seed 400 to 8000 live cells per well into 96-well plates previously prepared with increasing concentration of KPT-9274 (1 nM-10 µM) and DMSO (up to 0.5%) as vehicle and were incubated for 24 to 72 hours. After red cell lysis, cells were stained with annexin V and CD138 mAb to identify viable myeloma cells. Viable cell number was transformed to percent inhibition relative to vehicle control. Dose-response curves were fitted to nonlinear regression analysis (left panel). IC50 analysis was performed using GraphPad analysis software (right panel). (E) Left panel shows dose-response curve fitted to nonlinear regression analysis of both malignant plasma cells and normal BM cells of a representative case (patient 6). Right panel displays dose/response effect in malignant and normal BM cells of 5 myeloma patients. Data are shown as area under the curve (AUC).
Figure 5.
Figure 5.
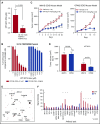
Targeting PAK4 by KPT-9274 induces significant cell death in FGFR3-expressing, t(4:14)-positive HMMCLs. (A) Public data from Jonathan Keats’ laboratory (keatslab.org) were used to evaluate the presence of cytogenetic abnormalities, FGFR3 mutations, and FGFR3 expression level in the 23 MM cell lines tested for KPT-9274 sensitivity. Two groups were established based on the presence versus absence of t(4;14), FGFR3 mutation, and high level of FGFR3 expression (superior to the median calculated in the 23 MMCL). Fourteen MMCL were at least positive for t(4;14), high FGFR3 expression, or presence of FGFR3 mutation, whereas 9 MMCL were negative for all. We next compared the KPT-9274 IC50 average between the 2 groups using an unpaired Student t test and observed that MMCL with high FGFR3 and/or FGFR3 mutation and/or t(4;14) were significantly more sensitive (P = .0324). (B) CD138-positive and -negative cells from a t(4;14) myeloma patient with FGFR3/IGH fusion were treated with different concentrations of KPT-9274 for 48 hours. Cell viability was assessed by CTG and presented as percent of viable cells compared with control. IC50 analysis was performed using GraphPad software. (C) Nude mice were subcutaneously inoculated with MM1S (left panel) or OPM2 (right panel) MM cell lines. Treatment started following detection of tumor (∼2 weeks from cell injection). Mice were treated with either 100 mg/kg of KPT-9274 or vehicle orally once per day, 5 d/wk. Tumors were measured in 2 perpendicular dimensions by caliper. (D) Comparison of tumor volume in control and treated mice at day 13 after initial assessment of tumor appearance and start of treatment in MM1S and OPM2 injected mice respectively. (E) A nitrocellulose filter arrayed with antibodies against 400 signal transduction proteins was blotted with lysates of RPMI 8226 cells transfected with GFP-tagged PAK4. The multiprotein complexes were detected by immunoblotting with a horseradish peroxidase–conjugated anti-GFP antibody and visualized by chemiluminescence. (F) Nitrocellulose filters immobilized with 24 antibodies were incubated with whole cell lysates from cells untreated or treated with KPT-9274. Data are presented as signal intensity. TR, treated.
Figure 6.
Figure 6.
KPT-9274 triggers apoptotic cell death in myeloma cells. (A) OPM2 cells were cultured in the absence or presence of KPT-9274, and apoptotic cell death was assessed by flow cytometric analysis following AnnexinV and PI staining. The percent of AnnexinV+/PI (early apoptosis) and AnnexinV+/PI+ (late apoptosis) cells are shown in the graphs. (B) Whole cell lysate from OPM2 cells treated with several concentrations of KPT-9274 for 48 hours was subjected to WB analysis and probed with antibodies against caspases-3, -8, -9, poly-ADP ribose polymerase, with β-actin as loading control. (C-D) Indicated caspase activities were evaluated in OPM2 cells (C) and CD138+ cells from 4 MM patients (D) after KPT-9274 treatment (0.5 µM) for 48 and/or 72 hours using luminescence assay. (E) OPM2 cells were cultured in the presence or absence of zVAD-fmk (100 µM) with or without KPT-9274 for 48 hours. Apoptosis was evaluated by flow cytometric analysis following Annexin V and PI staining. The percent of AnnexinV+ cells is shown in the graph.
Figure 7.
Figure 7.
MEK/ERK pathway deregulation mediates KPT-9274–induced MM cell death. (A) Whole cell lysates from OPM2 cells treated with several concentrations of KPT-9274 for 48 hours were subjected to WB analysis and probed with indicated antibodies. (B) MM1S, KMS11, OPM2, and U266 cells were electroporated with control or NF-κB luciferase reporter plasmid and pRL-TK to normalize for different transfection efficiencies; following electroporation, cells were treated with vehicle or 2 doses of KPT-9274. Forty-eight hours later, luminescence was measured using the Dual Luciferase assay kit and the Glo-Max microplate luminometer. Results are expressed as percentage of Firefly/Renilla ratio of control-transfected cells. (C) H929, KMS11, and U266 cells were electroporated with control or serum response element (SRE) reporter vector. Dual Luciferase assay was performed after 48 hours of incubation with or without KPT-9274. Results are expressed as percentage of Firefly/Renilla ratio of control-transfected cells. (D) Relative mRNA expression of differentially expressed genes after KPT-9274 treatment in OPM2 and KMS11 cell lines compared with untreated cells. (E) Nuclear extracts from KPT-9274–treated OPM2 cells were analyzed for transcription factor activation using a transcription factor profiling array. Relative fold changes from control are plotted. (F) OPM2 cells were treated with different concentrations of KPT-9274 in combination with either U0126 (10 µM) or LY29004 (10 µM) or Rapamycin (10 µM) for 48 hours. Cell viability was assessed by CTG uptake and presented as percent compared with control cells.

Comment in

  • Multiple myeloma cells sent "PAKing"!
    Neri P, Bahlis NJ. Neri P, et al. Blood. 2017 Apr 20;129(16):2208-2209. doi: 10.1182/blood-2017-02-764662. Blood. 2017. PMID: 28428234 No abstract available.

References

    1. Hideshima T, Mitsiades C, Tonon G, Richardson PG, Anderson KC. Understanding multiple myeloma pathogenesis in the bone marrow to identify new therapeutic targets. Nat Rev Cancer. 2007;7(8):585-598. - PubMed
    1. Palumbo A, Anderson K. Multiple myeloma. N Engl J Med. 2011;364(11):1046-1060. - PubMed
    1. Mateos MV, Ocio EM, Paiva B, et al. . Treatment for patients with newly diagnosed multiple myeloma in 2015. Blood Rev. 2015;29(6):387-403. - PubMed
    1. Rane CK, Minden A. P21 activated kinases: structure, regulation, and functions. Small GTPases. 2014;5(1):e28003. - PMC - PubMed
    1. Dan C, Kelly A, Bernard O, Minden A. Cytoskeletal changes regulated by the PAK4 serine/threonine kinase are mediated by LIM kinase 1 and cofilin. J Biol Chem. 2001;276(34):32115-32121. - PubMed

Publication types

MeSH terms