Innovative Techniques for Evaluating Behavioral Nutrition Interventions
- PMID: 28096132
- PMCID: PMC5227983
- DOI: 10.3945/an.116.013862
Innovative Techniques for Evaluating Behavioral Nutrition Interventions
Abstract
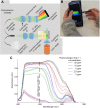
Assessing outcomes and the impact from behavioral nutrition interventions has remained challenging because of the lack of methods available beyond traditional nutrition assessment tools and techniques. With the current high global obesity and related chronic disease rates, novel methods to evaluate the impact of behavioral nutrition-based interventions are much needed. The objective of this narrative review is to describe and review the current status of knowledge as it relates to 4 different innovative methods or tools to assess behavioral nutrition interventions. Methods reviewed include 1) the assessment of stress and stress responsiveness to enhance the evaluation of nutrition interventions, 2) eye-tracking technology in nutritional interventions, 3) smartphone biosensors to assess nutrition and health-related outcomes, and 4) skin carotenoid measurements to assess fruit and vegetable intake. Specifically, the novel use of functional magnetic resonance imaging, by characterizing the brain's responsiveness to an intervention, can help researchers develop programs with greater efficacy. Similarly, if eye-tracking technology can enable researchers to get a better sense as to how participants view materials, the materials may be better tailored to create an optimal impact. The latter 2 techniques reviewed, smartphone biosensors and methods to detect skin carotenoids, can provide the research community with portable, effective, nonbiased ways to assess dietary intake and quality and more in the field. The information gained from using these types of methodologies can improve the efficacy and assessment of behavior-based nutrition interventions.
Keywords: biosensors; brain responsiveness; community nutrition interventions; eye-tracking; nutrition assessment; program evaluation; public health; reflective spectroscopy; resonance Raman spectroscopy; smartphone.
© 2017 American Society for Nutrition.
Conflict of interest statement
3 Author disclosures: RE Scherr, KD Laugero, DJ Graham, L Jahns, KR Lora, M Reicks, and AR Mobley, no conflicts of interest. BT Cunningham has a competing financial interest as a founder of Exalt Diagnostics, a company established to commercialize the smartphone biosensor technology.
Figures


References
-
- Centers for Disease Control and Prevention, Division of Cancer Prevention and Control, Social Ecological Model for the Colorectal Cancer Control Program. 2015. [Internet] [cited 2016 Sep 1]. Available from: http://www.cdc.gov/cancer/crccp/sem.htm.
-
- Gibson RS. Principles of nutritional assessment. 2nd ed. New York: Oxford University Press; 2005.
-
- Centers for Disease Control and Prevention, National Center for Health Statistics. National Health and Nutrition Examination Survey anthropometry procedures manual. 2007. [cited 2016 Sep 1] Available from: www.cdc.gov/nchs/data/nhanes/nhanes_07_08/manual_an.pdf.
-
- Must A, Anderson SE. Body mass index in children and adolescents: considerations for population-based applications. Int J Obes (Lond) 2006;30:590–4. - PubMed

