Comparative Study
. 2017 Jan 31;114(5):1075-1080.
doi: 10.1073/pnas.1617849114. Epub 2017 Jan 17.

Evolution of antibiotic resistance is linked to any genetic mechanism affecting bacterial duration of carriage

Affiliations
Comparative Study

Evolution of antibiotic resistance is linked to any genetic mechanism affecting bacterial duration of carriage

Sonja Lehtinen et al. Proc Natl Acad Sci U S A. .

Abstract

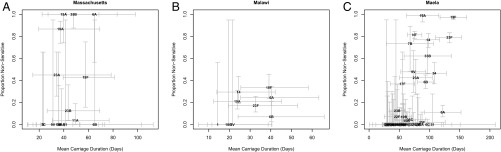
Understanding how changes in antibiotic consumption affect the prevalence of antibiotic resistance in bacterial pathogens is important for public health. In a number of bacterial species, including Streptococcus pneumoniae, the prevalence of resistance has remained relatively stable despite prolonged selection pressure from antibiotics. The evolutionary processes allowing the robust coexistence of antibiotic sensitive and resistant strains are not fully understood. While allelic diversity can be maintained at a locus by direct balancing selection, there is no evidence for such selection acting in the case of resistance. In this work, we propose a mechanism for maintaining coexistence at the resistance locus: linkage to a second locus that is under balancing selection and that modulates the fitness effect of resistance. We show that duration of carriage plays such a role, with long duration of carriage increasing the fitness advantage gained from resistance. We therefore predict that resistance will be more common in strains with a long duration of carriage and that mechanisms maintaining diversity in duration of carriage will also maintain diversity in antibiotic resistance. We test these predictions in S. pneumoniae and find that the duration of carriage of a serotype is indeed positively correlated with the prevalence of resistance in that serotype. These findings suggest heterogeneity in duration of carriage is a partial explanation for the coexistence of sensitive and resistant strains and that factors determining bacterial duration of carriage will also affect the prevalence of resistance.

Keywords: Streptococcus pneumoniae; antibiotic resistance; coexistence; epistasis; multistrain model.


Conflict of interest statement

M.L. has received consulting fees/honoraria from Merck, Pfizer, Affinivax, and Venable LLC and grant support not related to this paper from Pfizer and PATH Vaccine Solutions.

Figures

Fig. 1.
Fig. 1.
Model of competition between antibiotic sensitive and resistant strains (Eq. 1). U represents uninfected hosts, Is represents hosts infected with the sensitive strain, Ir represents hosts infected with the resistant strain, β is the transmission rate, μ is the clearance rate, τ is the population antibiotic consumption rate, and βs=β,βr=βcβ,μs=μ,μr=cμμ, where cβ and cμ represent the cost of resistance.
Fig. 2.
Fig. 2.
Parameter space for coexistence in a two-allele two-locus model of resistance. One locus determines resistance (s or r), and the other determines duration of carriage (A or B). The coexistence space is constrained by the lines τμA(cβcμ1) and τμB(cβcμ 1), with μA<μB, where τ is the antibiotic consumption rate, μ is a strain’s clearance rate, cβ is the cost of resistance in transmission, and cμ is the cost of resistance in clearance. In this plot, μA=0.5,μB=1,cβcμ=1.1. We use cost to mean proportional multiplicative cost: c=1 corresponds to no cost.
Fig. 3.
Fig. 3.
Prevalence of sensitive and resistant D-types, in a model with 16 D-types (n=16). The bars represent the prevalence of a D-type, stratified by antibiotic resistance (yellow and blue). Clearance rates for D-types were evenly spaced in the range [0.5,2]. Other parameters are β=2,cβ=1,cμ= 1.1,k= 15,τ= 0.075.
Fig. 4.
Fig. 4.
Increase in resistance with increasing antibiotic consumption. (A) Effect of number of modeled D-types on the relationship between antibiotic consumption and resistance. Clearance rates for D-types were evenly spaced in the range [0.5,2] and other parameters were β= 2,cβ= 1,cμ= 1.1,k= 15. (B) Relationship between penicillin nonsensitivity in S. pneumoniae and primary care beta-lactam prescriptions, in defined daily doses (DDD) per 1,000 inhabitants, in European countries in 2007 [chosen to avoid confounding by 2008 changes in Clinical and Laboratory Standards Institute breakpoints for S. pneumoniae implemented in some countries (7)]. r2= 0.33,P= 0.002. We excluded Portugal, which reported 0 beta-lactam prescriptions. Error bars represent 95% confidence intervals (CIs). The “best fit” line is from a linear regression, the model line shows the relationship between consumption and resistance in a model with 40 D-types, with clearance rates evenly spaced in the range [0.2,4] and with β= 3,cβ= 1,cμ= 1.075,k= 50 (parameters chosen to approximately replicate the best fit line; SI Appendix, Supporting Text 3). Antibiotic consumption rate (per month; Materials and Methods) was transformed into DDDs by assuming a course of treatment consists of 10 DDDs.
Fig. 5.
Fig. 5.
Relationship between mean duration of carriage and the prevalence of penicillin resistance across serotypes in Massachusetts (n = 16) (A), Malawi (n = 9) (B), and Maela (n = 50) (C). Values of n differ slightly from those given in Table 1 because data for penicillin resistance was missing for some serotypes. Error bars represent 95% CIs. Error is underestimated for duration of carriage in A and B because estimates of uncertainty were not available for all quantities used in making these estimates and for the prevalence of resistance in the Malawi (B) dataset because of uneven serotyping of resistant and sensitive isolates (Materials and Methods).

References

    1. European Centre for Disease Prevention and Control (2015) Antimicrobial Resistance Surveillance in Europe 2015 (European Centre for Disease Prevention and Control, Stockholm).
    1. Goossens H, Ferech M, Vander Stichele R, Elseviers M, ESAC Project Group Outpatient antibiotic use in Europe and association with resistance: a cross-national database study. Lancet. 2005;365(9459):579–587. - PubMed
    1. Taylor J, et al. Model and Results. RAND Corporation; Cambridge, UK: 2014. Estimating the economic costs of antimicrobial resistance.
    1. Chesson P. Mechanisms of maintenance of species diversity. Annu Rev Ecol Syst. 2000;31(1):343–366.
    1. Lipsitch M, Colijn C, Cohen T, Hanage WP, Fraser C. No coexistence for free: neutral null models for multistrain pathogens. Epidemics. 2009;1(1):2–13. - PMC - PubMed

Publication types

MeSH terms