. 2017 Feb 7;114(6):E1009-E1017.
doi: 10.1073/pnas.1610586114. Epub 2017 Jan 17.

A natural product inhibits the initiation of α-synuclein aggregation and suppresses its toxicity

Affiliations

A natural product inhibits the initiation of α-synuclein aggregation and suppresses its toxicity

Michele Perni et al. Proc Natl Acad Sci U S A. .

Erratum in

Abstract

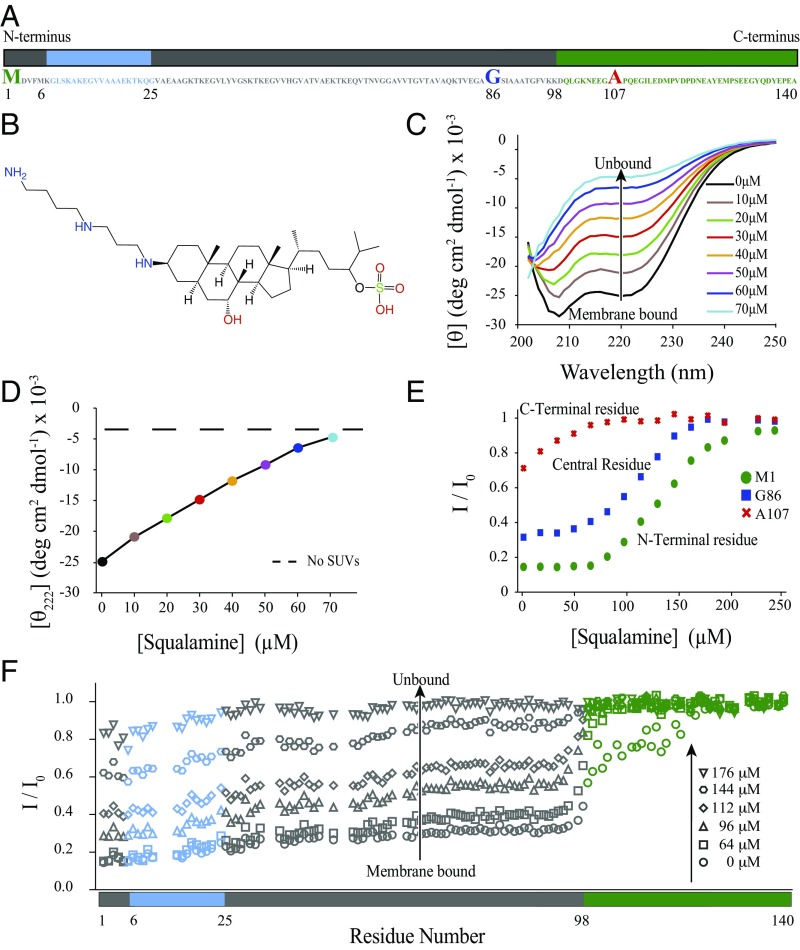
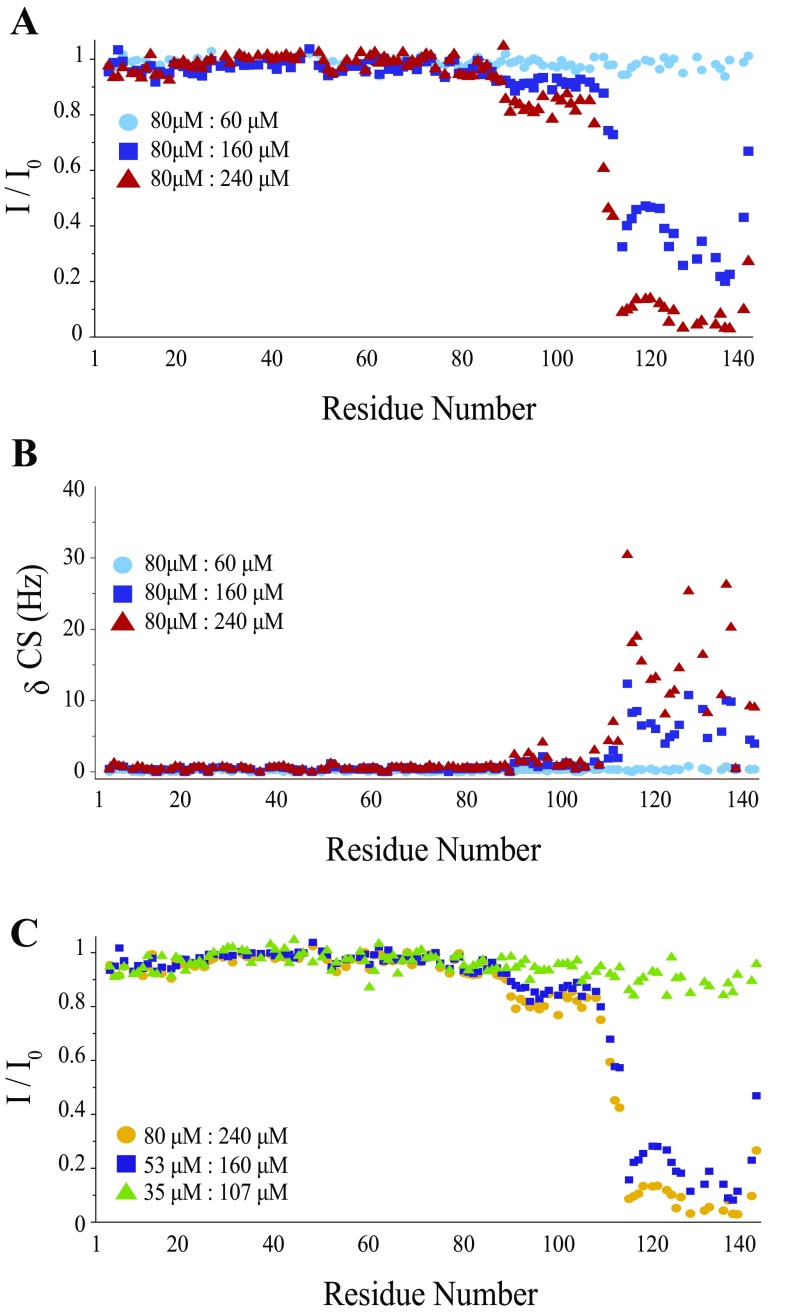
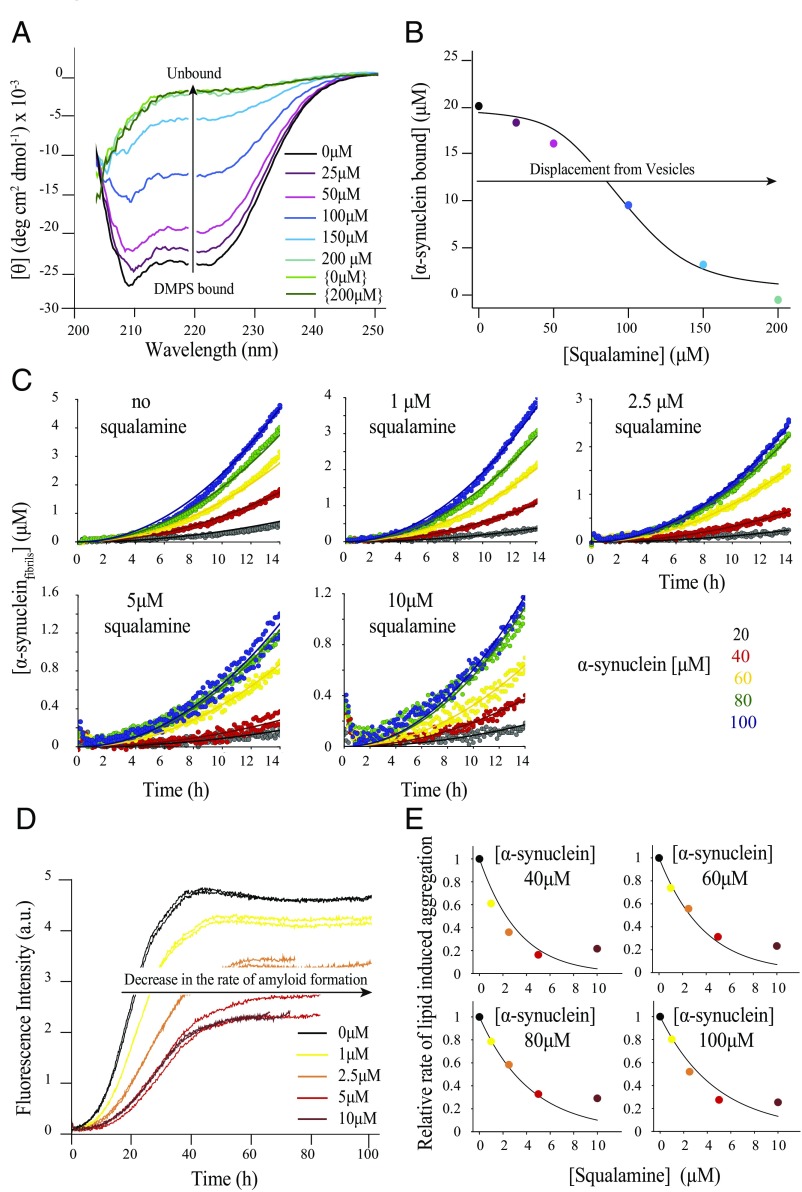
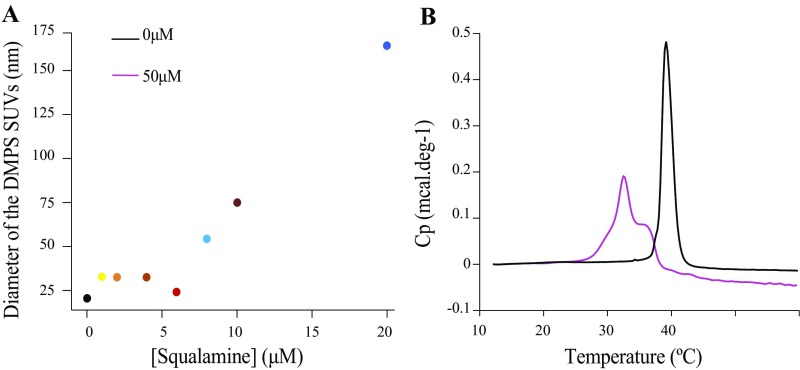
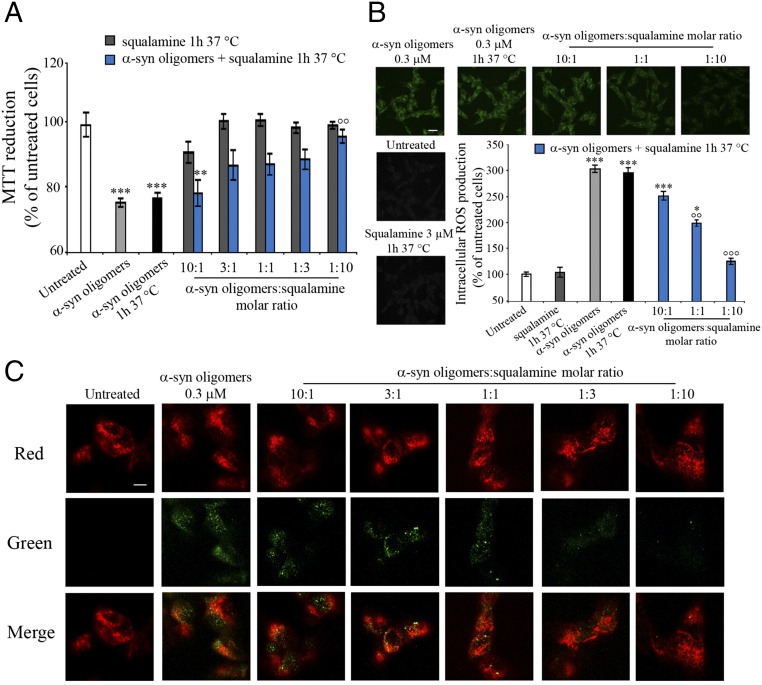
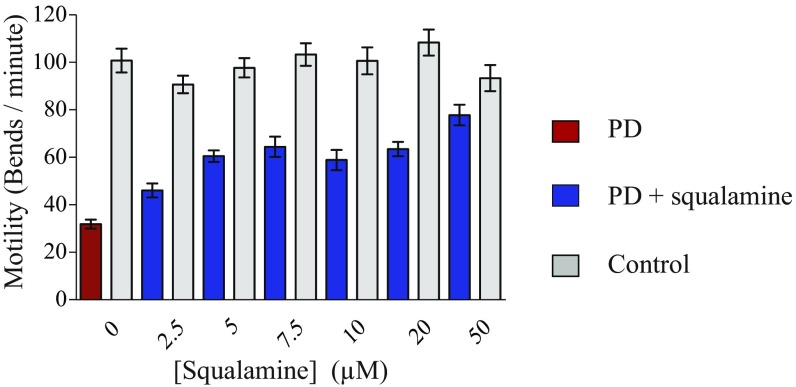
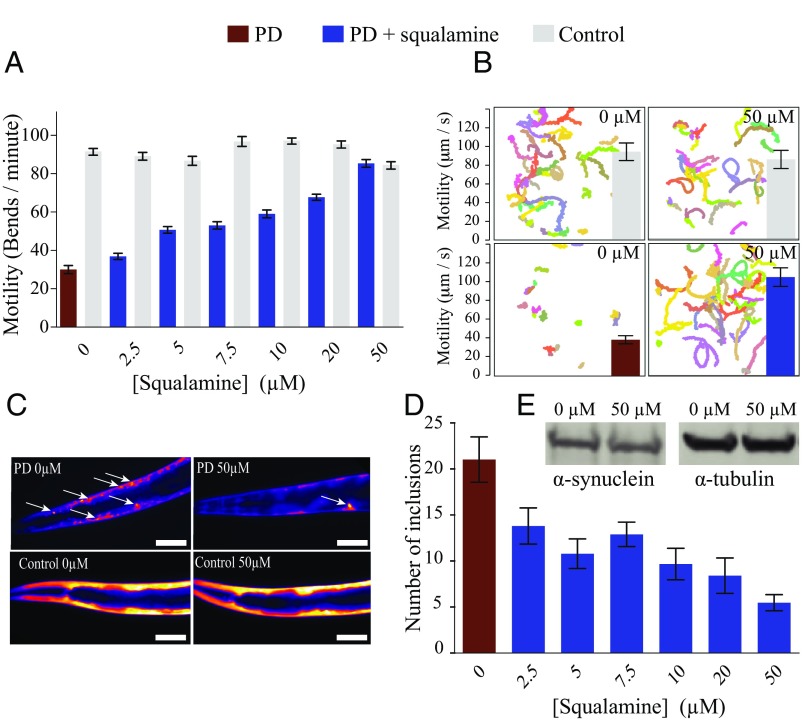
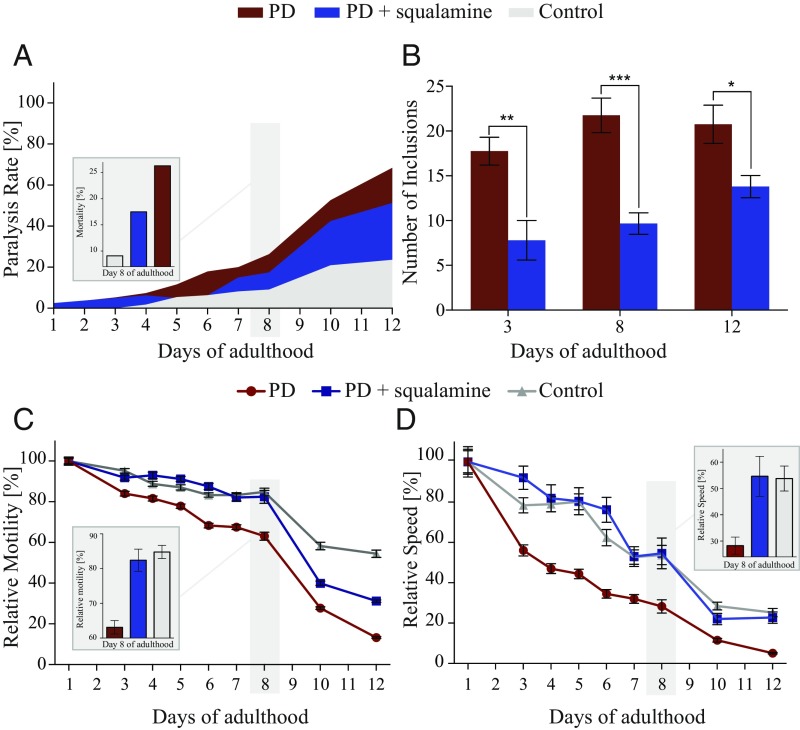
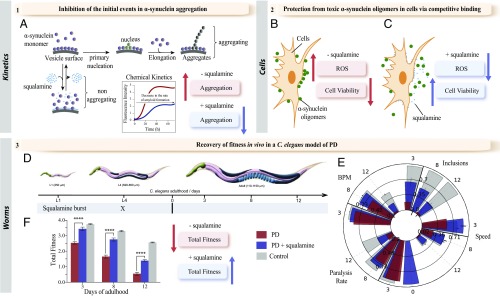
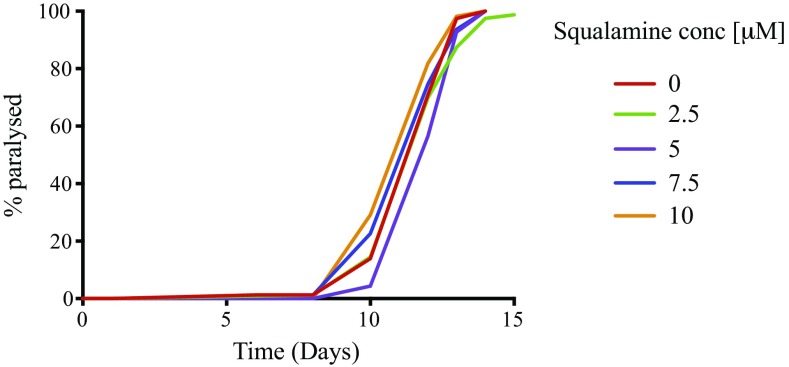
The self-assembly of α-synuclein is closely associated with Parkinson's disease and related syndromes. We show that squalamine, a natural product with known anticancer and antiviral activity, dramatically affects α-synuclein aggregation in vitro and in vivo. We elucidate the mechanism of action of squalamine by investigating its interaction with lipid vesicles, which are known to stimulate nucleation, and find that this compound displaces α-synuclein from the surfaces of such vesicles, thereby blocking the first steps in its aggregation process. We also show that squalamine almost completely suppresses the toxicity of α-synuclein oligomers in human neuroblastoma cells by inhibiting their interactions with lipid membranes. We further examine the effects of squalamine in a Caenorhabditis elegans strain overexpressing α-synuclein, observing a dramatic reduction of α-synuclein aggregation and an almost complete elimination of muscle paralysis. These findings suggest that squalamine could be a means of therapeutic intervention in Parkinson's disease and related conditions.

Keywords: Parkinson’s disease; amyloid formation; drug development; protein aggregation; toxic oligomers.


Conflict of interest statement

M.Z. is the inventor on a patent application that has been filed related to the compound described in this paper. The other authors declare no conflict of interest.

Figures

Fig. 1.
Fig. 1.
Squalamine displaces α-synuclein from DOPS:DOPE:DOPC (30:50:20) vesicles. (A) Amino acid sequence of α-synuclein and its three distinct regions (44), the N-terminal region (blue), the central region (gray), and the C-terminal fragment (green). (B) Structure of squalamine (21). (C and D) Changes in the CD spectrum (C) and the mean residue ellipticity (MRE) (D) at 222 nm of 5 μM α-synuclein in the presence of 1.25 mM DOPS:DOPE:DOPC (30:50:20) vesicles in the absence (black) and presence (colors) of increasing concentrations of squalamine: 10 μM (brown), 20 μM (green), 30 μM (red), 40 μM (orange), 50 μM (violet), 60 μM (blue), and 70 μM (light blue) in 20 mM Tris (pH 7.4) and 100 mM NaCl. The dashed horizontal line in D indicates the MRE at 222 nm of monomeric α-synuclein in the absence of lipids. Nearly complete displacement of α-synuclein is achieved for a lipid:squalamine ratio of about 18:1. (E) Ratios of the α-synuclein NMR peak heights as a function of added squalamine for three residues representative of the three regions of α-synuclein with distinct forms of behavior (11), the N-terminal residue M1 (circles), the central non-Aβ component (NAC) residue G86 (squares), and the C-terminal residue A107 (crosses). (F) Ratios of the NMR peak heights of 100 μM of α-synuclein observed in 1H-15N NMR HSQC spectra in the presence of DOPE:DOPS:DOPC (30:50:20) vesicles (1.25 mM) and different concentrations of squalamine (0 μM, circles; 64 μM, squares; 96 μM, triangles; 112 μM, rhomboids; 144 μM, hexagons; and 176 μM, inverted triangles) relative to peak heights in a spectrum of α-synuclein in the absence of lipids and squalamine. Essentially complete displacement of α-synuclein from lipid membranes is observed at a concentration of squalamine of ca. 200 μM, corresponding to a lipid:squalamine ratio of about 6:1. For all the experiments shown in this figure N-terminally acetylated α-synuclein was used (45).
Fig. S1.
Fig. S1.
Squalamine interacts directly with α-synuclein at high concentrations. (A) Ratios of α-synuclein HSQC peak heights in the presence of different concentrations of squalamine compared with free α-synuclein. The sample contained 80 µM α-synuclein, and three concentrations of squalamine were tested: 60 µM (blue circles), 160 µM (violet squares), and 240 µM (red triangles). The buffer conditions were 20 mM imidazole (pH 6), 100 mM NaCl. (B) Changes in chemical shifts measured at a frequency of 600 MHz 1H resulting from squalamine addition compared with free α-synuclein. δCS was defined as δCS=δCS+(δH2)2, where δN and δH are the changes in resonance frequency (in hertz units) for 15N and 1H, respectively. The sample contained 80 µM α-synuclein, and three concentrations of squalamine were tested: 80 µM (blue circles), 160 µM (violet squares), and 240 µM (red triangles). (C) Ratios of α-synuclein HSQC peak heights are shown for three samples at different concentrations with a fixed squalamine:α-synuclein ratio: 80 µM α-synuclein and 240 µM squalamine (yellow circles), 53 µM α-synuclein and 160 µM squalamine (dark blue squares), and 35 µM α-synuclein and 107 µM squalamine (green triangles).
Fig. 2.
Fig. 2.
Squalamine inhibits α-synuclein aggregation via competitive binding with lipid membranes. (A) Changes in the CD spectrum of 20 μM α-synuclein in the presence of 1 mM DMPS and in the absence (black) or presence (colors) of increasing concentrations of squalamine: 25 μM (violet), 50 μM (pink), 100 μM (blue), 150 μM (light blue), and 200 μM (aqua). The spectrum of α-synuclein in the absence of both DMPS and squalamine is shown in light green and the CD spectrum of α-synuclein in the absence of DMPS and the presence of 200 μM squalamine is shown in dark green. Essentially complete displacement of the protein from the membrane was observed for a squalamine:lipid ratio of about 1:5. (B) Changes in the concentration of α-synuclein bound to DMPS vesicles with increasing concentrations of squalamine. The data are well described by a competitive binding model with KD,α and Lα [0.5 μM and 30 μM, respectively (12)], and the fit yields KD,S = 67 nM and LS = 7.3, respectively (SI Materials and Methods for details). (C) Global fits of the early time points in the kinetic traces of α-synuclein aggregation at increasing concentrations of squalamine. For each dataset, the concentration of DMPS is 100 μM and that of α-synuclein is 20 μM (black), 40 μM (red), 60 μM (yellow), 80 μM (green), and 100 μM (blue). The squalamine concentration used was 0 μM, 1 μM, 2.5 μM, 5 μM, and 10 μM. (D) Changes in thioflavin-T (ThT) fluorescence when 100 μM α-synuclein was incubated with 100 μM DMPS vesicles in the presence of increasing concentrations of squalamine: 0 μM (black), 1 μM (yellow), 2.5 μM (orange), 5 μM (red), and 10 μM (brown). All data were acquired under quiescent conditions at 30 °C and duplicate runs are shown. (E) Variation in the relative rate of lipid-induced aggregation of α-synuclein with increasing concentrations of squalamine (0 μM, black; 1 μM, yellow; 2.5 μM, orange; 5 μM, red; and 10 μM, brown). The solid line is the corresponding global fit using a competitive binding model (SI Materials and Methods for details) with only one free parameter, nb (the reaction order of the lipid-induced aggregation with respect to the fraction of the protein bound), which was found to be 5.5.
Fig. S2.
Fig. S2.
Effect of squalamine on the size and the thermotropic properties of DMPS vesicles. (A) Change in the diameter of DMPS vesicles (100 µM) with increasing concentrations of squalamine measured by dynamic light scattering. (B) Differential scanning calorimetry trace of 500 µM DMPS in the absence and presence of 50 µM squalamine.
Fig. S3.
Fig. S3.
Squalamine binding to Aβ and α-synuclein fibrils. (A) Total ion current (TIC) of 10 µM squalamine (Top), TIC corresponding to the supernatant fraction after incubation with Aβ (Middle), and α-synuclein fibrils (Bottom), respectively. Experiments were carried out in triplicate and one representative experiment is shown. (B) TIC averaged over three independent experiments. (C) Peak area averaged over three independent experiments. α-Synuclein and Aβ fibrils were obtained as previously described (10, 13) and incubated overnight with 10 µM squalamine.
Fig. 3.
Fig. 3.
Squalamine suppresses the toxicity of α-synuclein oligomers in human neuroblastoma cells by inhibiting their binding to the cell membranes. (A) Effects of squalamine on α-synuclein oligomer-induced MTT reduction in SH-SY5Y cells. α-Synuclein oligomers (23, 24) were resuspended in the cell culture medium at a concentration of 0.3 μM, incubated with or without increasing concentrations (0.03 µM, 0.1 µM, 0.3 µM, 1.0 µM, and 3.0 µM) of squalamine for 1 h at 37 °C under shaking conditions, and then added to the cell culture medium of SH-SY5Y cells for 24 h. The cells were also treated with squalamine preincubated in the absence of oligomers for 1 h at 37 °C under shaking conditions. **P ≤ 0.01 and ***P ≤ 0.001, respectively, relative to untreated cells and °°P ≤ 0.01 relative to cells treated with α-synuclein oligomers. (B) Representative confocal scanning microscope images of SH-SY5Y cells showing the effect of squalamine on α-synuclein oligomer-induced ROS production. α-Synuclein oligomers were resuspended in the cell culture medium at a concentration of 0.3 μM, incubated with or without increasing concentrations (0.03 µM, 0.3 µM, and 3.0 µM) of squalamine for 1 h at 37 °C under shaking conditions, and then added to the cell culture medium of SH-SY5Y cells for 15 min. The cells were also treated with 3 µM squalamine preincubated without oligomers for 1 h at 37 °C while shaking. The green fluorescence arises from the 2′,7′-dichlorodihydrofluorescein diacetate (CM-H2DCFDA) probe that has reacted with ROS. (Scale bar, 30 μm.) *P ≤ 0.05, **P ≤ 0.01, and ***P ≤ 0.001, respectively, relative to untreated cells. °°P ≤ 0.01 and °°°P ≤ 0.001, respectively, relative to untreated cells and the symbol °° indicates P ≤ 0.01 relative to cells treated with α-synuclein oligomers. (C) Representative confocal scanning microscopy images of the apical sections of SH-SY5Y cells treated for 15 min with α-synuclein oligomers (0.3 µM) and increasing concentrations (0.03 µM, 0.1 µM, 0.3 µM, 1.0 µM, and 3.0 µM) of squalamine. Red and green fluorescence indicates the cell membranes and the α-synuclein oligomers, respectively. (Scale bar, 10 μm.)
Fig. S4.
Fig. S4.
Squalamine recovers the severe muscle paralysis associated with overexpression of α-synuclein in PD worms (25). For experiments carried out in solid media, the protective effect is maximal at day 4 for 50 µM squalamine. Red bars, PD; blue bars, treated PD; gray bars, controls. The plots show one representative of three experiments. Error bars represent the SEM.
Fig. 4.
Fig. 4.
Squalamine inhibits the formation of α-synuclein inclusions and the consequent muscle paralysis associated with the overexpression of this protein in a C. elegans model of PD. (A) Recovery of the normal phenotype at day 4 of adulthood for PD worms (red bars) and for worms expressing α-synuclein (blue bars) compared with control worms (gray bars) as the concentration of squalamine was raised to 50 µM. The data were obtained using an automated body bend assay; the plot shows one representative dataset of three independent experiments that gave very similar results. (B) Swimming tracks representative of the movement of PD and control worms over a time period of 1 min, without and with squalamine. Tracks corresponding to the movement of different animals are represented in different colors. The motility (speed of movement and body bends) of the PD worms can be seen to be greatly enhanced after exposure to 50 µM squalamine. Red bars, PD worms; blue bars, treated PD worms; gray bars, control worms. The error bars represent the SEM. (C) Representative images, showing a substantial decrease in the number of inclusions in PD worms in the presence of 50 µM squalamine, whereas the YFP expression pattern in control worms is not affected. All measurements were carried out at day 12 of adulthood. (Scale bars, 70 µm.) Inclusions are indicated with white arrows. (D) Reduction in the number of α-synuclein inclusions in PD worms, in the presence of squalamine. Fifty animals were analyzed in total. Red bar, PD worms; blue bars, treated PD worms. (E) Western blot analysis of protein extracts from day 12 PD worms showing similar expression levels of α-synuclein and α-tubulin (loading control) in the absence and presence of 50 µM squalamine.
Fig. 5.
Fig. 5.
Squalamine greatly improves the fitness of PD worms (25) and reduces α-synuclein aggregation over time. (A) The administration of 10 µM squalamine decreased substantially the paralysis rate of PD worms. Red, PD worms; blue, treated PD worms; gray, control worms. (B) The aggregation of α-synuclein in PD animals treated with 10 µM squalamine is greatly decreased compared with that in untreated worms; the plots show one representative of three experiments. Error bars represent the SEM. Red bars, PD worms; blue bars, treated PD worms. (C and D) Exposure to 10 µM squalamine greatly improves the thrashing (C) and speed (D) of the PD worms over 12 d. Insets show details of relative motility, thrashing, and speed, respectively, for day 8. Red lines, PD worms; blue lines, treated PD worms; gray lines, control worms.
Fig. 6.
Fig. 6.
Schematic illustration of the drug discovery strategy used in this work. (A) We used a wide range of biophysical techniques, including chemical kinetics, to study quantitatively the effects of squalamine on α-synuclein aggregation in vitro and we observed that squalamine affects the binding of α-synuclein to lipid membranes and inhibits the initial events in its aggregation. (B and C) By using the protocols that we recently developed to isolate oligomers of α-synuclein toxic to human cells (23, 24), we have shown that squalamine inhibits dramatically the mitochondrial dysfunction and cellular ROS production induced by the oligomers of α-synuclein (23, 24). (D–F) We further validated our results in vivo by using a well-established C. elegans model of PD (25), and we found that administration of a single dose of squalamine at the larval stage L4 (D) abolishes α-synuclein aggregation and its associated toxicity in vivo over several days (E) and increases the total fitness of the PD worms (F).
Fig. S5.
Fig. S5.
Exposure to squalamine has less relevant effects on an Aβ worm model. Squalamine administration at a concentration of 1–10 µM had no significant protective effect (e.g., no decrease in the time of the onset of the paralysis) for an Aβ worm model CL2006 (40). The plots show one representative of three experiments.

Comment in

References

    1. Breydo L, Wu JW, Uversky VN. Α-synuclein misfolding and Parkinson’s disease. Biochim Biophys Acta. 2012;1822(2):261–285. - PubMed
    1. Dettmer U, Selkoe D, Bartels T. New insights into cellular α-synuclein homeostasis in health and disease. Curr Opin Neurobiol. 2016;36:15–22. - PubMed
    1. Spillantini MG, Crowther RA, Jakes R, Hasegawa M, Goedert M. alpha-Synuclein in filamentous inclusions of Lewy bodies from Parkinson’s disease and dementia with lewy bodies. Proc Natl Acad Sci USA. 1998;95(11):6469–6473. - PMC - PubMed
    1. Dawson TM, Dawson VL. Molecular pathways of neurodegeneration in Parkinson’s disease. Science. 2003;302(5646):819–822. - PubMed
    1. Knowles TPJ, Vendruscolo M, Dobson CM. The amyloid state and its association with protein misfolding diseases. Nat Rev Mol Cell Biol. 2014;15(6):384–396. - PubMed

Publication types

MeSH terms