. 2017 Jan 31;114(5):E761-E770.
doi: 10.1073/pnas.1620433114. Epub 2017 Jan 17.

Mitochondrial activation chemicals synergize with surface receptor PD-1 blockade for T cell-dependent antitumor activity

Affiliations

Mitochondrial activation chemicals synergize with surface receptor PD-1 blockade for T cell-dependent antitumor activity

Kenji Chamoto et al. Proc Natl Acad Sci U S A. .

Abstract

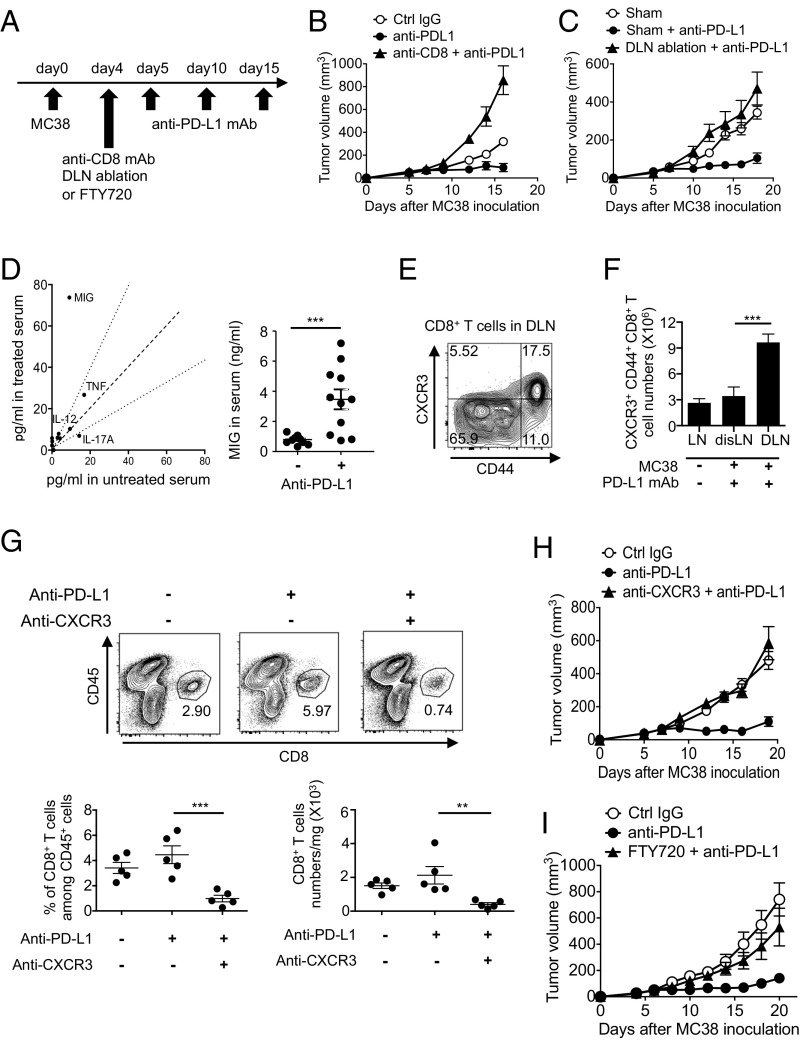
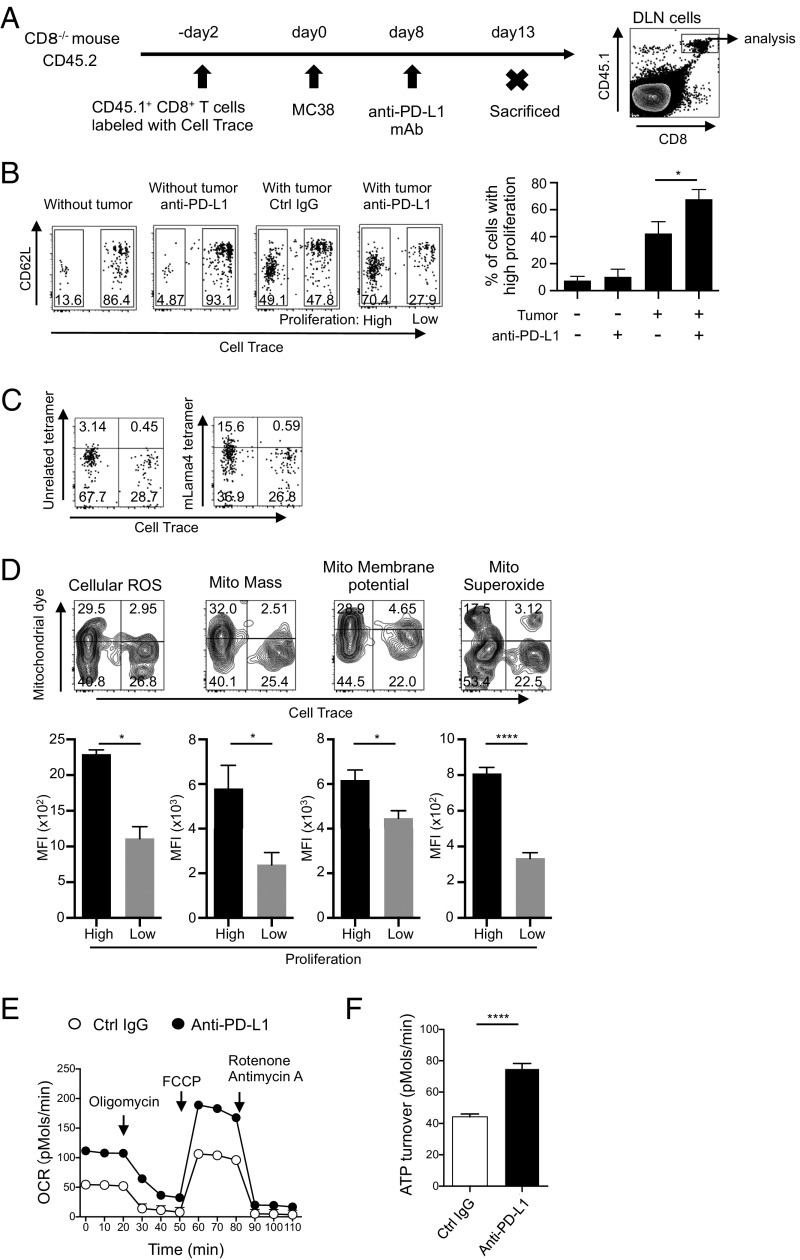
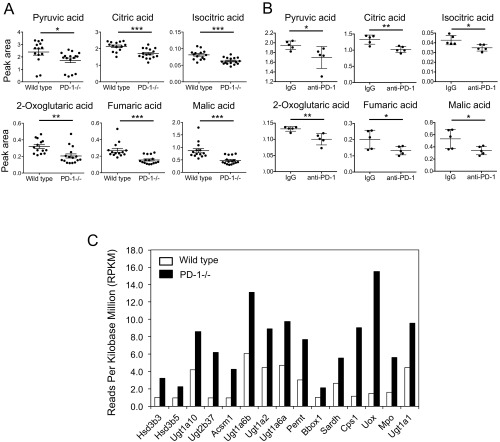
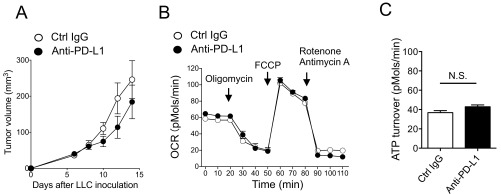
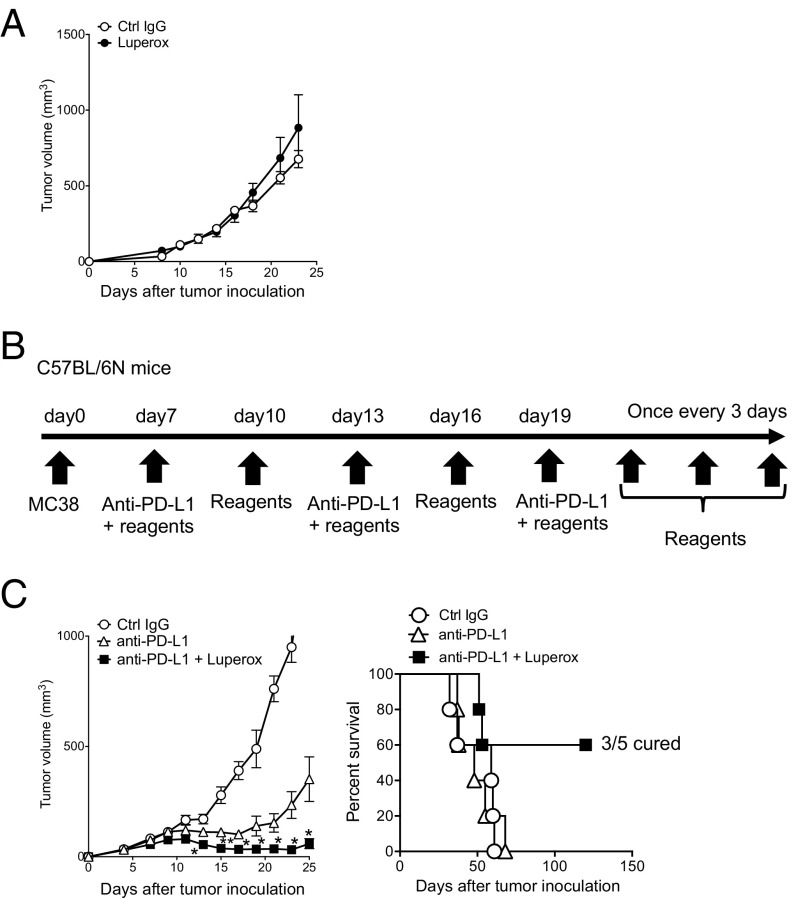
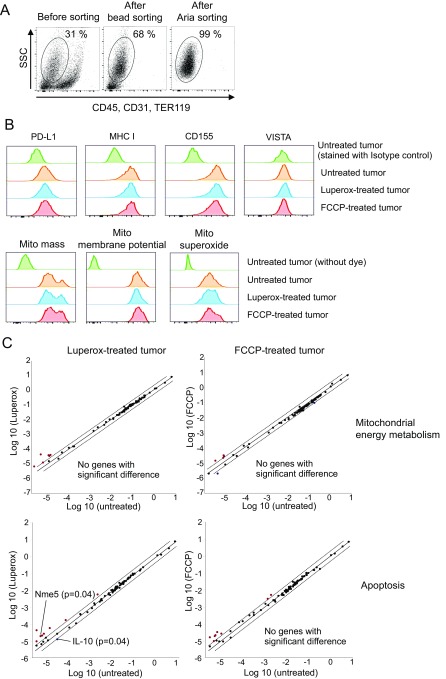
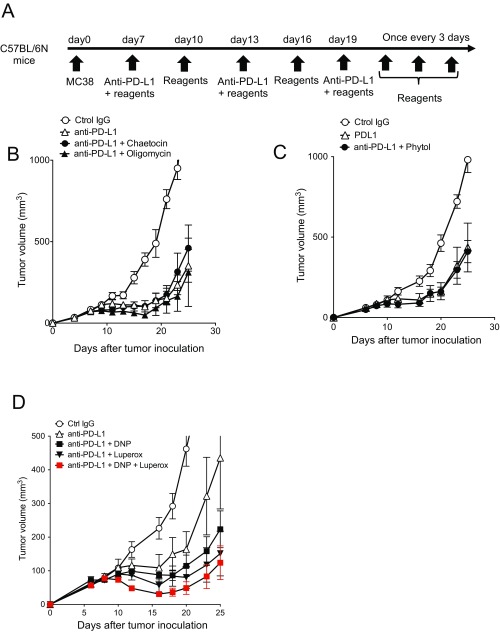
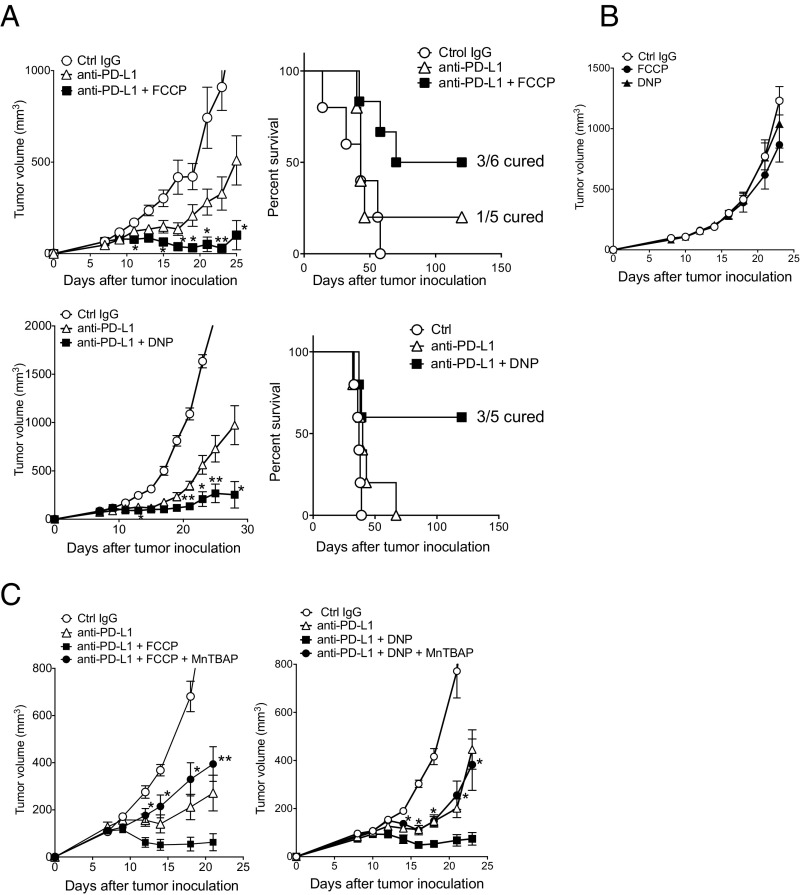
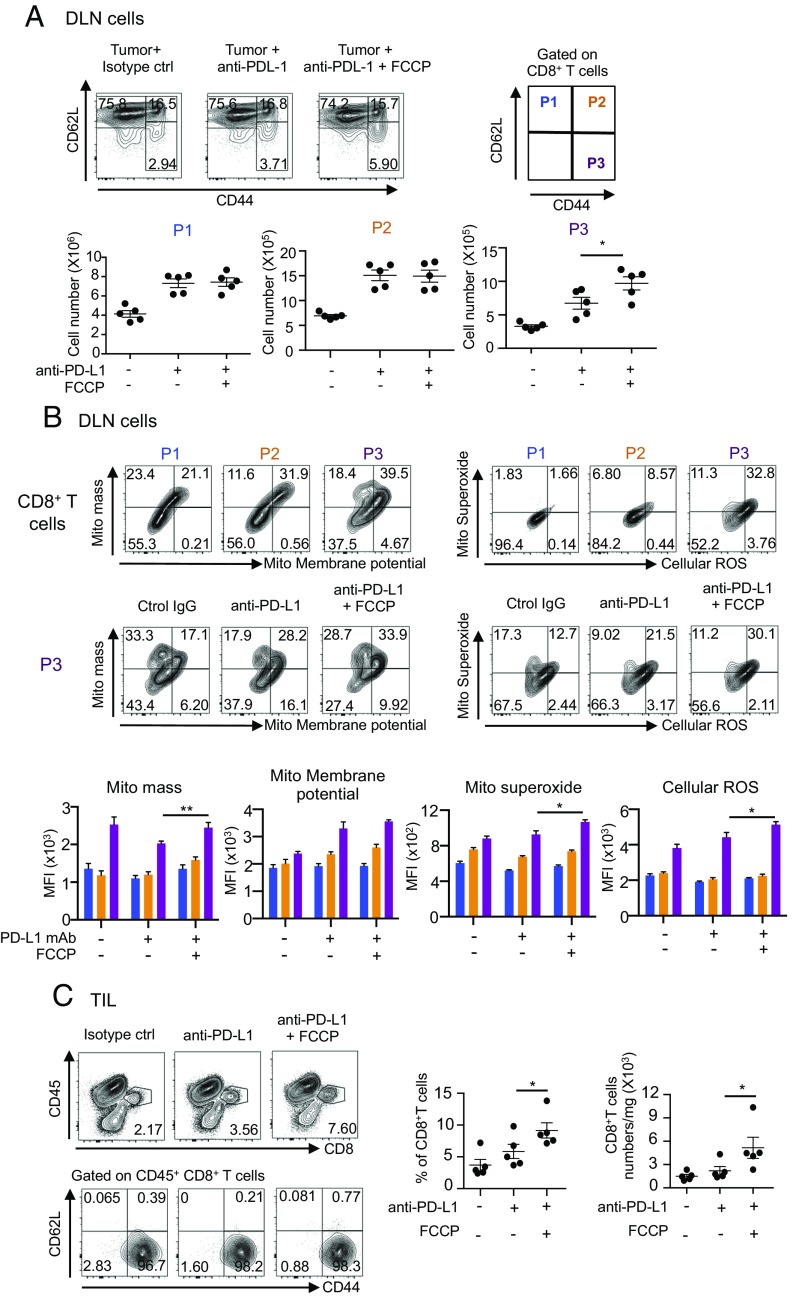
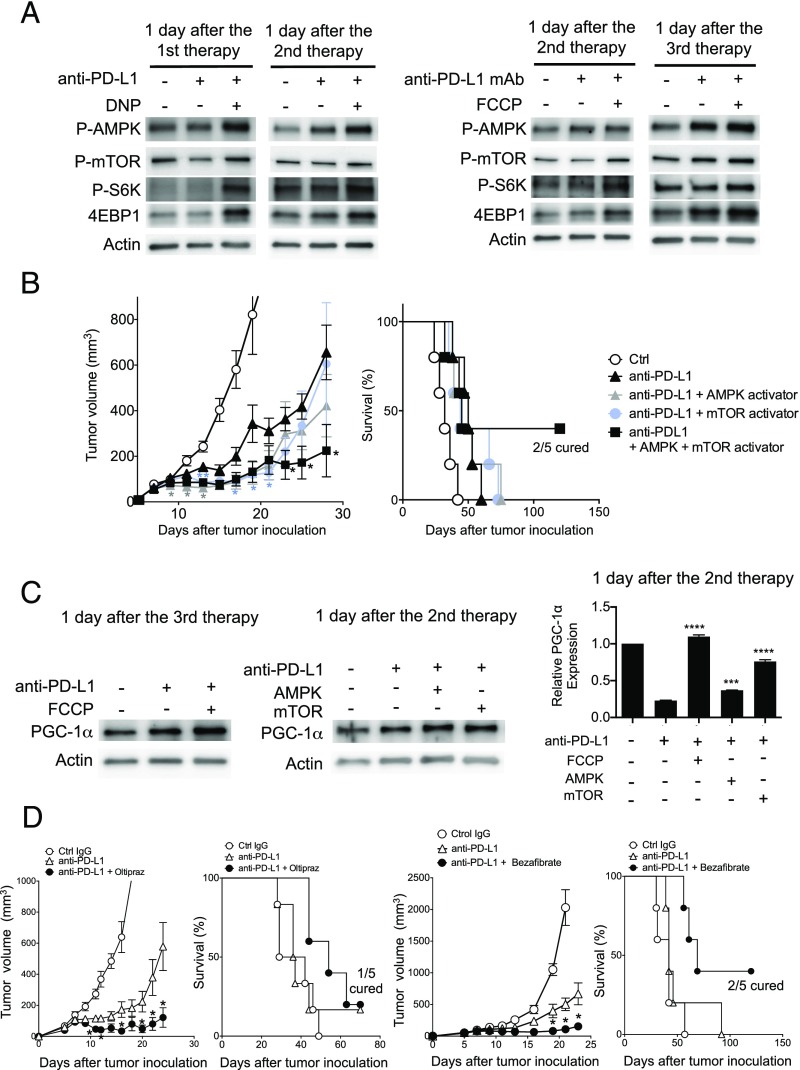
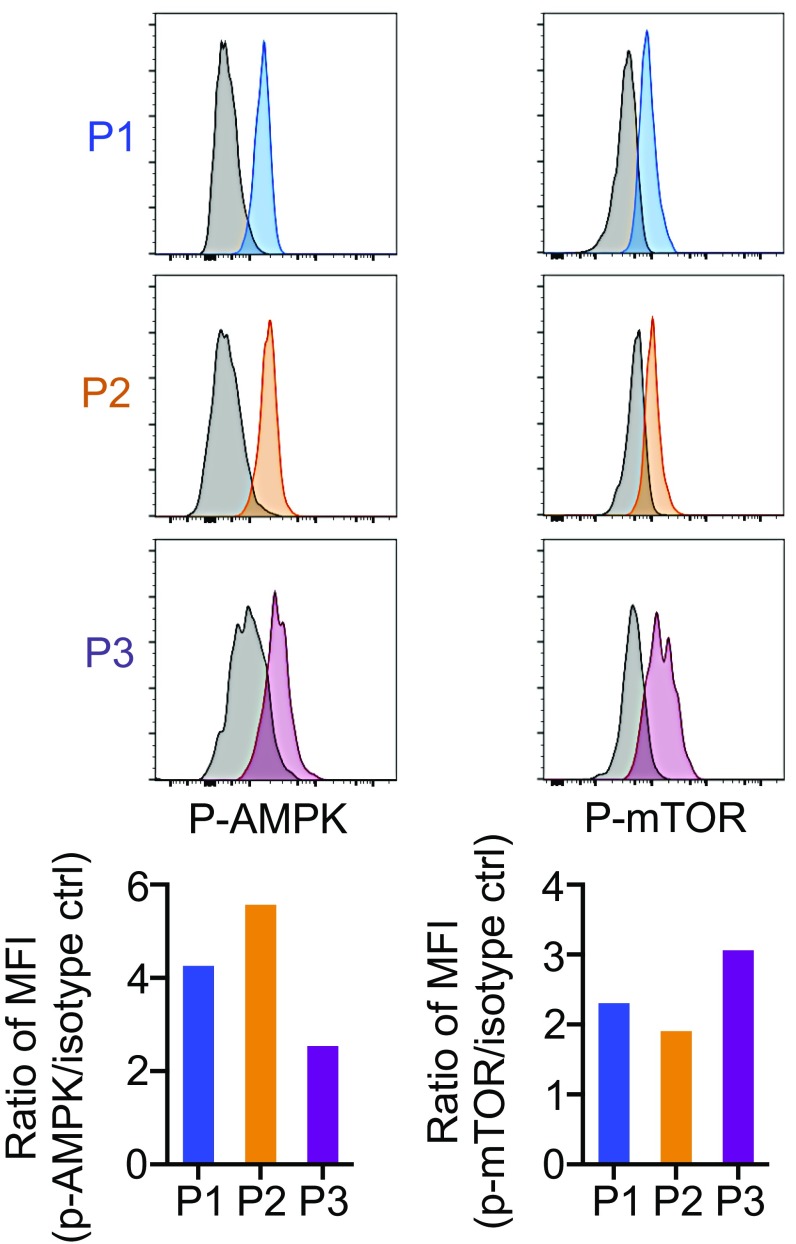
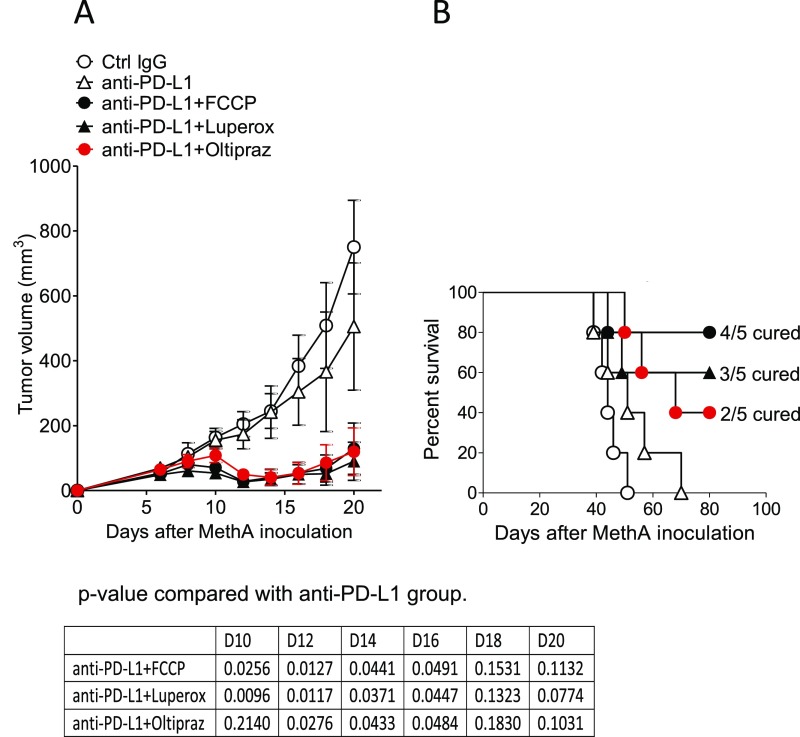
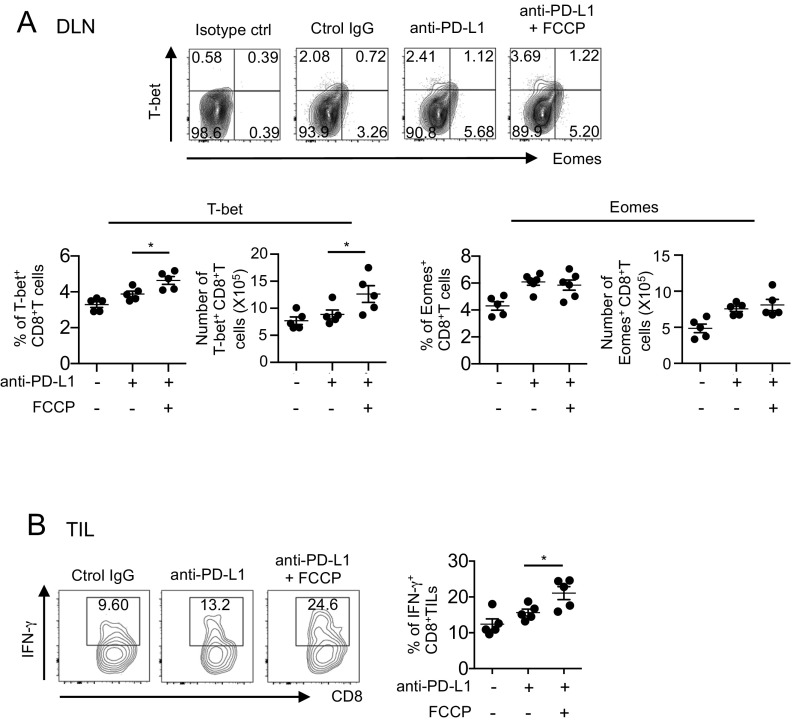
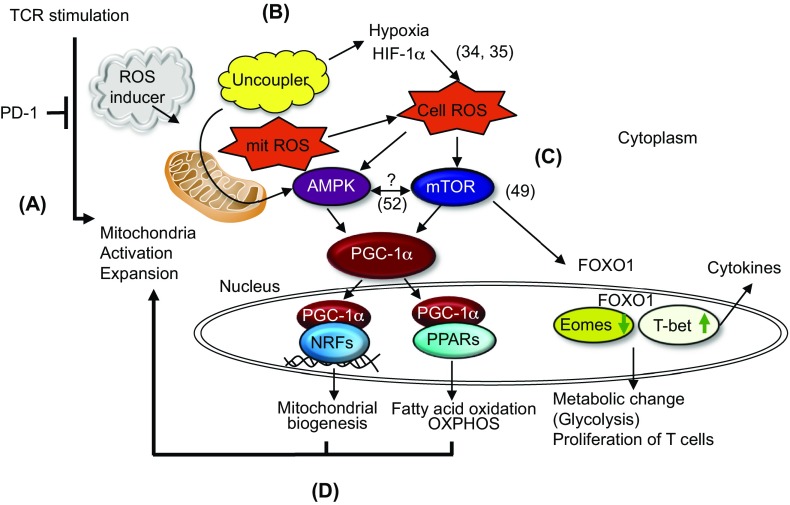
Although immunotherapy by PD-1 blockade has dramatically improved the survival rate of cancer patients, further improvement in efficacy is required to reduce the fraction of less sensitive patients. In mouse models of PD-1 blockade therapy, we found that tumor-reactive cytotoxic T lymphocytes (CTLs) in draining lymph nodes (DLNs) carry increased mitochondrial mass and more reactive oxygen species (ROS). We show that ROS generation by ROS precursors or indirectly by mitochondrial uncouplers synergized the tumoricidal activity of PD-1 blockade by expansion of effector/memory CTLs in DLNs and within the tumor. These CTLs carry not only the activation of mechanistic target of rapamycin (mTOR) and AMP-activated protein kinase (AMPK) but also an increment of their downstream transcription factors such as PPAR-gamma coactivator 1α (PGC-1α) and T-bet. Furthermore, direct activators of mTOR, AMPK, or PGC-1α also synergized the PD-1 blockade therapy whereas none of above-mentioned chemicals alone had any effects on tumor growth. These findings will pave a way to developing novel combinatorial therapies with PD-1 blockade.

Keywords: PD-1; PGC-1α; cancer immunotherapy; immune metabolism; mitochondria.


Conflict of interest statement

The authors declare no conflict of interest.

Figures

Fig. 1.
Fig. 1.
CD8+ T-cell priming in DLNs and their trafficking to tumor sites via the MIG/CXCR3 pathway. (A) MC38-bearing mice were treated with PD-L1 mAb on days 5, 10, and 15. (B and C) Tumor sizes of mice with CD8+ T-cell depletion (B) or DLN ablation (C) on day 4 are shown. Data represent the means ± SEM of five mice. (D) Cytokine and chemokine levels in the serum 1 d after the second therapy were detected by bead array. Data are representative of three mice (Left). MIG level in the serum was measured by ELISA. Data represent the means ± SEM of 11 mice. ***P < 0.001, two-tailed Student t test (Right). (E) CD8+ T cells of DLNs 1 d after the second therapy were stained with anti-CD44 mAb and anti-CXCR3 mAb. (F) The numbers of CXCR3+ CD44+ CD8+ T cells in distal LNs (disLNs) or DLNs of PD-L1 mAb-treated mice were calculated 1 d after the second therapy. Numbers of CXCR3+ CD44+ CD8+ T cells in LNs of tumor-free mice were used as a control (LN). ***P < 0.001, one-way ANOVA analysis. (G) Cells isolated from tumor mass 1 d after the second therapy were stained with anti-CD45 mAb and anti-CD8 mAb (Upper). The frequency of CD8+ T cells among CD45+ cells and number of CD8+ T cells per mg of tumor tissue were calculated (Lower). Data represent the means ± SEM of five mice. **P < 0.01, ***P < 0.001, one-way ANOVA analysis. (H) Tumor sizes of mice treated with anti–PD-L1 mAb along with anti-CXCR3 mAb on days 5 and 10 are shown. Data represent the means ± SEM of five mice. (I) Tumor sizes of mice treated with anti–PD-L1 mAb and FTY720. FTY720 was injected on day 4 and every 2 d for 3 wk. Data represent the means ± SEM of five mice. Data are representative of two independent experiments.
Fig. 2.
Fig. 2.
Mitochondrial activation in TR CTLs by PD-1 blockade in vivo. (A) A schematic diagram of the experimental schedule. (BD) CellTrace-labeled CD45.1+ CD8+ T cells were transferred into CD45.2+ CD8−/− mice. The mice were inoculated with MC38 and treated with PD-L1 mAb on day 8. CD8+ CD45.1+ T cells in DLNs were gated and analyzed. (B) Intensities of CD62L and CellTrace among the gate are shown (Left). The frequencies of highly proliferating cells were compared between groups. Data represent the means ± SEM of four or five mice. *P < 0.05, one-way ANOVA analysis (Right). (C) Among the gated cells shown in A, the positivity of CellTrace and MHC tetramer loaded with mLama4 peptide or an unrelated peptide was analyzed in the group treated with PD-L1 mAb. (D) DLN cells of PD-L1 mAb-treated mice were stained with dyes indicating mitochondrial activities. Representative FACS data of the gated population (A) are shown (Upper). The median of fluorescence intensity (MFI) of each dye was compared between highly proliferating (high) and less proliferating (low) populations. Data represent the means ± SEM of five mice. *P < 0.05, ****P < 0.0001, two-tailed Student t test (Lower). Data are representative of three independent experiments (AD). (E and F) MC38-bearing wild-type mice were treated with the same schedule as in Fig. 1A. The oxygen consumption rate of DLN CD8+ T cells isolated from treated or untreated mice was measured by the Seahorse XFe96 analyzer. Cells were mixed from three mice 2 d after the second therapy (E). ATP turnover defined as (last rate measurement before oligomycin) − (minimum rate measurement after oligomycin injection) was calculated (F). Data represent the means ± SEM of six wells. ****P < 0.0001, two-tailed Student t test. Data are representative of two independent experiments.
Fig. S1.
Fig. S1.
Mitochondrial activation in PD-1 blockade conditions. (A) The tricarboxylic acid cycle-associated metabolites in sera of wild-type and PD-1−/− mice were measured by gas-chromatography-mass spectrometry. The levels of the metabolites indicated were compared. Data represent the means ± SEM of 14 to 16 mice. *P < 0.05, **P < 0.01, ***P < 0.001, two-tailed Student t test. (B) MC38-bearing mice were treated with PD-1 mAb (4H2) according to the schedule described in Fig. 1A. TCA-associated metabolites were measured in sera harvested on day 13. *P < 0.05, **P < 0.01, two-tailed Student t test. (C) RNA extracted from lymph nodes of wild-type and PD-1−/− mice was subjected to RNA sequencing to compare the expression levels of genes associated with mitochondrial activity. The same amounts of RNA from seven individual mice were pooled. The mitochondria-related genes were selected using Gene Ontology GOterm_Cellular Component (CC)_FAT.
Fig. S2.
Fig. S2.
Lack of mitochondrial activation of CTLs in the therapy of unresponsive tumor cells (LLC). (A) LLC-bearing mice were treated with PD-L1 mAb with the same schedule as in Fig. 1A. (B) OCRs of DLN CD8+ T cells isolated from treated or untreated mice were measured by Seahorse XFe96 analyzer. Cells were mixed from three mice 2 d after the second therapy. (C) ATP turnover defined as (last rate measurement before oligomycin) − (minimum rate measurement after oligomycin injection) was calculated. Data represent the means ± SEM of six wells. N.S., no significant difference, two-tailed Student t test.
Fig. 3.
Fig. 3.
Synergistic effect of Luperox, a ROS generator, with PD-L1 mAb therapy. (A) tert-butyl hydroperoxide solution (Luperox) treatment was conducted from day 7 every 3 d for 3 wk. Tumor sizes are shown. Data represent the means ± SEM of five mice. (B) Schematic diagram of the combination therapy schedule. (C) Following the schedule of B, mice were treated with PD-L1 mAb and the chemicals indicated. Tumor sizes and/or survival rates are shown. Data represent the means ± SEM of five mice. *P < 0.05, **P < 0.01, two-tailed Student t test (anti–PD-L1 vs. anti–PD-L1 + Luperox). Data are representative of two independent experiments.
Fig. S3.
Fig. S3.
Luperox and FCCP have little effect on tumor cells in vivo. (A) Tumor tissues were harvested 1 d after the second injection of FCCP or Luperox alone. After digestion, tumor cells were negatively sorted by a tumor cell isolation kit that can exclude lymphocytes, red blood cells, fibroblasts, endothelial cells, and tumor-associated stromal cells. Isolated tumor cells were further purified by FACSAria-guided sorting and used for the following experiments. (B) Tumor cells were stained with antibodies targeting PD-L1, MHC class I, CD155 (ligand of TIGIT), and VISTA or with dyes for mitochondrial mass, membrane potential, and superoxide. (C) Expression levels of genes associated with mitochondrial energy metabolism and apoptosis were examined using RT2 Profiler PCR Array Kits. Named genes were significantly up-regulated more than twofold compared with untreated tumor cells among 84 genes. Other genes loaded on the array plates are mentioned in SI Methods.
Fig. S4.
Fig. S4.
Synergistic or nonsynergistic effects of certain mitochondrial activation-associated chemicals. (A) Schematic diagram of the combinational therapy schedule. (B) Mice were treated with PD-L1 mAb and chaetocin or oligomycin. The mice treated with control IgG and anti–PD-L1 mAb were shared with Fig. 3C. (C) MC38 mice were treated with anti–PD-L1 mAb and phytol. (D) Mice were treated with PD-L1 mAb along with DNP, Luperox, or both. Data represent the means ± SEM of five or six mice. Data are representative of two independent experiments.
Fig. 4.
Fig. 4.
Synergistic effect of uncouplers is mediated by ROS. (A) MC38-bearing mice were treated with PD-L1 mAb along with FCCP or DNP with the same schedule as shown in Fig. 3B. Tumor sizes and/or survival rates are shown. Data represent the means ± SEM of five or six mice. *P < 0.05, **P < 0.01, two-tailed Student t test (anti–PD-L1 vs. anti–PD-L1 + FCCP or DNP). (B) MC38-bearing mice were treated with FCCP or DNP alone with the same schedule as in A. Tumor sizes are shown. Data represent the means ± SEM of five mice. (C) MC38-bearing mice were treated with PD-L1 mAb and FCCP (Left) or DNP (Right) along with a ROS scavenger (MnTBAP). Data represent the means ± SEM of four or five mice. *P < 0.05, **P < 0.01, two-tailed Student t test (combination therapy vs. combination therapy + MnTBAP). The mice of the control IgG group in DNP combination therapy (Right) were shared with those of B. Data are representative of two independent experiments.
Fig. 5.
Fig. 5.
Increase in the number of effector CD8+ T cells by FCCP addition. (A) MC38-bearing mice were treated with PD-L1 mAb and FCCP with the same schedule as shown in Fig. 3B. DLN cells on day 14 were stained with anti-CD8, -CD62L, and -CD44 mAb, and CD8+ T cells were gated. P1 to P3 populations were defined according to CD62L and CD44 positivity (Upper). The absolute numbers of P1 to P3 were calculated (Lower). Data represent the means ± SEM of five mice. *P < 0.05, one-way ANOVA analysis. (B) Representative FACS profiles of P1 to P3 stained with each mitochondrial dye in mice treated with PD-L1 mAb and FCCP (Upper). Representative FACS profiles of the P3 population stained with each mitochondrial dye in each group (Middle). MFI of P1 to P3 stained with each dye was compared between treated groups. Colors correspond to the P1 to P3 populations. Data represent the means ± SEM of five mice (Lower). *P < 0.05, **P < 0.01, one-way ANOVA analysis. (C) Cells isolated from the tumor mass on day 11 were stained with anti-CD8, -CD45, -CD62L, and -CD44 mAb. CD45+ CD8+ T cells were gated and their CD62L and CD44 phenotypes were analyzed (Left). The frequencies of CD8+ T cells among CD45+ T cells and the numbers of CD45+ CD8+ T cells were compared between groups (Right). Data represent the means ± SEM of five mice. *P < 0.05, one-way ANOVA analysis. FACS data are representative of five mice in each group. Data are representative of two independent experiments.
Fig. 6.
Fig. 6.
Involvement of the mTOR and AMPK pathways for the synergistic effects of uncouplers and PD-L1 mAb. (A) CD8+ T cells were isolated from the pooled DLN cells of five mice at the indicated time points of the DNP or FCCP combination therapy scheduled as in Fig. 3B. Phosphorylation of AMPK, mTOR, and S6K and the expression of 4EBP1 were analyzed by Western blotting with the indicated antibodies. (B) MC38-bearing mice were treated with PD-L1 mAb along with AMPK activator (A769662) and/or mTOR activator (MHY1485). Tumor sizes and survival rates are shown. Data represent the means ± SEM of five mice. *P < 0.05, **P < 0.01, two-tailed Student t test (anti–PD-L1 mAb vs. each combination therapy). Each color of asterisk corresponds to the group indicated by the same color. (C) PGC-1α expression levels were examined by Western blotting and quantitative PCR (qPCR) in DLN CD8+ T cells treated with PD-L1 mAb along with FCCP, AMPK activator, or mTOR activator. Mice were killed on the indicated day and CD8+ T cells were pooled from five mice. Data represent the means ± SEM of three wells, assuming the untreated group equals 1 in the qPCR analysis. The expression level of each group was compared with the PD-L1–treated group. ***P < 0.001, ****P < 0.0001, one-way ANOVA analysis. (D) MC38-bearing mice were treated with PD-L1 mAb along with NRF2 activator (oltipraz) or PPAR activator (bezafibrate). Tumor sizes and survival rates are shown. Data represent the means ± SEM of five mice. *P < 0.05, two-tailed Student t test (anti–PD-L1 mAb vs. each combination therapy).
Fig. S5.
Fig. S5.
Distinctive activation of mTOR and AMPK depending on the differentiation stage of CD8+ T cells. MC38-bearing mice were treated with PD-L1 mAb along with DNP. One day after the first therapy, DLN cells were stained with antibody against CD8, CD62L, CD44, p-mTOR, and p-AMPK. After gating on P1 to P3 as shown in Fig. 5A, the intensity of p-AMPK and p-mTOR was compared between P1, P2, and P3. Data are representative of two independent experiments.
Fig. S6.
Fig. S6.
Mitochondrial activation-related chemicals work on the different tumor and mouse strains. Fibrosarcoma, MethA-bearing BALB/c mice were treated with PD-L1 mAb along with FCCP, Luperox, and oltipraz according to the schedule shown in Fig. 3B. Tumor sizes (A) and survival rate (B) are shown. Data represent the means ± SEM of five mice. P values, two-tailed Student t test (anti–PD-L1 mAb vs. each combination therapy in tumor volume) are shown.
Fig. S7.
Fig. S7.
T-bet and IFN-γ production was up-regulated in a combination of FCCP with PD-L1 mAb. (A) T-bet and Eomes expression was analyzed by flow cytometry in DLN CD8+ T cells from mice treated with PD-L1 mAb and FCCP. Representative FACS data are shown (Upper). The frequency and numbers of T-bet+ or Eomes+ T cells were calculated in DLN CD8+ T cells from mice treated with PD-L1 mAb and FCCP. *P < 0.05, one-way ANOVA. (B) Digested tumor tissues were incubated at 37 °C for 6 h, and IFN-γ was intracellularly stained in the CD8+ T cells from mice treated with FCCP. Representative FACS data (Left) and the frequency of IFN-γ+ T cells among CD8+ T cells are shown (Right). Data represent the means ± SEM of five mice. *P < 0.05, one-way ANOVA. Data are representative of two independent experiments.
Fig. S8.
Fig. S8.
Hypothetical scheme for mitochondrial activation by PD-1 blockade and chemicals. (A) A PD-1 blockade activates mitochondria of tumor-reactive T cells. (B) ROS inducers or uncouplers increase cellular ROS. (C) Cellular ROS activate AMPK and mTOR, resulting in the activation of PGC-1α as well as the expression of T-bet. (D) Couplers of PGC-1α with NFRs and PPARs induce feed-forward activation on mitochondria. Numbers in parentheses correspond to references listed in the main text.

References

    1. Couzin-Frankel J. Breakthrough of the year 2013. Cancer immunotherapy. Science. 2013;342(6165):1432–1433. - PubMed
    1. Topalian SL, Drake CG, Pardoll DM. Immune checkpoint blockade: A common denominator approach to cancer therapy. Cancer Cell. 2015;27(4):450–461. - PMC - PubMed
    1. Okazaki T, Chikuma S, Iwai Y, Fagarasan S, Honjo T. A rheostat for immune responses: The unique properties of PD-1 and their advantages for clinical application. Nat Immunol. 2013;14(12):1212–1218. - PubMed
    1. Brahmer JR, et al. Phase I study of single-agent anti-programmed death-1 (MDX-1106) in refractory solid tumors: Safety, clinical activity, pharmacodynamics, and immunologic correlates. J Clin Oncol. 2010;28(19):3167–3175. - PMC - PubMed
    1. Zou W, Wolchok JD, Chen L. PD-L1 (B7-H1) and PD-1 pathway blockade for cancer therapy: Mechanisms, response biomarkers, and combinations. Sci Transl Med. 2016;8(328):328rv4. - PMC - PubMed

Publication types

MeSH terms

Substances