. 2017 Jan 31;114(5):962-967.
doi: 10.1073/pnas.1617990114. Epub 2017 Jan 17.

Molecular imaging of biological systems with a clickable dye in the broad 800- to 1,700-nm near-infrared window

Affiliations

Molecular imaging of biological systems with a clickable dye in the broad 800- to 1,700-nm near-infrared window

Shoujun Zhu et al. Proc Natl Acad Sci U S A. .

Abstract

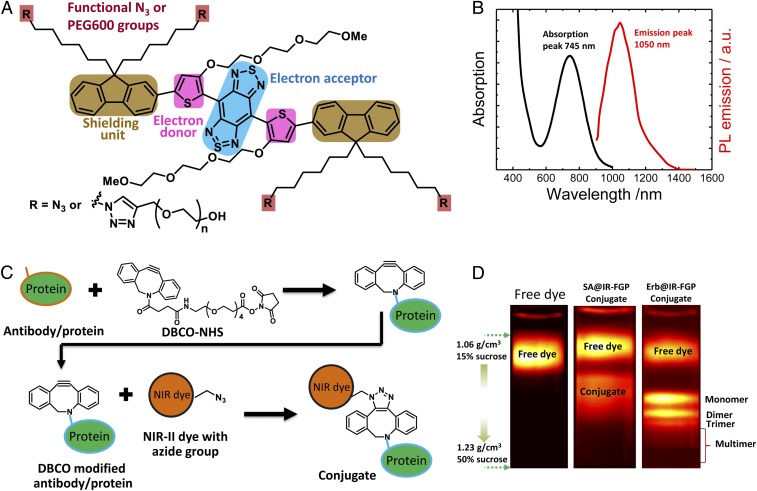
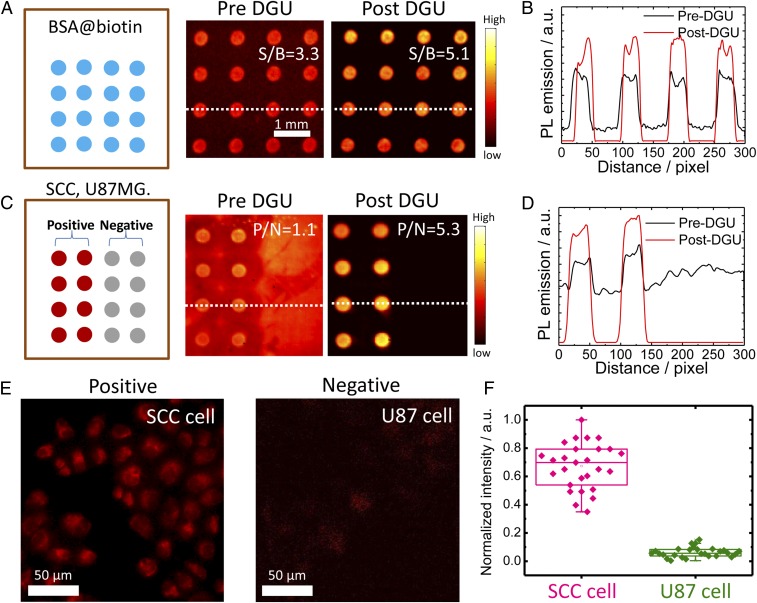
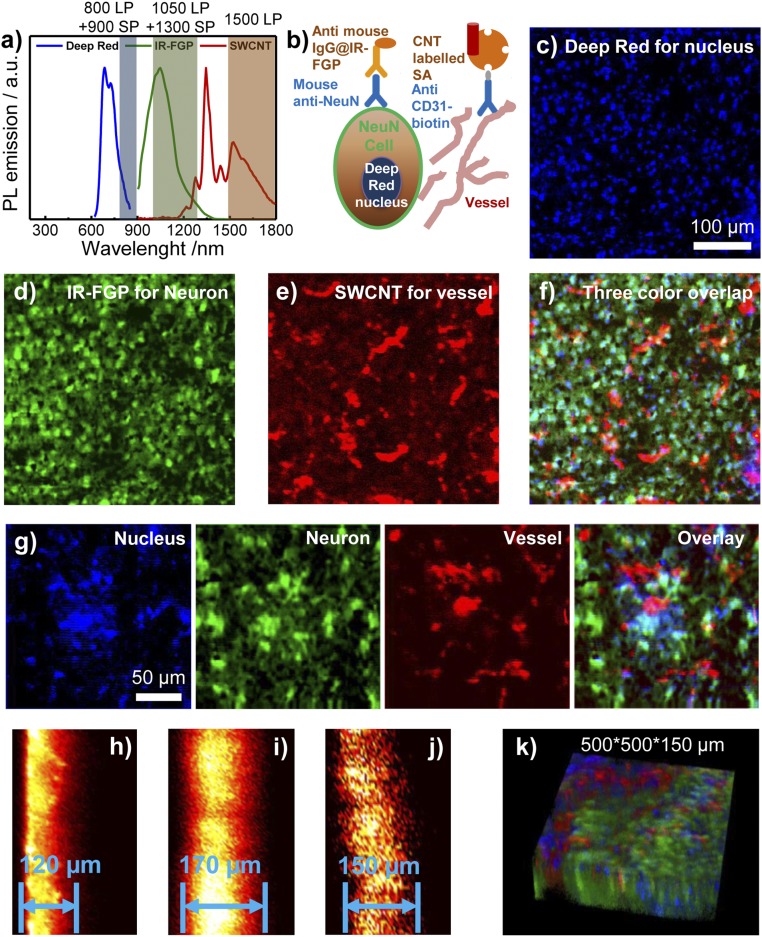
Fluorescence imaging multiplicity of biological systems is an area of intense focus, currently limited to fluorescence channels in the visible and first near-infrared (NIR-I; ∼700-900 nm) spectral regions. The development of conjugatable fluorophores with longer wavelength emission is highly desired to afford more targeting channels, reduce background autofluorescence, and achieve deeper tissue imaging depths. We have developed NIR-II (1,000-1,700 nm) molecular imaging agents with a bright NIR-II fluorophore through high-efficiency click chemistry to specific molecular antibodies. Relying on buoyant density differences during density gradient ultracentrifugation separations, highly pure NIR-II fluorophore-antibody conjugates emitting ∼1,100 nm were obtained for use as molecular-specific NIR-II probes. This facilitated 3D staining of ∼170-μm histological brain tissues sections on a home-built confocal microscope, demonstrating multicolor molecular imaging across both the NIR-I and NIR-II windows (800-1,700 nm).

Keywords: NIR-II molecular imaging; NIR-II multicolor molecular imaging; bioconjugate; clickable dye; density gradient ultracentrifugation separation.


Conflict of interest statement

The authors declare no conflict of interest.

Figures

Fig. 1.
Fig. 1.
Clickable dye (IR-FGP) with high QY in the NIR-II window used for specific bioconjugation. (A) Chemical structure of IR-FGP with donor–acceptor–donor architecture containing two PEG chains and two azide groups for biocompatibility and bioconjugation. (B) Absorption and photoluminescence (PL) emission (808-nm excitation) spectra of IR-FGP. (C) Scheme of the conjugation route between IR-FGP and proteins by click chemistry. The protein was connected with the DBCO-NHS linker, and then the DBCO-modified protein was reacted with IR-FGP. (D) PL image of post-DGU tubes of free IR-FGP, SA@IR-FGP, and Erb@IR-FGP. The sucrose gradient ranged from 1.06 to 1.23 g/cm3 (15–50 wt%). SI Appendix, Fig. S4 shows a complete density profile along the centrifuge tubes. Images were obtained on a home-built NIR-II set-up with 808 nm excitation (with 850- and 1,000-nm short-pass filters) and 900- and 1,100-nm long-pass emission filters.
Fig. 2.
Fig. 2.
The microarray assay screening method developed to test the conjugates. (A) Assay analysis of DGU fraction of SA@IR-FGP. BSA-biotin was printed on the plasmonic fluorescence-enhancing gold slide, after which the pre/post-DGU conjugates were incubated on the slide. Finally, the slide was scanned by a 10× magnification NIR-II setup with 808-nm excitation and a 1,100-nm long-pass emission filter. (B) Cross-sectional intensity profile of the spot signal. (C and D) Assay analysis of the DGU fractions of Erb@IR-FGP. SCC and U87 cell lysates were printed on plasmonic fluorescence-enhancing gold slides for testing the conjugate Erb@IR-FGP. The slide was finally scanned with a 10× magnification NIR-II setup with 808-nm excitation and a 1,100-nm long-pass emission filter. Note that the gold slide has a certain autofluorescence under the testing condition. (E) Targeted cell staining by Erb@IR-FGP (SCC and U87 cell lines as positive and negative controls) scanned by a home-built microscope with 785-nm excitation and a 1,050-nm long-pass emission filter. (F) PL intensity statistic of SCC and U87 cells.
Fig. 3.
Fig. 3.
Multicolor 2D/3D staining in NIR-I and NIR-II windows (800–1,700 nm). (A) PL emission spectra of Deep Red, IR-FGP, and IIb SWCNT including the long-pass/short-pass filter ranges used for three-color imaging. (Although there is slight emission overlay between IR-FGP and SWCNT, the lower QY of SWCNT did not affect the IR-FGP channel.) (B) Scheme of molecular imaging with three color channels. (C–F) 2D multicolor labeling of brain tissue imaged with a home-built confocal system. (C) Deep Red with NIR-I emission for staining the nucleus (658-nm excitation with 850-nm long-pass and 900-nm short-pass emission filters. Note that the 850-nm long-pass filter can be replaced with an 800-nm filter in the present confocal setup to get similar results with higher signal intensities. Images were plotted by ImageJ, increasing the z-scale to eliminate autofluorescence and NSB background signal. SI Appendix, Fig. S8E provides raw data without low z-scale changes. (D) Mouse anti-neuron and anti-mouse IgG@IR-FGP with NIR-IIa emission for staining the neuron (785-nm excitation with 1,050-nm long-pass and 1,300-nm short-pass emission filters). Clear visualization of neuron nucleus with light staining of cell cytoplasm is evident. (E) Anti-CD31 and SA@SWCNT with NIR-IIb emission for staining vessels (785-nm excitation with 1,500-nm long-pass emission filter). (F) Three-color overlapping image of nucleus, neurons, and vessels. (G) Magnified multicolor brain tissue staining with higher resolution. (H–J) Confocal scanning from cross-sections of brain tissue. Scanning depths: Deep Red (H), 120 µm; IR-FGP (I), 170 µm; SWCNT (J), 150 µm. For cross-sectional scanning, the achievable imaging depth was defined as the depth beyond which the measured S/B ratio fell below 2.5. (K) Three-color 3D rendering of nucleus, neuron, and vessel channels obtained with NIR-I/II confocal microscopy. A homebuilt stage scanning confocal setup was used to obtain confocal images. The 100× objective (Olympus, oil immersion, NA 0.8) focuses the excitation laser to a tiny spot with a few μm diameter onto the sample, and the fluorescence goes through 800-nm long-pass dichoric and emission filters to a photomultiplier tube (PMT) detector. A 150-μm pinhole is used to reject out-of-focus signals. For the Deep Red channel, a 658-nm laser was used for excitation, and the signal was detected with a PMT detector (Hamamatsu H7422-50). For the IR-FGP and SWCNT channels, a 785-nm laser was used for excitation, and the signal was detected with an NIR PMT detector (Hamamatsu H12397-75). The scanning rate was 2.5 ms/pixel.

References

    1. Giepmans BN, Adams SR, Ellisman MH, Tsien RY. The fluorescent toolbox for assessing protein location and function. Science. 2006;312(5771):217–224. - PubMed
    1. Hong G, Diao S, Antaris AL, Dai H. Carbon nanomaterials for biological imaging and nanomedicinal therapy. Chem Rev. 2015;115(19):10816–10906. - PubMed
    1. Boulina M, Samarajeewa H, Baker JD, Kim MD, Chiba A. Live imaging of multicolor-labeled cells in Drosophila. Development. 2013;140(7):1605–1613. - PMC - PubMed
    1. Xing Y, et al. Bioconjugated quantum dots for multiplexed and quantitative immunohistochemistry. Nat Protoc. 2007;2(5):1152–1165. - PubMed
    1. Longmire M, Kosaka N, Ogawa M, Choyke PL, Kobayashi H. Multicolor in vivo targeted imaging to guide real-time surgery of HER2-positive micrometastases in a two-tumor coincident model of ovarian cancer. Cancer Sci. 2009;100(6):1099–1104. - PMC - PubMed

Publication types