. 2017 Jan 31;114(5):E801-E810.
doi: 10.1073/pnas.1619265114. Epub 2017 Jan 17.

Continual renewal and replication of persistent Leishmania major parasites in concomitantly immune hosts

Affiliations

Continual renewal and replication of persistent Leishmania major parasites in concomitantly immune hosts

Michael A Mandell et al. Proc Natl Acad Sci U S A. .

Abstract

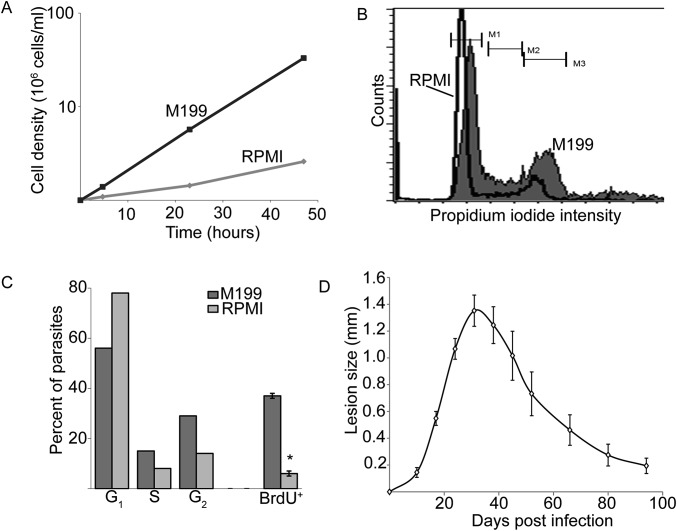
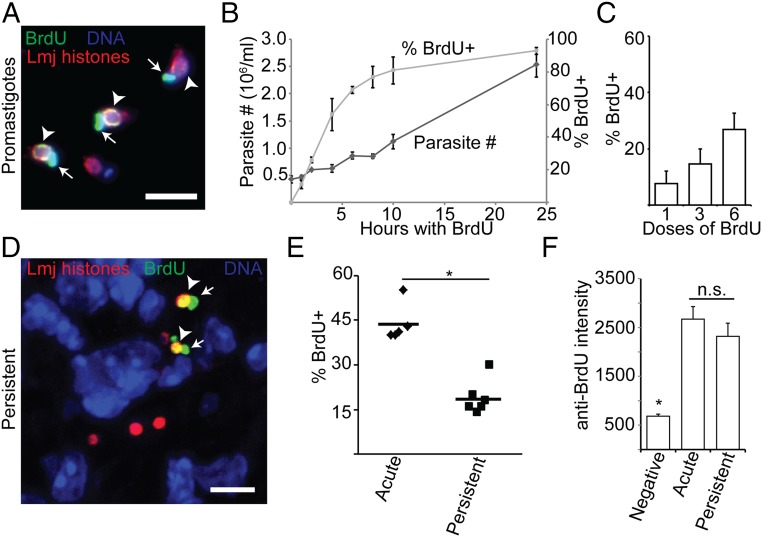
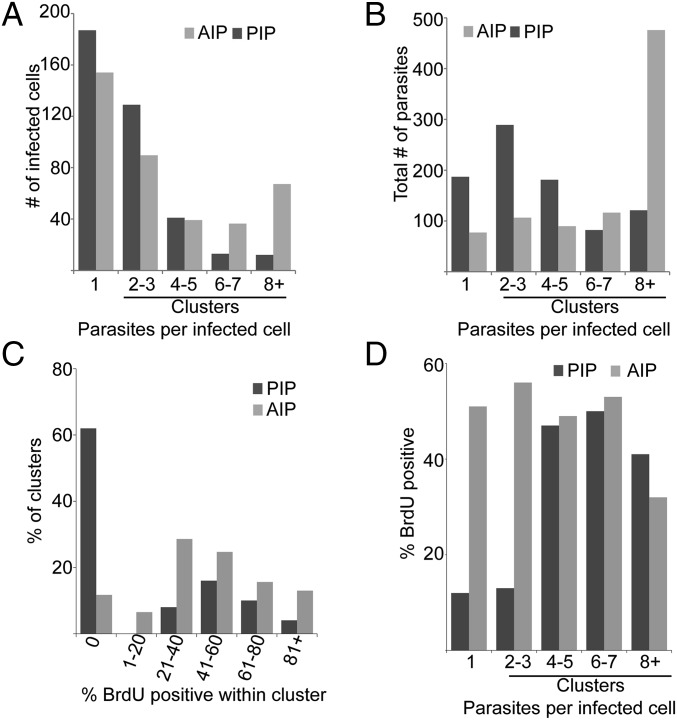
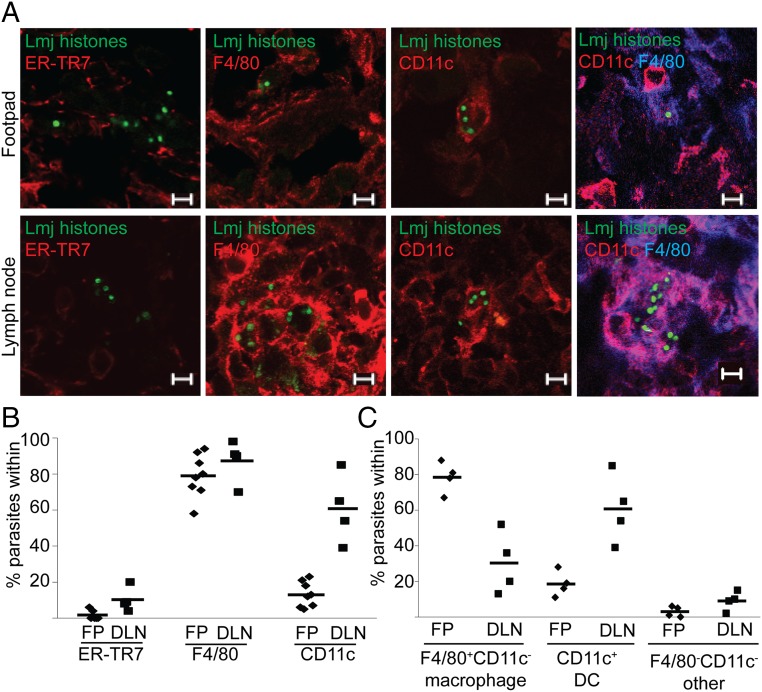
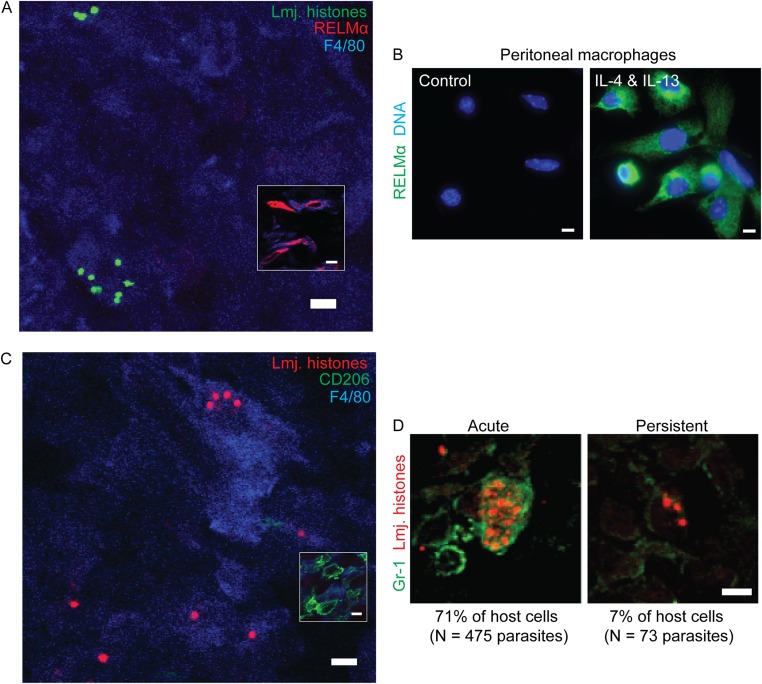
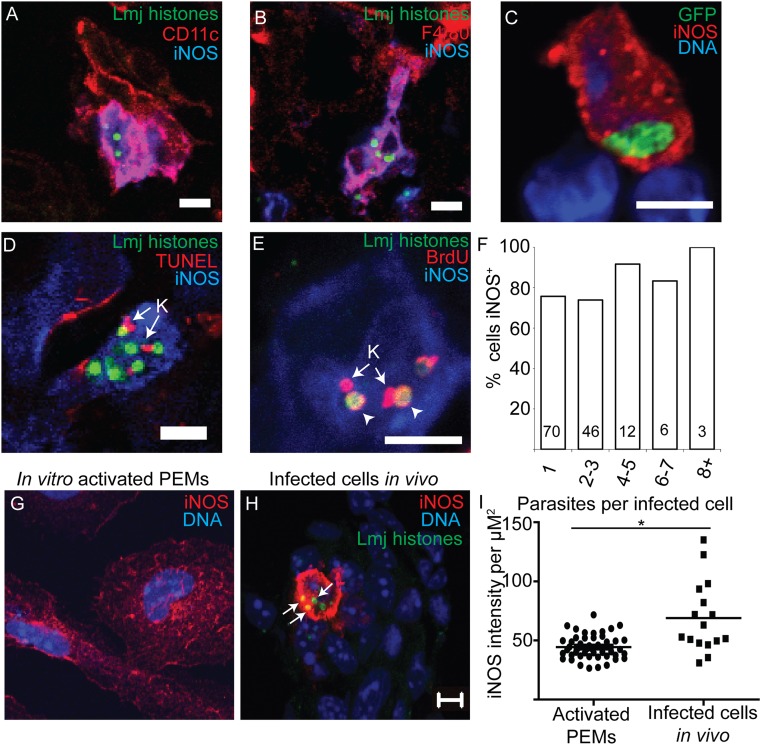
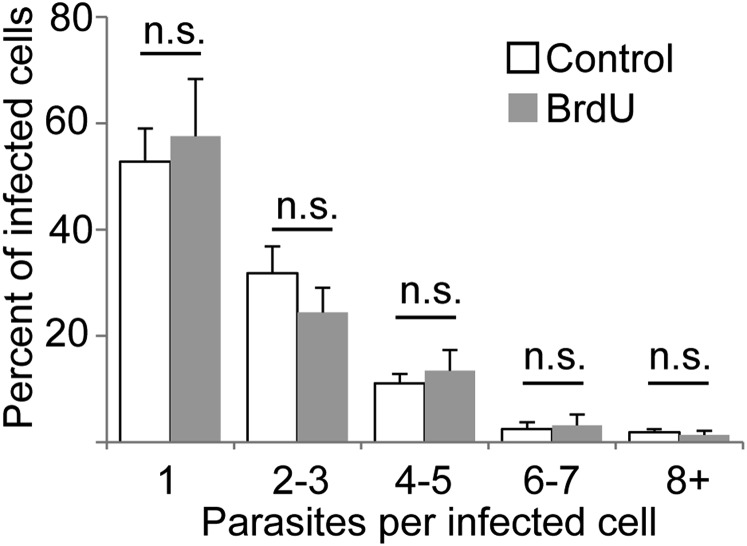
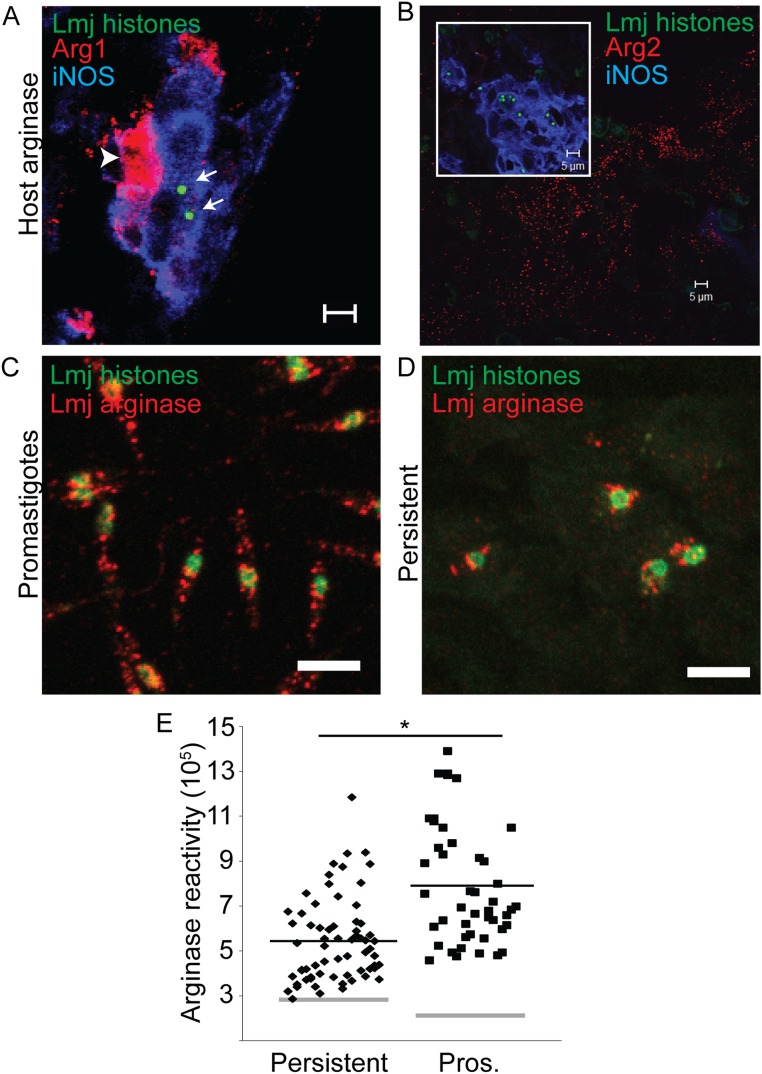
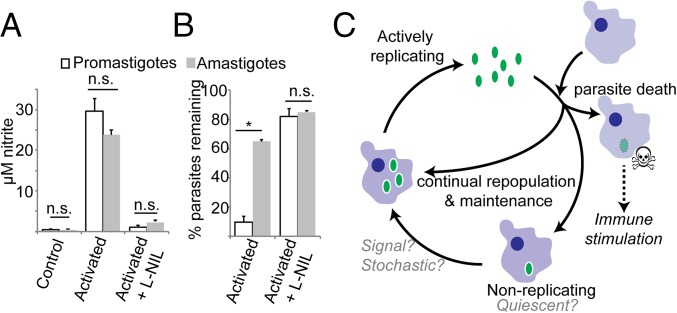
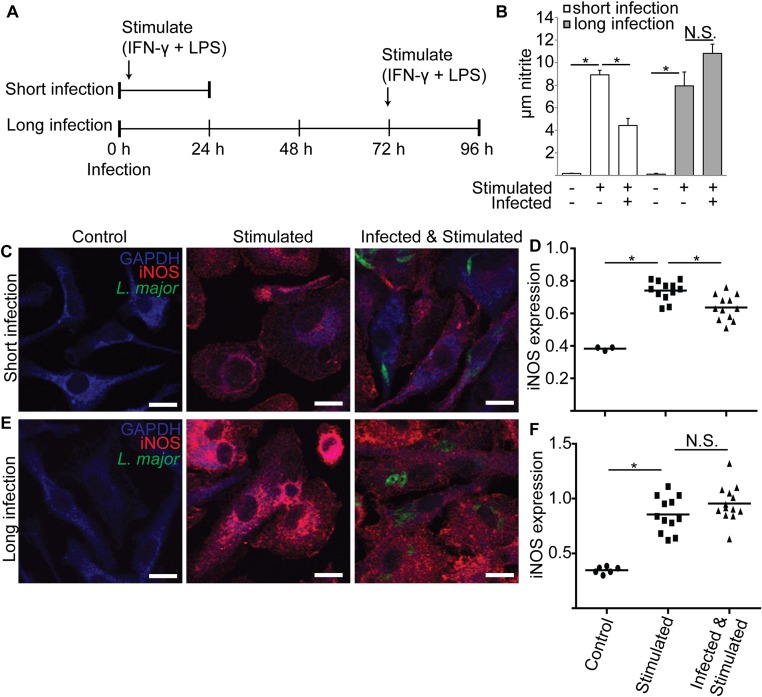
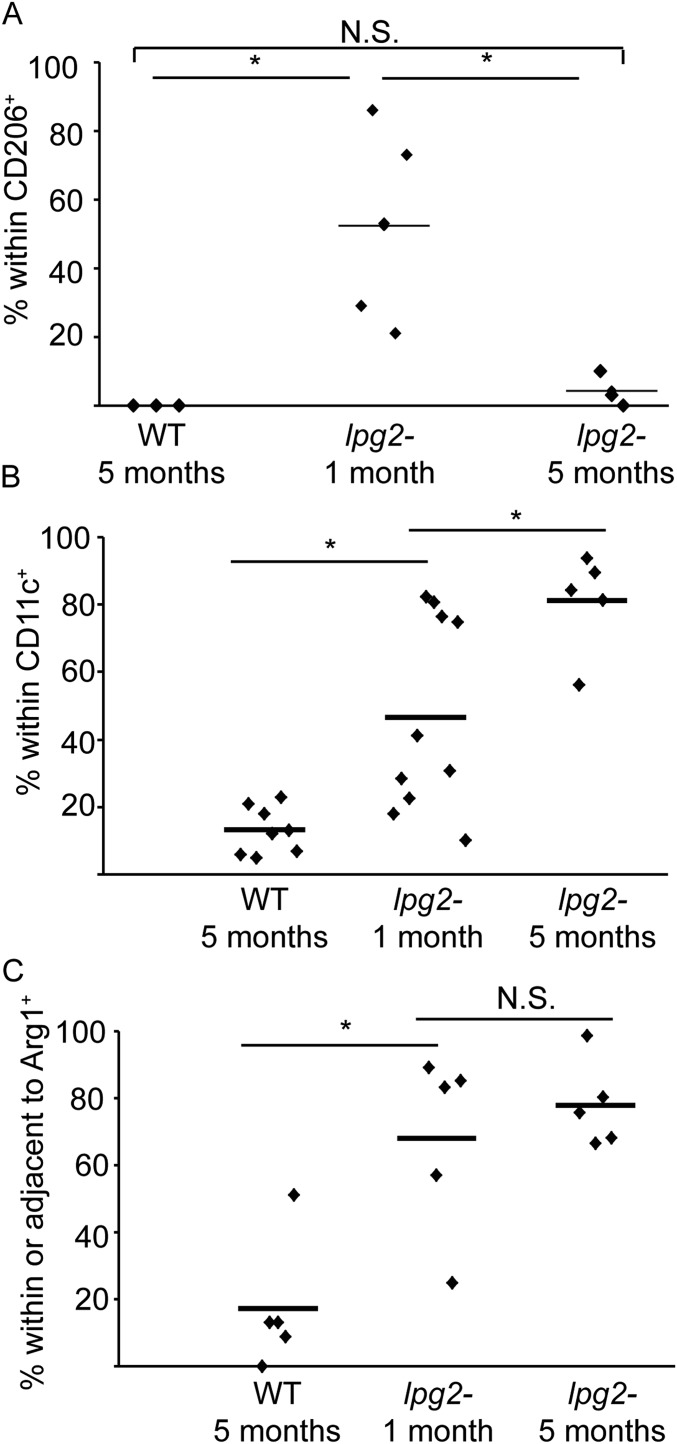
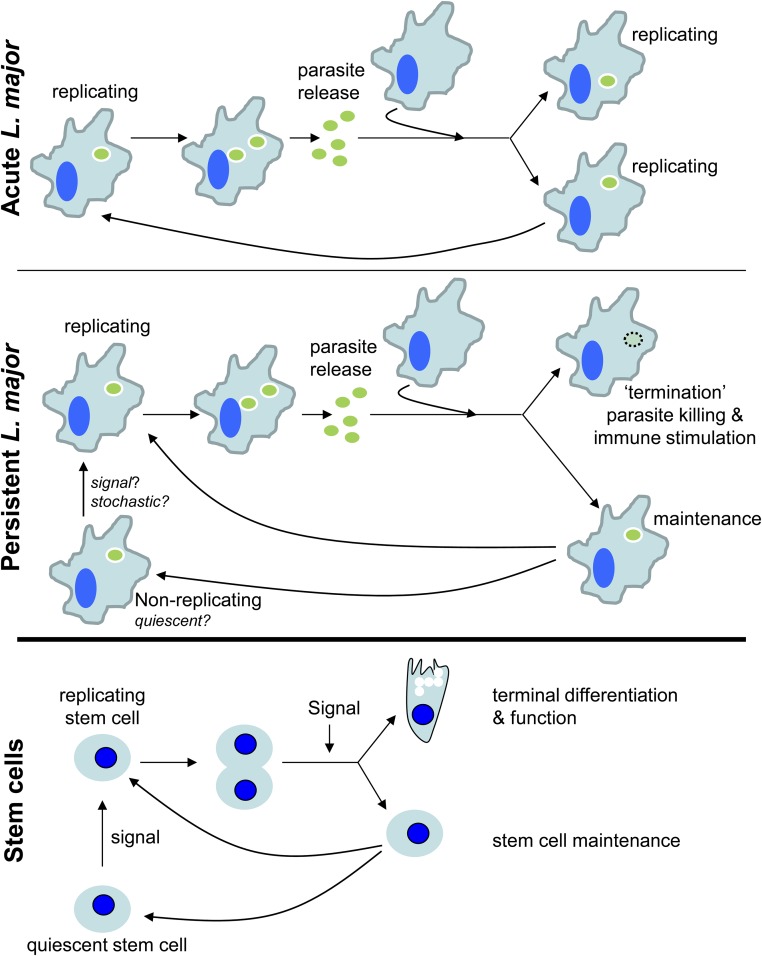
In most natural infections or after recovery, small numbers of Leishmania parasites remain indefinitely in the host. Persistent parasites play a vital role in protective immunity against disease pathology upon reinfection through the process of concomitant immunity, as well as in transmission and reactivation, yet are poorly understood. A key question is whether persistent parasites undergo replication, and we devised several approaches to probe the small numbers in persistent infections. We find two populations of persistent Leishmania major: one rapidly replicating, similar to parasites in acute infections, and another showing little evidence of replication. Persistent Leishmania were not found in "safe" immunoprivileged cell types, instead residing in macrophages and DCs, ∼60% of which expressed inducible nitric oxide synthase (iNOS). Remarkably, parasites within iNOS+ cells showed normal morphology and genome integrity and labeled comparably with BrdU to parasites within iNOS- cells, suggesting that these parasites may be unexpectedly resistant to NO. Nonetheless, because persistent parasite numbers remain roughly constant over time, their replication implies that ongoing destruction likewise occurs. Similar results were obtained with the attenuated lpg2- mutant, a convenient model that rapidly enters a persistent state without inducing pathology due to loss of the Golgi GDP mannose transporter. These data shed light on Leishmania persistence and concomitant immunity, suggesting a model wherein a parasite reservoir repopulates itself indefinitely, whereas some progeny are terminated in antigen-presenting cells, thereby stimulating immunity. This model may be relevant to understanding immunity to other persistent pathogen infections.

Keywords: latency; quiescence; stem cell-like; trypanosomatid protozoan parasite; vaccination.


Conflict of interest statement

The authors declare no conflict of interest.

Figures

Fig. S1.
Fig. S1.
Slow-growing L. major increase the duration of G1 phase. (A) Growth of L. major promastigotes in M199 or RPMI media. Parasites in M199 double every 9 h, whereas parasite doubling in RPMI requires ∼30 h. (B) DNA content of cells cultured as in A as assessed by propidium iodide staining and flow cytometry. The slight offset seen in the peaks is within the normal variability seen in these assays. (C) Percent of parasites in M199 (light gray) or RPMI (dark gray) that are in G1, S, or M/G2 phase in the cell cycle (corresponding to M1, M2, and M3 in B, respectively). Also shown is the percentage of parasites from each growth condition that are BrdU+ 2 h after the addition of BrdU to the culture media. (D) Typical lesion profile after footpad inoculation with 104 metacyclic L. major in C57BL6 mice. By 3–4 mo postinfection, footpad swelling is largely resolved. Experiments with PIPs were performed at 5 mo postinfection. Graph shows mean ± SEM. *P < 0.05, Student’s t test. n = 3 experiments.
Fig. 1.
Fig. 1.
BrdU incorporation assay demonstrates persistent parasite replication in situ. (A) Labeling of log-phase promastigotes with BrdU. (B) Parasite density and extent of BrdU labeling of log-phase promastigotes cultured for 24 h in the presence of BrdU. Dark-shaded diamonds, parasite number; light-shaded squares, percent BrdU+. (C) The effect of increasing the number of BrdU doses (simultaneous local and systematic injection) on the percent BrdU+ parasites during acute mouse footpad infections where parasites are growing logarithmically. n = 3 mice; >1,000 total parasites. (D) Confocal microscopic analysis of BrdU incorporation of footpad PIPs. (E) Comparison of the percent BrdU+ intracellular parasites in AIPS versus PIPs. Data points, mean percent BrdU labeling for individual mice. Horizontal bars, mean for all mice. (F) Analysis of the BrdU-labeling intensity of parasite nuclei. n = 20 parasites per category. Graph shows mean ± SEM; *P < 0.05; n.s., not significant by Student’s t test or ANOVA. Arrowheads, BrdU-labeled nuclei; arrows, BrdU-labeled kinetoplast (mitochondrial) DNA. (Scale bar, 5 µM.)
Fig. 2.
Fig. 2.
Parasite cluster analysis indicates two populations of persistent parasites: actively replicating and quiescent. (A) Frequency of infected cells plotted as a function of the number of intracellular parasites per cell for both AIPs and PIPs, respectively. Dark bars, persistent; light bars, acute. Clusters are defined as host cells containing two or more parasites. (B) Distribution of parasites as a function of the number of parasites per infected cell for both AIPs and PIPs. For A and B, n = 386 infected cells, 888 parasites, from 8 infected mice (PIPs) and 380 infected cells, 865 parasites, 3 mice (AIPs). Tissue sections analyzed for A and B were obtained from mice that were not treated with BrdU. (C) Distribution of clusters as a function of the percent BrdU+ parasites within that cluster. For PIPs, n = 127 infected cells, 755 parasites, 5 mice; for AIPs, n = 176 infected cells, 976 parasites, 5 mice. (D) Percent of BrdU+ parasites within individual clusters plotted as a function of cluster size. For PIPs, n = 167 infected cells, 237 parasites, 6 mice; for AIPs, n = 176 infected cells, 976 parasites, 5 mice.
Fig. 3.
Fig. 3.
PIPs are predominantly found within MΦs and DCs in footpads (inoculation site) and in DLNs. (A) Representative confocal micrographs of the association between PIP nuclei (green) and indicated host cell markers in footpad (FP, Top) and DLN (Bottom) tissue. (Scale bar, 5 µM.) (B and C) Quantitation of images from A. Data points, mean association between parasites and markers in a mouse; horizontal bars, mean for all mice.
Fig. S2.
Fig. S2.
PIPs are not found within alternatively activated or GR-1+ MΦs. (A) Representative image of persistent parasite nuclei (green) within tissue stained to detect F4/80+ (blue) and RELMα+ (red). (Inset) RELMα+ cells imaged from same tissue section but from a field that did not contain any parasites. n = 2 experiments, 3 mice, 284 parasites. (B) As a positive control for A, starch-elicited peritoneal exudate cells were either cultured in media without cytokines (Left) or cultured in the presence of IL-4 and IL-13 (100 U·mL−1) for 48 h (Right) and then stained to detect RELMα (green) or nuclei (blue). (C) Representative image of persistent parasite (red) within tissue stained to detect F4/80- (blue) and CD206- (green) positive cells. (Inset) CD206+F4/80+ cells elsewhere in the same tissue section. n = 2 experiments, 3 mice, 218 parasites. (D) Association between parasites and the GR-1 host marker in acutely infected (Left) and persistently infected tissue (Right). (Scale bar, 5 µM.)
Fig. 4.
Fig. 4.
PIPs are morphologically intact and replicate within iNOS-expressing cells. (A and B) Representative images of parasite nuclei (green) within iNOS-positive CD11c+ (A) or F4/80+ cells (B) in persistently infected footpad tissue. (C) GFP-expressing L. major (green) within iNOS-positive cells in persistently infected tissue shows expected morphology for intracellular parasites. (D) TUNEL labeling of PIPs within iNOS-expressing cells. K (arrow), kinetoplast showing TUNEL+. No TUNEL labeling of parasite nuclei was observed. n = 2E/3M/80P. (E) BrdU labeling of PIPs within iNOS-expressing cells. K, kinetoplast showing BrdU-labeling. Arrowheads, BrdU+nuclei. (F) Percent of clusters within iNOS+ cells plotted as a function of the number of intracellular parasites per cell. Numbers within the bars are the number of cells visualized. (Scale bar, 5 µM.) (G) Representative image of starch elicited PEMs that were cultured in the presence of IFN-γ and LPS for 24 h and then stained to detect parasite histones (green), iNOS (red), and nuclei (blue). (H) Representative image of an infected cell in footpad tissue stained and imaged identically to the cells in G. Arrows, PIP nuclei within iNOS+ cells. Images of activated MΦs in vitro or iNOS-expressing infected cells from footpad tissue were captured by confocal microscopy using identical settings. (Scale bar, 5 µm.) (I) Comparison of average red (iNOS) fluorescence intensity per µm2 within in vitro-activated PEMs or iNOS-expressing infected cells from footpad tissue. Each data point represents one cell. Black horizontal bars represent mean for all cells. *P < 0.05, Student’s t test.
Fig. S3.
Fig. S3.
BrdU administration does not affect parasite replication as determined by cluster analysis. The percent of PIP-infected cells containing the indicated number of parasites was determined from mice subjected or not to BrdU dosing (6 systemic, 6 in situ injections of BrdU over 18 h, as described in Materials and Methods). Data from control mice are derived from analysis of images collected for immunolocalization of PIP-containing host cells. Data from BrdU-treated mice were obtained by analysis of images from tissue stained to detect parasite histones and iNOS. The graph shows the mean ± SEM for each cluster/treatment; n.s., not significant (P = 0.662) by two-tailed ANOVA with Bonferonni post hoc analysis. n = 3 mice per group; 130 infected cells (BrdU-treated) or 223 infected cells (control).
Fig. S4.
Fig. S4.
Assessment of host and parasite arginase in persistently infected tissue disfavors substrate competition model. (A) Representative image of footpad tissue from mice infected with persistent L. major showing an infected iNOS+ cell (blue) adjacent to an Arg1+ cell (arrowhead, red). Parasite nuclei are stained green (arrows). (B) Arg2+ (red) staining in footpad tissue. (Inset) PIP nuclei (green) within iNOS+ cells (blue) from the same tissue section as the larger image. Parasites were never found in the same microscopic field as Arg2+ cells. (C) Representative image of log-phase promastigotes stained to detect histones (green) and arginase (red). (D) Representative image of persistently infected footpad tissue stained identically as the parasites in C. (Scale bar, 5 µm.) (E) Analysis of images showing relative fluorescence intensity of persistent parasites and promastigotes. This value was determined by measuring the sum red (arginase) intensity within a circle with a 2.3 μm radius centered on the parasite nucleus on confocal images such as those in C and D, in which the confocal stack had been compressed into a single plane. Gray horizontal bars represent the average background, which differed between sample types. Black bars represent the mean arginase reactivity for all cells. Each data point represents one parasite. *P < 0.05 by Student’s t test.
Fig. 5.
Fig. 5.
Intracellular amastigotes are unexpectedly resistant to NO killing. PEMs were either pretreated with IFN-γ and LPS 2 h before infection with metacyclic promastigote-stage parasites (promastigotes, open bars) or were first infected with metacyclic-stage parasites and then treated with IFN-γ and LPS 72 h after infection (amastigotes, gray bars). NO production (A) and the number of parasites per infected MФ were determined by microscopy 24 h after IFN γ/LPS treatment. (B) The percent of parasites remaining relative to that seen in untreated MФs at the same time point. Graphs show mean ± SEM; *P < 0.05; n.s., not significant by Student’s t test. (C) Model of Leishmania persistence and concomitant immunity. Persistent Leishmania (green oval) are found in two populations. The first population replicates similarly to parasites in acute infections, whereas the other population replicates very slowly and may be quiescent. Although some of the progeny of the replicating parasites repopulate the replicating or quiescent parasite pools, many progeny parasites are killed. Parasite replication serves to maintain persistence while simultaneously providing a continuous supply of Leishmania antigen, resulting in life-long immune stimulation.
Fig. S5.
Fig. S5.
Metacyclic L. major infections reduce PEM iNOS levels and nitrite production when measured after 24 but not 72 h. (A) Schematic of experimental approach for B–F. PEMs were infected with metacyclic stage L. major expressing GFP (time 0) and stimulated with IFN-γ and LPS either 2 h after infection (short infection) or 72 h after infection (long infection). After 24 h, nitrite was determined in cell supernatants, and cells were processed for confocal microscopy. Controls included uninfected/unstimulated and uninfected/stimulated. (B) Nitrite levels in PEM supernatants are decreased after 24 but not 72 h of infection. (C) Confocal microscopy of PEMs after the “short infection” protocol. Parasites are shown in green (GFP), anti-iNOS reactivity in red, and anti-GAPDH reactivity in blue (MΦ cytosol). Parasite-containing PEMs show reduced anti-iNOS intensity and thus appear “blue.” (Scale bar, 10 µm.) (D) Relative iNOS expression was determined from images acquired in the experiments shown in C by dividing the anti-iNOS fluorescence by anti-GAPDH fluorescence measured using image analysis software. Each data point represents one host cell. For infected samples, only cells containing parasites were selected for analysis. (E) Confocal microscopy of PEMs after the “long infection” protocol. Images were generated and labeled as described in C. (F) Relative iNOS expression of cells under long infection conditions, as described in D. Data, mean ± SEM; *P < 0.05; N.S., not significant (P > 0.05; ANOVA).
Fig. S6.
Fig. S6.
WT and lpg2 PIP host cell localization following short (1 mo) or long (5 mo) infections. C57BL/6 mice were infected with WT parasites for 5 mo or lpg2 parasites for 1 or 5 mo before determining the percent of parasite within CD206+ cells (A), CD11c+ cells (B), or in association (either within or adjacent to) host cells expressing arginase I (C). Each data point represents data from one mouse. Horizontal bars show the mean. *P < 0.05; N.S., not significant by ANOVA. n = 267 parasites, 3 mice, 2 experiments (A); 520 parasites, 5 mice, 2 experiments (B); and n = 901 parasites, 5 mice, 2 experiments (C).
Fig. S7.
Fig. S7.
“Stem immunogen” model of concomitant immunity. (Top) Acute infection L. major (green oval) replicate rapidly, allowing for logarithmic growth of the parasites within infected tissue. (Middle) PIPs (green oval) exhibit two populations. The first replicates similarly to AIPs, whereas the other population is quiescent or replicates very slowly. Progeny of replicating parasites has two potential fates, with some parasites repopulating the quiescent or replicating parasite pools whereas others are destroyed, thus maintaining low parasite populations and providing antigen for continued immune stimulation over the lifespan of the host. (Bottom) The model presented above for PIPs is analogous to stem cells, in which a signal triggers reentry into the cell cycle by quiescent stem cells, allowing for their replication. Daughter cells can then either remain stem cells or can differentiate, depending on a variety of signals. What cues signal quiescent L. major to reenter the cell cycle or how the fate of progeny parasites is determined is unknown, but alterations of the host’s immune status would affect the proportions of progeny parasites destined for survival or destruction.

References

    1. Monack DM, Mueller A, Falkow S. Persistent bacterial infections: The interface of the pathogen and the host immune system. Nat Rev Microbiol. 2004;2(9):747–765. - PubMed
    1. Virgin HW, Wherry EJ, Ahmed R. Redefining chronic viral infection. Cell. 2009;138(1):30–50. - PubMed
    1. Pawlowski A, Jansson M, Sköld M, Rottenberg ME, Källenius G. Tuberculosis and HIV co-infection. PLoS Pathog. 2012;8(2):e1002464. - PMC - PubMed
    1. Roizman B, Whitley RJ. An inquiry into the molecular basis of HSV latency and reactivation. Annu Rev Microbiol. 2013;67:355–374. - PubMed
    1. Brown SP, Grenfell BT. An unlikely partnership: Parasites, concomitant immunity and host defence. Proc Biol Sci. 2001;268(1485):2543–2549. - PMC - PubMed

Publication types

LinkOut - more resources