. 2017 Jan 31;114(5):1111-1116.
doi: 10.1073/pnas.1615973114. Epub 2017 Jan 17.

Trogocytosis of peptide-MHC class II complexes from dendritic cells confers antigen-presenting ability on basophils

Affiliations

Trogocytosis of peptide-MHC class II complexes from dendritic cells confers antigen-presenting ability on basophils

Kensuke Miyake et al. Proc Natl Acad Sci U S A. .

Abstract

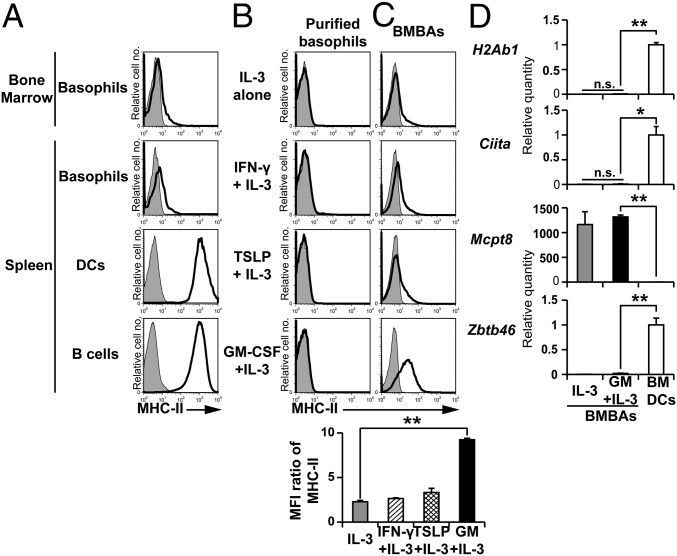
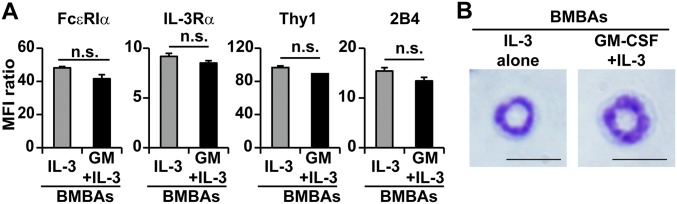
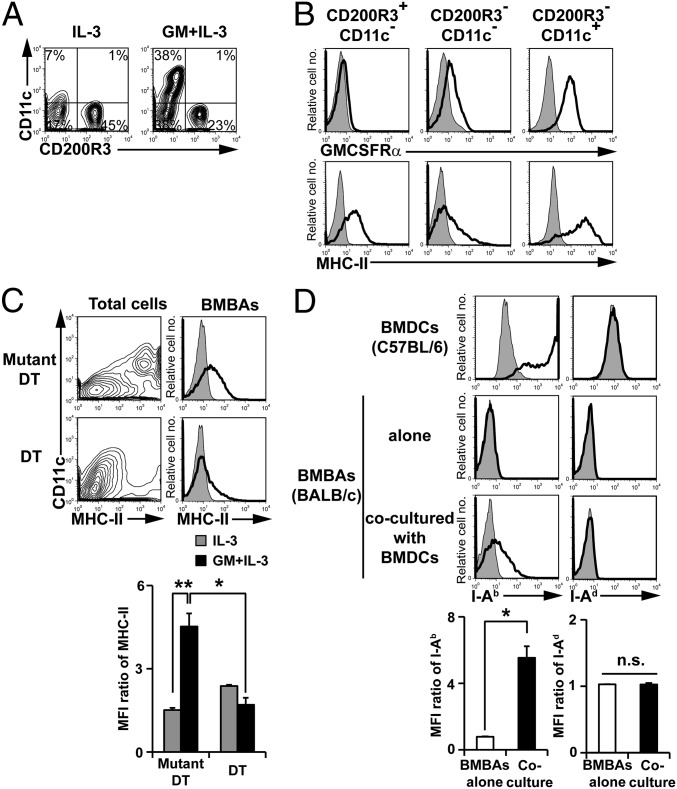
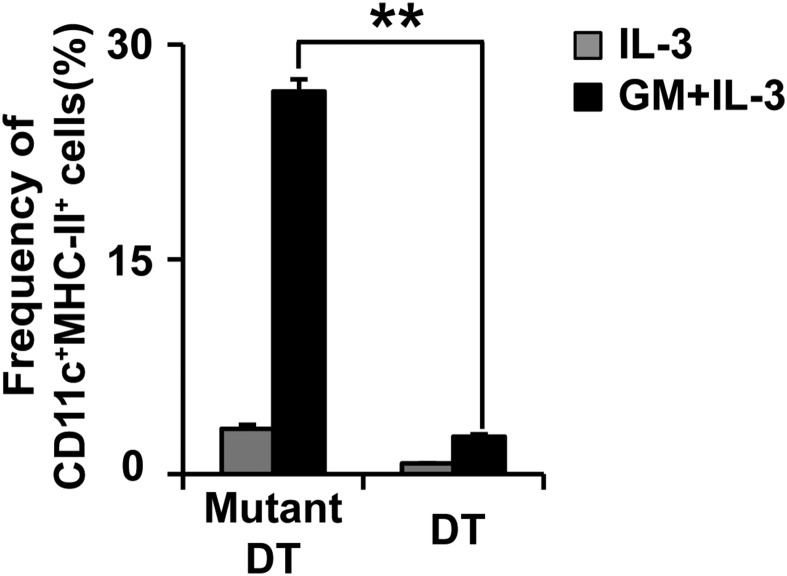
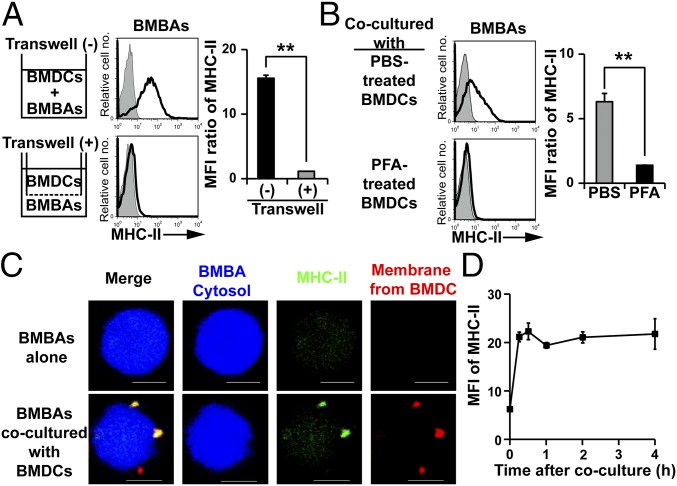
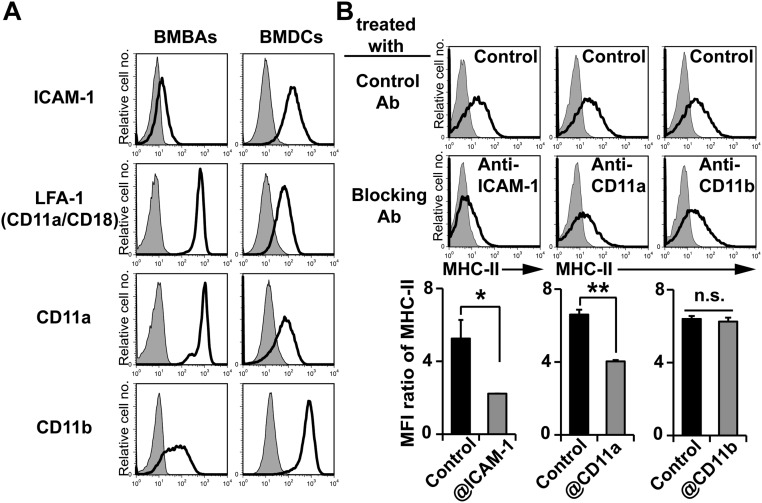
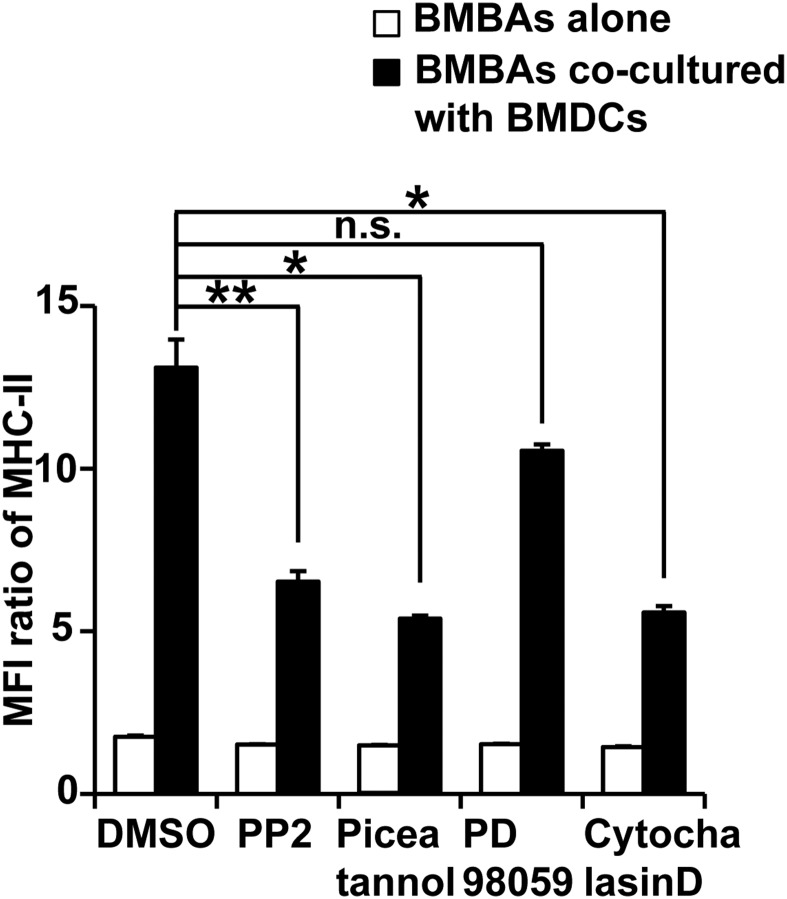
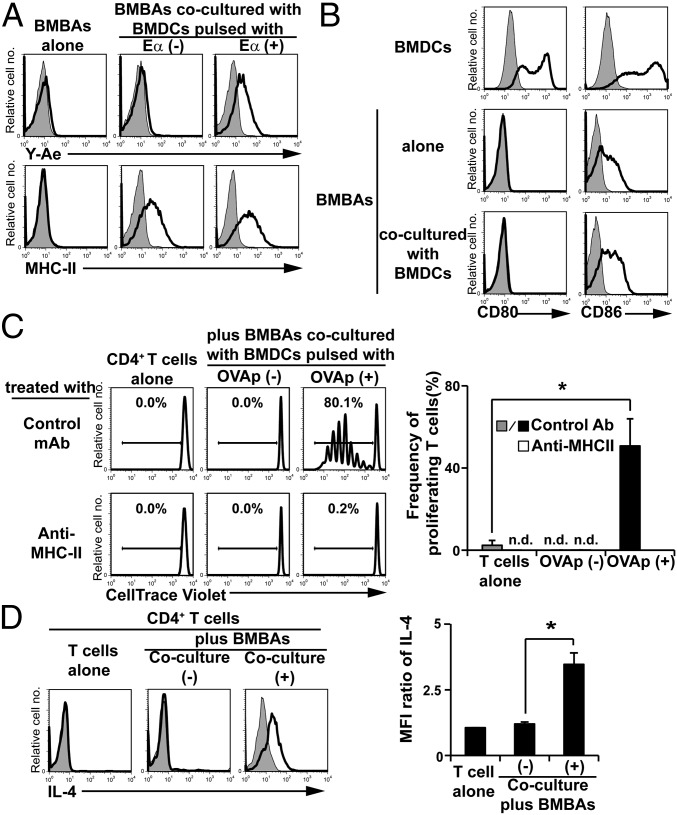
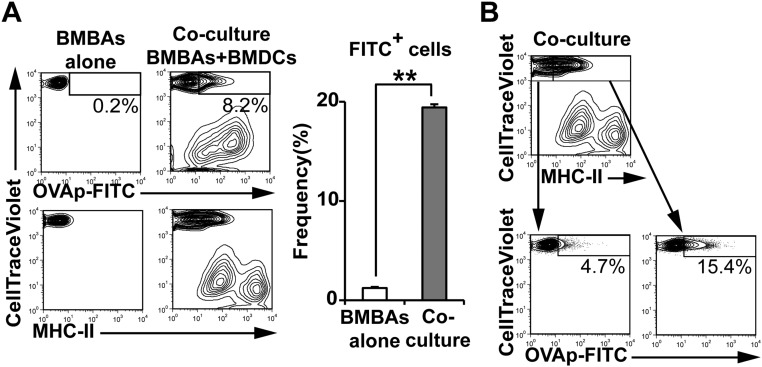
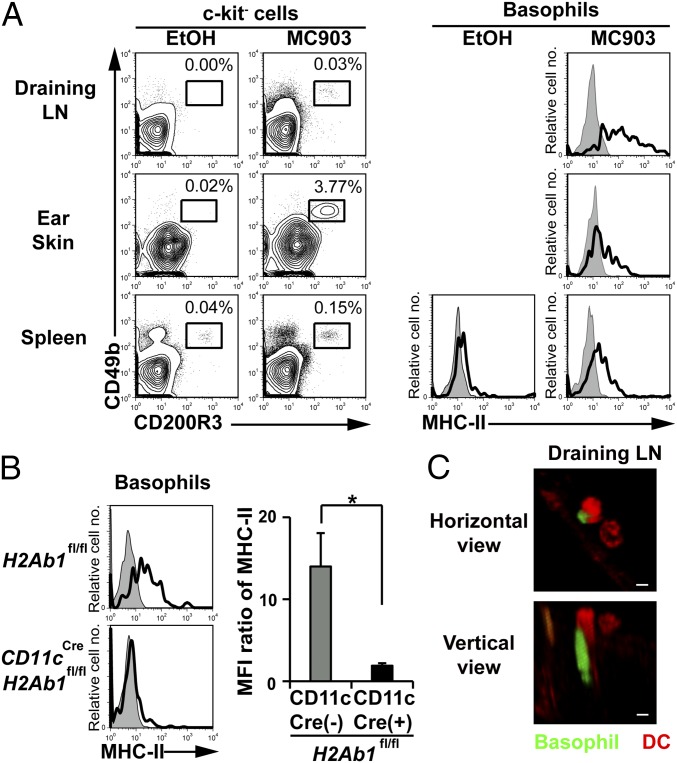
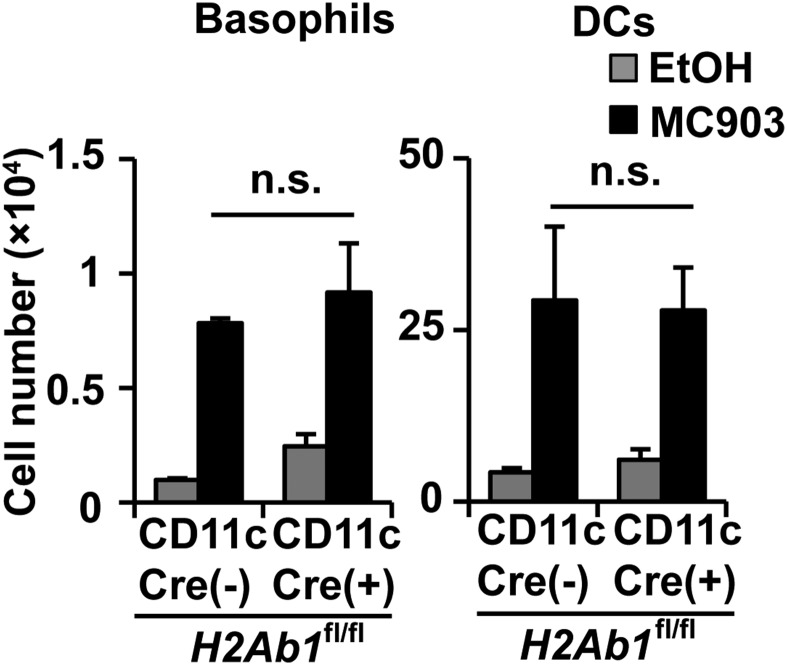
Th2 immunity plays important roles in both protective and allergic responses. Nevertheless, the nature of antigen-presenting cells responsible for Th2 cell differentiation remains ill-defined compared with the nature of the cells responsible for Th1 and Th17 cell differentiation. Basophils have attracted attention as a producer of Th2-inducing cytokine IL-4, whereas their MHC class II (MHC-II) expression and function as antigen-presenting cells are matters of considerable controversy. Here we revisited the MHC-II expression on basophils and explored its functional relevance in Th2 cell differentiation. Basophils generated in vitro from bone marrow cells in culture with IL-3 plus GM-CSF displayed MHC-II on the cell surface, whereas those generated in culture with IL-3 alone did not. Of note, these MHC-II-expressing basophils showed little or no transcription of the corresponding MHC-II gene. The GM-CSF addition to culture expanded dendritic cells (DCs) other than basophils. Coculture of basophils and DCs revealed that basophils acquired peptide-MHC-II complexes from DCs via cell contact-dependent trogocytosis. The acquired complexes, together with CD86, enabled basophils to stimulate peptide-specific T cells, leading to their proliferation and IL-4 production, indicating that basophils can function as antigen-presenting cells for Th2 cell differentiation. Transfer of MHC-II from DCs to basophils was also detected in draining lymph nodes of mice with atopic dermatitis-like skin inflammation. Thus, the present study defined the mechanism by which basophils display MHC-II on the cell surface and appears to reconcile some discrepancies observed in previous studies.

Keywords: MHC class II; basophil; dendritic cell; trogocytosis.


Conflict of interest statement

The authors declare no conflict of interest.

Figures

Fig. 1.
Fig. 1.
Basophils express MHC-II at protein but not at transcription level. (A) MHC-II expression (open histograms) on bone marrow basophils and splenic basophils, DCs and B cells of C57BL/6 mice. Shaded histograms indicate staining with isotype-matched control antibody. (B) Sort-purified basophils from the bone marrow were cultured for 5 d in the presence of IL-3 alone, IFN-γ plus IL-3, TSLP plus IL-3, or GM-CSF plus IL-3, and were subjected to flow cytometric analysis of surface MHC-II expression. (C) Total bone marrow cells instead of purified basophils were cultured as in B, and the resulting BMBAs (CD200R3+CD49b+c-kit) were examined for MHC-II expression. (Lower) Relative MHC-II expression on BMBAs generated under different culture conditions (mean ± SEM; n = 3 each), in that the ratio of mean fluorescence intensity (MFI; MFI of MHC-II staining divided by MFI of control staining) in each group was calculated. (D) Relative amounts of indicated mRNAs in IL-3- and GM-CSF/IL-3-elicited BMBAs in comparison with those in BMDCs (mean ± SEM; n = 3 each). The amount of each mRNA in BMDCs is set as 1. Data shown in A–D are representative of at least three independent experiments. n.s., no significant differences. *P < 0.05; **P < 0.01.
Fig. S1.
Fig. S1.
Surface marker expression and morphology is comparable between GM-CSF/IL-3 and IL-3-elicited basophils. (A) Cell surface expression of FcεRIα, IL-3Rα, Thy1, and 2B4 on IL-3- and GM-CSF/IL-3-elicited BMBAs is shown. Relative expression of each molecule is shown (mean ± SEM; n = 3 each). (B) May-Grünwald-Giemsa staining of IL-3- and GM-CSF/IL-3-elicited BMBAs. (Scale bar, 10 μm.) Data are representative of at least three independent experiments. n.s., no significant differences.
Fig. 2.
Fig. 2.
Basophils acquire MHC-II proteins from DCs. (A) The expression of CD11c and CD200R3 on bone marrow cells cultured in the presence of IL-3 alone or GM-CSF plus IL-3. (B) The expression of GMCSFRα and MHC-II (open histograms) on the CD200R3+CD11c (basophil), CD200R3CD11c, CD200R3CD11c+ fractions of GM-CSF/IL-3-cultured cells. Shaded histograms indicate staining with isotype-matched control antibody. (C) Bone marrow cells isolated from CD11cDTR mice were cultured for 5 d with IL-3 plus GM-CSF in the presence of diphtheria toxin (DT) or its inactive mutant (Mutant DT). CD11c and MHC-II expression on total cells in the culture (Left) and MHC-II expression on BMBAs (Right). (Lower) Relative MHC-II expression on BMBAs in each group (mean ± SEM; n = 3 each). (D) BMBAs and BMDCs were generated from BALB/c and C57BL/6J mice, respectively. BMBAs were cultured in the presence of IL-3 and GM-CSF for 12 h together with or without BMDCs. The expression of MHC-II (I-Ab and I-Ad) on cultured BMBAs is shown in comparison with that on BMDCs (Upper). (Lower) Relative expression of I-Ab and I-Ad on BMBAs is displayed (mean ± SEM; n = 3 each). Data in A–D are representative of at least three independent experiments. n.s., no significant differences. *P < 0.05; **P < 0.01.
Fig. S2.
Fig. S2.
Depletion of DCs in bone marrow culture. Bone marrow cells isolated from CD11cDTR mice were cultured with IL-3 alone or IL-3 plus GM-CSF in the presence of DT or Mutant DT, as in Fig. 2C. The frequency (percentage) of CD11c+ MHC-II+ cells in the culture is shown (mean ± SEM; n = 3 each). Data are representative of at least three independent experiments. **P < 0.01.
Fig. 3.
Fig. 3.
Basophils acquire MHC-II from DCs through cell contact-dependent trogocytosis. (A) BMBAs and BMDCs were cultured for 12 h, together in the same chamber or separately in the lower and upper chambers, respectively, in the transwell apparatus. MHC-II expression on BMBAs after the culture (open histograms) is shown (Left), and all data are summarized (Right), showing relative MHC-II expression (mean ± SEM; n = 3 each). (B) BMBAs were cocultured with BMDCs that had been pretreated with paraformaldehyde (PFA) or control PBS for 15 min. MHC-II expression on BMBAs after the 12-h coculture was analyzed (mean ± SEM; n = 3 each). (C) Before the culture, the cytosol of BMBAs was labeled in blue with CellTrace Violet, whereas the plasma membrane of BMDCs was labeled in red with PKH26. BMBAs were cultured with or without BMDCs for 12 h, and then MHC-II molecules on their surface were stained in green with FITC-conjugated anti-I-A/I-E antibody. Representative photographs of BMBAs taken under confocal fluorescence microscope are shown. (Scale bars, 5 μm.) (D) BMBAs were cocultured with BMDCs. Time course of MHC-II expression on BMBAs is shown (mean ± SEM; n = 3 each). Data in A–D are representative of at least three independent experiments. n.s., no significant differences. *P < 0.05; **P < 0.01.
Fig. S3.
Fig. S3.
Trogocytosis between BMBAs and BMDCs is dependent on ICAM-1 and LFA-1. (A) Cell surface expression ICAM-1, LFA-1, CD11a, and CD11b on BMBAs and BMDCs is shown (open histogram). Shaded histogram indicates control staining with isotype-matched control. (B) BMBAs were cocultured with BMDCs for 12 h in the presence of indicated blocking antibodies or their control. MHC-II expression on BMBAs after the culture was examined. (Upper and Middle) Representative staining profiles. (Lower) All the data are summarized (mean ± SEM; n = 3 each). Data are representative of at least three independent experiments. n.s., no significant differences. *P < 0.05; **P < 0.01.
Fig. S4.
Fig. S4.
Signals from Src/Syk and actin mobilization play important roles in BMBA-BMDC trogocytosis. BMBAs were pretreated for 1 h with indicated reagents or control vehicle (DMSO), and then cultured for 12 h with or without BMDCs in the presence of the same reagents. Relative MHC-II expression on BMBAs is shown (mean ± SEM; n = 3 each). Data are representative of at least three independent experiments. n.s., no significant differences. *P < 0.05; **P < 0.01.
Fig. 4.
Fig. 4.
Trogocytosis of peptide–MHC-II complexes from DCs confers antigen-presenting ability on basophils. (A) BMBAs were cultured for 12 h with or without BMDCs that had been pulsed with Eα peptide or vehicle (PBS) alone. The expression of MHC-II molecules and processed peptide/MHC-II complexes on BMBAs was detected by using anti-MHC-II and Y-Ae antibodies, respectively. Representative staining profiles are shown. (B) BMBAs were cultured for 12 h with or without BMDCs, and CD80 and CD86 expression on BMBAs was examined in comparison with that on BMDCs. (C) BMBAs were cocultured with BMDCs that had been pulsed with or without OVA peptides. BMBAs were purified from the culture and then cocultured for 5 d with CellTrace Violet-labeled naive CD4+ T cells isolated from the spleen of OT-II Tg mice, in the presence of anti-MHC-II blocking or isotype-matched control Ab. As a control, T cells were cultured without BMDCs. The extent of T-cell proliferation was assessed by dilution of CellTrace Violet. (Left) Representative CellTrace Violet staining profiles. (Right) Frequency (percentage) of divided T cells (showing diluted CellTrace Violet) in each group (mean ± SEM; n = 3 each). (D) BMBAs were cultured with or without BMDCs for 12 h. BMBAs were purified from the culture and then cocultured with naive CD4+ T cells isolated from OT-II Tg mice for 5 d in the presence of OVA peptides as antigens. As a control, T cells were cultured without BMDCs. (Left) IL-4 production of T cells was examined by cytoplasmic staining with anti-IL-4 mAb. (Right) Relative IL-4 staining (mean ± SEM; n = 3 each). Data in A–D are representative of at least three independent experiments. n.d., not detected. *P < 0.05.
Fig. S5.
Fig. S5.
FITC-labeled OVA peptides are transferred from DCs to basophils. BMBAs were cultured for 12 h with or without BMDCs that had been pulsed with FITC-conjugated OVA peptides (OVAp-FITC) for 8 h. (A) Staining profiles of CellTrace Violet, FITC and MHC-II are shown (Left). (Right) MFI of FITC on cultured BMBAs is summarized (mean± SEM; n = 3 each). (B) (Upper) Staining profile of CellTrace Violet and MHC-II. (Left) Staining profiles CellTrace Violet and FITC in MHC-IIlo CellTrace Violethi cells and MHC-IIhi CellTrace Violethi cells. Data in A and B are representative of at least three independent experiments.
Fig. 5.
Fig. 5.
Trogocytosis of MHC-II from DCs to basophils occurs in vivo. (A) Ear skin of wild-type C57BL/6 mice was topically treated with MC903 or vehicle EtOH alone for 6 consecutive days. Cells isolated from draining lymph nodes (LNs), ear skin, and spleen were analyzed for the expression of CD49b and CD200R3 (Left). The frequency (percentage) of CD200R3+CD49b+ basophils among isolated cells is shown. (Right) MHC-II expression on basophils (open histograms). Shaded histograms indicate staining with isotype-matched control antibody. (B) Ear skin of CD11cCreH2Ab1fl mice and control H2Ab1fl mice were treated with MC903 or EtOH, as in A. MHC-II expression of draining LN basophils is shown (mean ± SEM; n = 3 each). (C) After the ear skin of Mcpt8GFP mice was treated with MC903 for 6 d, as in A, PE-conjugated anti-CD11c antibody was i.v. administered to visualize CD11c+ cells. Draining LNs were dissected from mice and subjected to confocal fluorescence microscopic analysis. Representative photographs are shown in that basophils and CD11c+ cells are labeled in green and red, respectively. (Scale bars, 10 μm.) Data in A–C are representative of at least three independent experiments. n.s., no significant differences. *P < 0.05.
Fig. S6.
Fig. S6.
Infiltration of basophils and DCs into draining LNs is independent of MHC-II expression in DCs in MC903-induced skin inflammation. Ear skin of CD11cCreH2Ab1fl mice and control H2Ab1fl mice were treated with MC903 or EtOH, as in Fig. 5A. The numbers of basophils and DCs in draining LNs of treated mice are shown (mean ± SEM; n = 3 each). Data are representative of at least three independent experiments. n.s., no significant differences.

References

    1. Galli SJ. Mast cells and basophils. Curr Opin Hematol. 2000;7(1):32–39. - PubMed
    1. Sokol CL, Medzhitov R. Emerging functions of basophils in protective and allergic immune responses. Mucosal Immunol. 2010;3(2):129–137. - PubMed
    1. Karasuyama H, Mukai K, Obata K, Tsujimura Y, Wada T. Nonredundant roles of basophils in immunity. Annu Rev Immunol. 2011;29:45–69. - PubMed
    1. Siracusa MC, Comeau MR, Artis D. New insights into basophil biology: initiators, regulators, and effectors of type 2 inflammation. Ann N Y Acad Sci. 2011;1217(1):166–177. - PMC - PubMed
    1. Sokol CL, et al. Basophils function as antigen-presenting cells for an allergen-induced T helper type 2 response. Nat Immunol. 2009;10(7):713–720. - PMC - PubMed

Publication types

MeSH terms