. 2017 Mar 1;130(5):892-902.
doi: 10.1242/jcs.196881. Epub 2017 Jan 17.

Vimentin intermediate filaments control actin stress fiber assembly through GEF-H1 and RhoA

Affiliations

Vimentin intermediate filaments control actin stress fiber assembly through GEF-H1 and RhoA

Yaming Jiu et al. J Cell Sci. .

Abstract

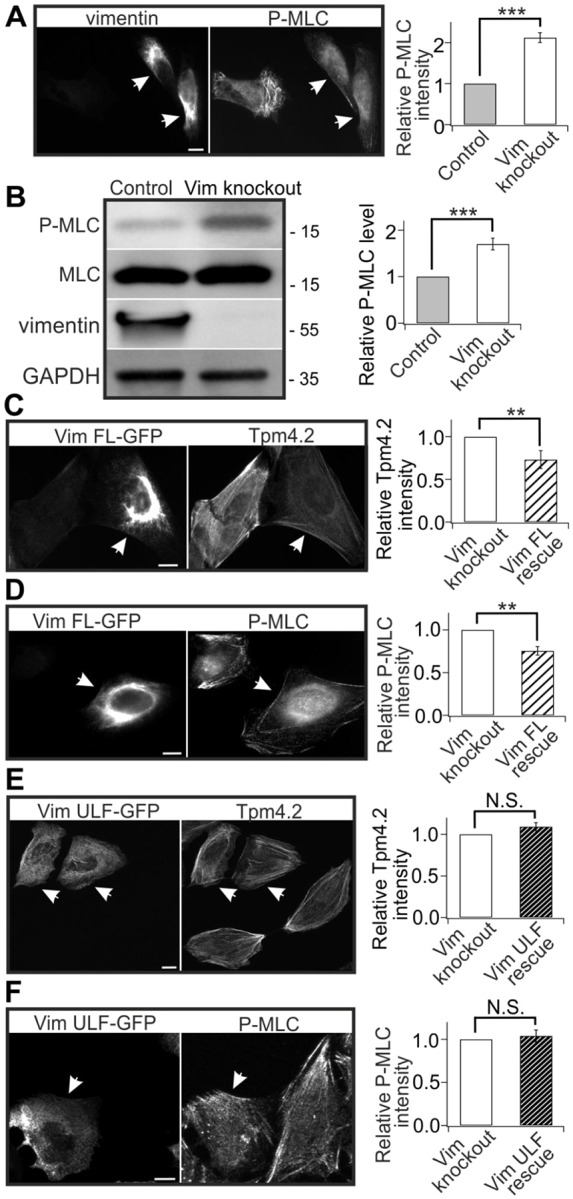
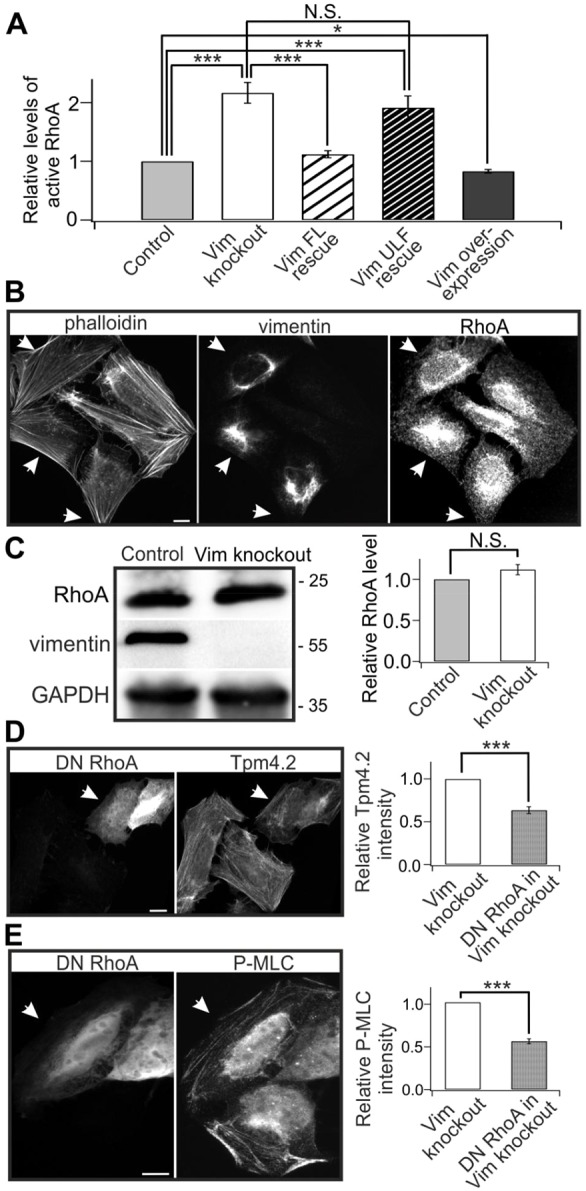
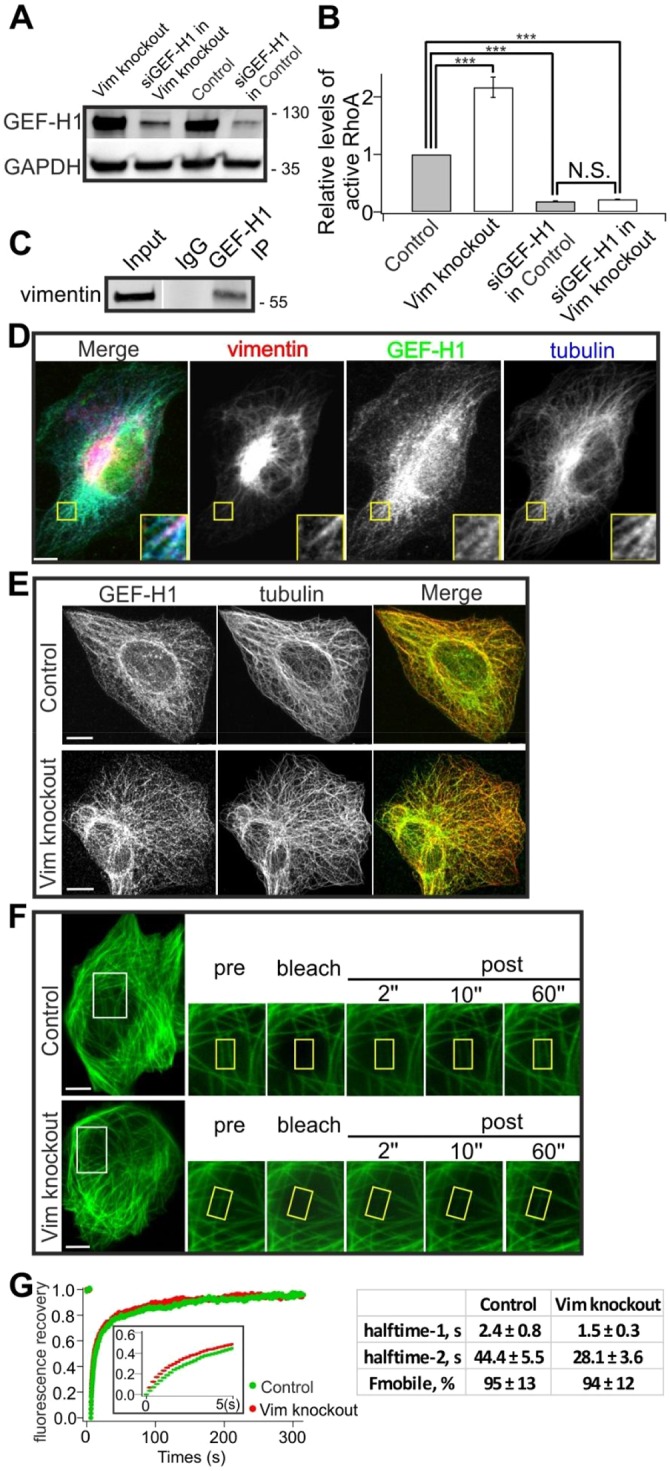
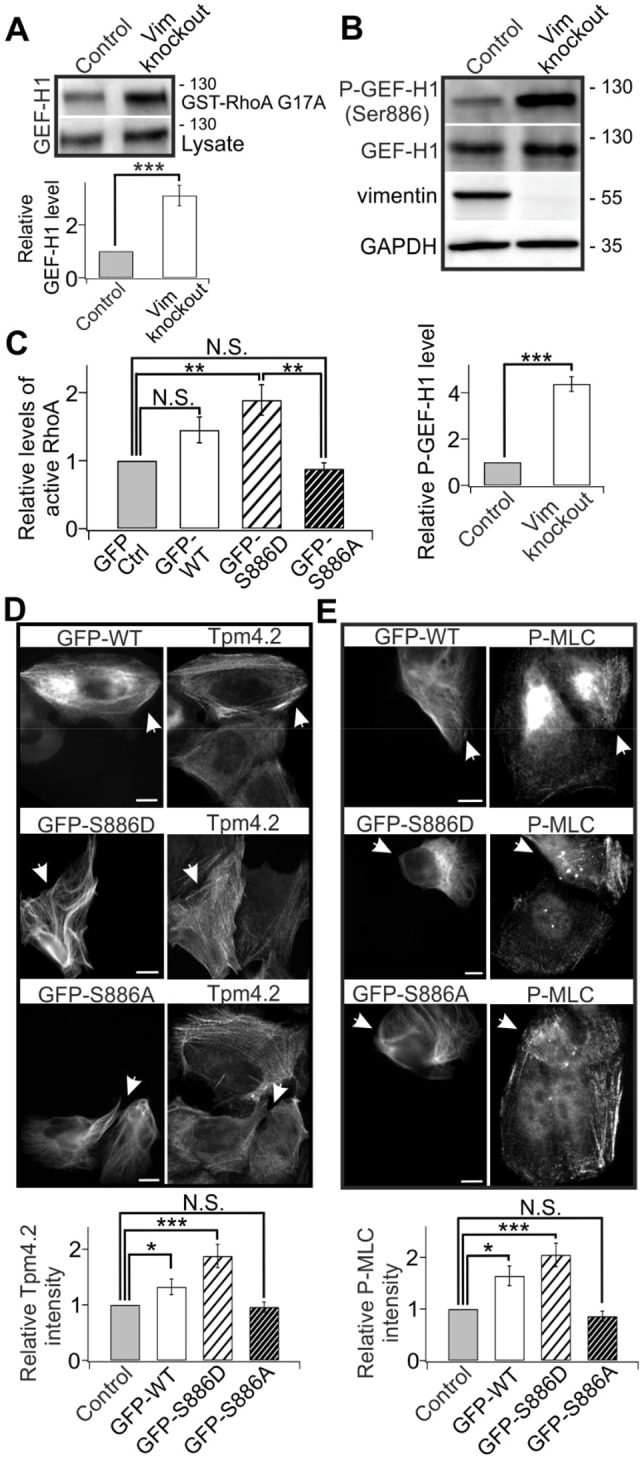
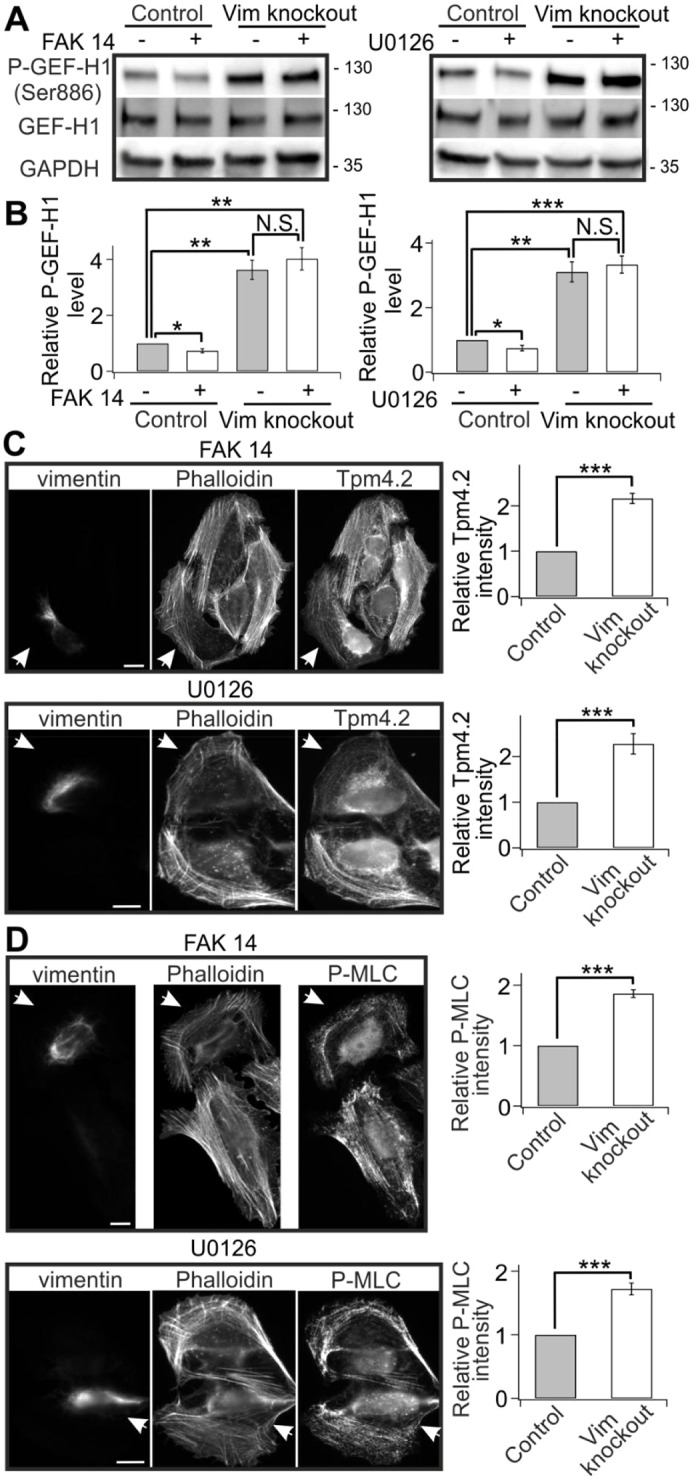
The actin and intermediate filament cytoskeletons contribute to numerous cellular processes, including morphogenesis, cytokinesis and migration. These two cytoskeletal systems associate with each other, but the underlying mechanisms of this interaction are incompletely understood. Here, we show that inactivation of vimentin leads to increased actin stress fiber assembly and contractility, and consequent elevation of myosin light chain phosphorylation and stabilization of tropomyosin-4.2 (see Geeves et al., 2015). The vimentin-knockout phenotypes can be rescued by re-expression of wild-type vimentin, but not by the non-filamentous 'unit length form' vimentin, demonstrating that intact vimentin intermediate filaments are required to facilitate the effects on the actin cytoskeleton. Finally, we provide evidence that the effects of vimentin on stress fibers are mediated by activation of RhoA through its guanine nucleotide exchange factor GEF-H1 (also known as ARHGEF2). Vimentin depletion induces phosphorylation of the microtubule-associated GEF-H1 on Ser886, and thereby promotes RhoA activity and actin stress fiber assembly. Taken together, these data reveal a new mechanism by which intermediate filaments regulate contractile actomyosin bundles, and may explain why elevated vimentin expression levels correlate with increased migration and invasion of cancer cells.

Keywords: Actin; GEF-H1; Intermediate filament; RhoA; Stress fiber; Vimentin.


Conflict of interest statement

Competing interests

The authors declare no competing or financial interests.

Figures

Fig. 1.
Fig. 1.
Vimentin depletion induces stress fiber assembly. (A,B) The intensities of Tpm4.2 and F-actin (as detected by fluorescent phalloidin) are increased in vimentin-knockout U2OS cells (A) and knockdown HDF cells generated using a vimentin siRNA pool (B). Panels on the left show representative images of control (arrowheads) and vimentin-depleted cells that were co-cultured on same plates. Panels on the right show the quantifications of normalized relative Tpm4.2 fluorescent intensities in control (A, 32 cells from nine images; B, 32 cells from nine images) and vimentin-knockout or knockdown cells (A, 38 cells from nine images; B, 33 cells from nine images). Mean intensity values of control and knockout or knockdown cells from each image were used for statistical analysis. ***P<0.001 (paired t-test). (C) Western blot analysis of actin and Tpm4.2 protein levels in control and vimentin-depleted U2OS (left panel) and HDF (right panel) cells. The blots were also probed with vimentin antibody to confirm that the vimentin-knockout U2OS cell culture is not contaminated by wild-type U2OS cells and to verify efficiency of vimentin depletion in siRNA-treated HDF cells, and with GADPH antibody to control equal sample loading. Molecular masses in kilodaltons (kDa) are indicated in the blots. (D) Quantification of the relative levels of actin (left panel) and Tpm4.2 (right panel) normalized to internal control GAPDH from five western blots. *P<0.05, ***P<0.001; N.S., not significant (paired t-test). (E) Vimentin-knockout results in increased cell contractility detected by traction force microscopy. Panels on the left show representative force maps of control and vimentin-knockout cells grown on 25 kPa polyacrylamide dishes with fluorescent nanobeads. The panel on the right shows the quantification of traction forces (root mean square traction) in control cells (n=47) and vimentin-knockout cells (n=47) from three independent experiments. *P<0.05 (Mann–Whitney–Wilcoxon rank-sum test). The data are presented as mean±s.e.m. Scale bars: 10 µm.
Fig. 2.
Fig. 2.
The filamentous form of vimentin is necessary for its effects on stress fiber assembly. (A) The intensity of P-MLC is increased in vimentin-knockout U2OS cells. The panel on the left shows representative images of control (arrowheads) and vimentin-knockout cells that were co-cultured on same plates. The panel on the right shows the quantification of normalized relative P-MLC fluorescent intensities in control (35 cells from nine images) and vimentin-knockout cells (37 cells from nine images). Mean intensity values of control and knockout cells from each image were used for statistical analysis. ***P<0.001 (paired t-test). (B) Western blot analysis of P-MLC levels in control and vimentin-knockout U2OS cells (left panel). The blots were also probed with vimentin antibody to confirm that the vimentin-knockout cell culture is not contaminated by wild-type cells, and with GADPH antibody to verify equal sample loading. Molecular masses in kilodaltons (kDa) are indicated in the blots. The panel on the right shows the normalized relative levels of P-MLC compared to the total MLC protein levels from three western blots. ***P<0.001 (paired t-test). (C,D) Full-length (FL) vimentin rescued the increase of Tpm4.2 (C) and P-MLC (D) levels induced by vimentin depletion. Panels on the left show representative images of vimentin-knockout cells expressing FL-vimentin–GFP (arrowheads) and non-transfected vimentin-knockout cells. Panels on the right show the quantifications of normalized relative Tpm4.2 (C, 33 control cells from eight images; 35 vimentin-knockout cells from eight images) and P-MLC (D, 26 control cells from eight images; 28 vimentin-knockout cells from eight images) fluorescence intensities. Mean intensity values of control and vimentin overexpression cells from each image were used for statistical analysis. **P<0.01 (paired t-test). (E,F) ‘Unit length form’ (ULF) vimentin is not able to rescue the increase of Tpm4.2 (E) and P-MLC (F) levels induced by vimentin depletion. Panels on the left show representative images of vimentin-knockout cells expressing ULF-vimentin–GFP (arrowheads) and non-transfected vimentin-knockout cells. Panels on the right show the quantifications of normalized relative Tpm4.2 (E, 27 control cells from eight images; 32 knockout cells from eight images) and P-MLC (F, 29 control cells from eight images; 28 knockout cells from eight images) fluorescent intensities. Mean intensity values of control and ULF vimentin overexpression cells from each image were used for statistical analysis. The data are presented as mean±s.e.m. N.S., not significant. Scale bars: 10 µm.
Fig. 3.
Fig. 3.
Vimentin depletion increases the levels of active RhoA. (A) G-LISA analysis of the levels of active RhoA in wild-type, vimentin-knockout, vimentin-knockout-rescue and vimentin overexpression U2OS cells. Data are from five independent experiments and were normalized to control cells. *P<0.05, ***P<0.001 (paired t-test). (B) Vimentin depletion does not drastically affect the subcellular localization of RhoA. Representative images show control (indicated by arrows) and vimentin-knockout cells co-cultured on same plates. (C) Western blot analysis of RhoA protein levels in control and vimentin-depleted U2OS cells. The blots were also probed with vimentin antibody to confirm that the vimentin-knockout cell culture is not contaminated by wild-type cells, and with GAPDH antibody to verify equal sample loading. Molecular masses in kilodaltons (kDa) are indicated in the blots. The panel on the right shows the quantified relative levels of RhoA protein normalized to internal control GAPDH from three western blots. (D,E) Expression of dominant negative (DN) RhoA inhibits the increase of Tpm4.2 (D) and P-MLC (E) levels in vimentin-knockout cells. Panels on the left show representative images of DN-RhoA-expressing cells (indicated by arrows) in a vimentin-knockout background. Panels on the right show the quantifications of normalized relative Tpm4.2 (D, 31 control cells from ten images; 25 DN-RhoA expressing cells from ten images) and P-MLC (E, 27 control cells from nine images; 29 DN-RhoA-expressing cells from nine images) fluorescence intensities. Mean intensity values of control and DN-RhoA overexpression cells from each image were used for statistical analysis. ***P<0.001 (paired t-test). The data are presented as mean±s.e.m. N.S., not significant. Scale bars: 10 µm.
Fig. 4.
Fig. 4.
GEF-H1 is critical for vimentin-mediated suppression of RhoA activity. (A) Western blot demonstrating that GEF-H1 was efficiently silenced by siRNA (siGEF-H1) in both control and vimentin-knockout cells. The blot was also probed with GADPH antibody to verify equal sample loading. (B) G-LISA analysis of the levels of active RhoA in GEF-H1-silenced control and vimentin-knockout cells. The data are from five independent experiments and were normalized to results in control cells. ***P<0.001 (paired t-test). (C) Co-immunoprecipitation (IP) of GEF-H1 with vimentin from U2OS cell extracts. Whole-cell extracts were used for immunoprecipitation with an anti-GEF-H1 antibody, then probed with an anti-vimentin antibody. IgG is shown as a negative control. Molecular masses in kilodaltons (kDa) are indicated. (D) Image of a cell transfected with vimentin–mCherry, and stained with GEF-H1 and tubulin antibodies. Magnified regions from the area indicated by a yellow box demonstrate that vimentin filaments often colocalize with GEF-H1-containing microtubules. (E) Endogenous GEF-H1 displayed similar colocalization with microtubules in both control and vimentin-knockout cells. (F) Representative examples of GFP–GEF-H1 dynamics in control and vimentin-knockout cells as examined by FRAP. (G) Averaged recovery curves of the raw data are shown on the left (control n=15; vimentin knockout, n=17). The insert shows the recovery curves during the first 5 s following photobleaching. The averaged curves were fitted with double exponential equation, and mobile fractions and halftime values were calculated from the fitted data. The data are presented as mean±s.e.m. N.S., not significant. Scale bars: 10 µm.
Fig. 5.
Fig. 5.
Vimentin depletion results in increased activity and phosphorylation of GEF-H1. (A) Active GEF-H1 was co-sedimented with GST–RhoA-G17A, and detected by western blotting using an anti-GEF-H1 antibody. The lower panel shows the quantification of normalized relative levels of GEF-H1 co-sedimenting with GST–RhoA-G17A compared to total GEF-H1 levels in cell lysates from five western blots. ***P<0.001 (paired t-test). (B) Western blot analysis of GEF-H1 phosphorylated on Ser886 and total GEF-H1 levels in control and vimentin-knockout cells. The blots were also probed with vimentin antibody to confirm that the vimentin-knockout cell culture is not contaminated by wild-type cells, and with GADPH antibody to verify equal sample loading. The lower panel shows the quantification of normalized relative levels of P-GEF-H1 (Ser886) compared to total GEF-H1 levels from five western blots. ***P<0.001 (paired t-test). Molecular masses in kilodaltons (kDa) are indicated. (C) G-LISA analysis of the levels of active RhoA in wild-type, phospho-mimic (S886D) and phospho-deficient (S886A) GEF-H1-expressing cells. The data are from five independent experiments and were normalized to control cells. **P<0.01 (paired t-test). (D) Tpm4.2 levels are increased in cells expressing the phospho-mimic (S886D) GEF-H1 mutant, but not in cells expressing the phospho-deficient (S886A) mutant. Upper panels show representative images of control cells and cells expressing wild-type or mutant GEF-H1 (arrowheads). The lower panel shows the quantification of normalized relative Tpm4.2 fluorescence intensities (wild-type GEF-H1: 32 control cells from nine images and 31 transfected cells from nine images; GEF-H1-S886D: 32 control cells from ten images and 35 transfected cells from total ten images; GEF-H1-S886A: 32 control cells from nine images and 38 transfected cells from nine images). Mean intensity values of control and GEF-H1 overexpression cells from each image were used for statistical analysis. *P<0.05; ***P<0.001 (paired t-test). (E) P-MLC levels are increased in cells expressing the phospho-mimic (S886D) GEF-H1 mutant, but not in cells expressing the phospho-deficient (S886A) mutant. Upper panels show representative images of control cells and cells expressing wild-type or mutant GEF-H1 (arrowheads). The lower panel shows the quantification of normalized relative P-MLC fluorescence intensities (wild-type GEF-H1: 35 control cells from nine images and 29 transfected cells from nine images; GEF-H1-S886D: 35 control cells from ten images and 33 transfected cells from ten images; GEF-H1-S886A: 35 control cells from nine images and 28 transfected cells from nine images). Mean intensity values of control and GEF-H1 overexpression cells from each image were used for statistical analysis. *P<0.05, ***P<0.001 (paired t-test). The data are presented as mean±s.e.m. N.S., not significant. Scale bars: 10 µm.
Fig. 6.
Fig. 6.
GEF-H1 suppression by vimentin does not involve FAK and its downstream kinases. (A) Western blot analysis of GEF-H1 phosphorylated on Ser886 and total GEF-H1 levels in control and vimentin-depleted U2OS cells incubated in the presence or absence of FAK inhibitor FAK-14 (left panel) or MEK inhibitor U0126 (right panel). The blots were also probed with GADPH antibodies to verify equal sample loading. Molecular masses in kilodaltons (kDa) are indicated. (B) Quantification of normalized relative levels of P-GEF-H1 (Ser886) compared to total GEF-H1 levels from five western blots for each condition. *P<0.05, **P<0.01, ***P<0.001 (paired t-test). (C,D) Immunostainings demonstrating that neither FAK-14 nor U0126 compounds could suppress the increased Tpm4.2 and P-MLC levels that were induced by depletion of vimentin. Wild-type cells in each panel are indicated with arrowheads. Panels on the right show the quantifications of normalized relative Tpm4.2 (C, FAK14: 28 control cells from six images and 29 vimentin-knockout cells from six images; U0126: 31 control cells from seven images and 28 vimentin-knockout cells from seven images) and P-MLC (D, FAK14: 33 control cells from seven images and 34 vimentin-knockout cells from seven images; U0126: 28 control cells from six images and 27 vimentin-knockout cells from six images) fluorescence intensities. Mean intensity values of control and vimentin-knockout cells from each image were used for statistical analysis. ***P<0.001 (paired t-test). The data are presented as mean±s.e.m. N.S., not significant. Scale bars: 10 µm.

References

    1. Abrahamsberg C., Fuchs P., Osmanagic-Myers S., Fischer I., Propst F., Elbe-Burger A. and Wiche G. (2005). Targeted ablation of plectin isoform 1 uncovers role of cytolinker proteins in leukocyte recruitment. Proc. Natl. Acad. Sci. USA 102, 18449-18454. 10.1073/pnas.0505380102 - DOI - PMC - PubMed
    1. Aikawa R., Nagai T., Kudoh S., Zou Y., Tanaka M., Tamura M., Akazawa H., Takano H., Nagai R. and Komuro I. (2002). Integrins play a critical role in mechanical stress-induced p38 MAPK activation. Hypertension 39, 233-238. 10.1161/hy0202.102699 - DOI - PubMed
    1. Andra K., Nikolic B., Stocher M., Drenckhahn D. and Wiche G. (1998). Not just scaffolding: plectin regulates actin dynamics in cultured cells. Genes Dev. 12, 3442-3451. 10.1101/gad.12.21.3442 - DOI - PMC - PubMed
    1. Bhattacharya R., Gonzalez A. M., DeBiase P. J., Trejo H. E., Goldman R. D., Flitney F. W. and Jones J. C. R. (2009). Recruitment of vimentin to the cell surface by beta3 integrin and plectin mediates adhesion strength. J. Cell Sci. 122, 1390-1400. 10.1242/jcs.043042 - DOI - PMC - PubMed
    1. Biondini M., Duclos G., Meyer-Schaller N., Silberzan P., Camonis J. and Parrini M. C. (2015). RalB regulates contractility-driven cancer dissemination upon TGFbeta stimulation via the RhoGEF GEF-H1. Sci. Rep. 5, 11759 10.1038/srep11759 - DOI - PMC - PubMed

Publication types

MeSH terms