. 2017 Jan 10;6(1):3.
doi: 10.1167/tvst.6.1.3. eCollection 2017 Jan.

Quantifying the ON and OFF Contributions to the Flash ERG with the Discrete Wavelet Transform

Affiliations

Quantifying the ON and OFF Contributions to the Flash ERG with the Discrete Wavelet Transform

Mathieu Gauvin et al. Transl Vis Sci Technol. .

Abstract

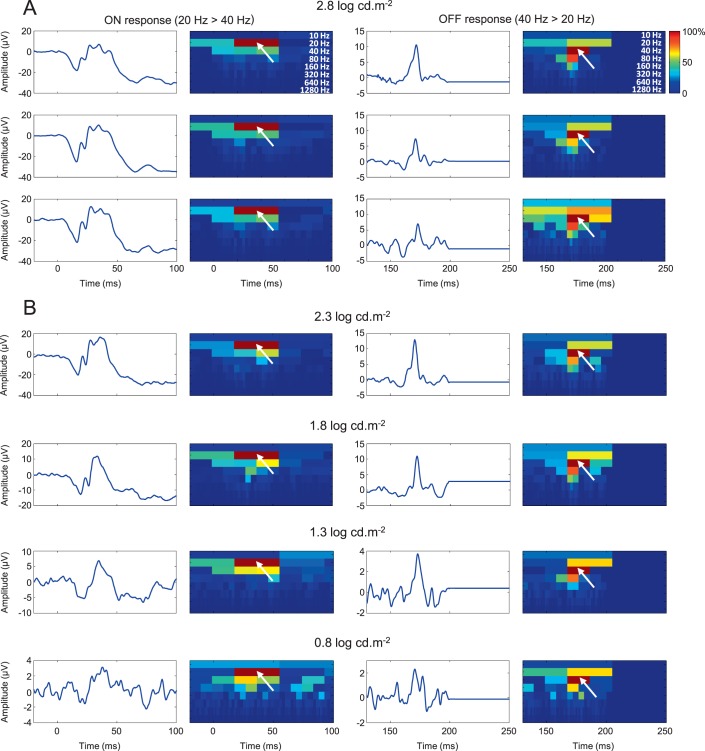
Purpose: Discrete wavelet transform (DWT) analyses suggest that the 20- and 40-Hz components of the short-flash photopic electroretinogram (ERG) are closely related to the ON and OFF pathways, respectively. With the DWT, we examined how the ERG ON and OFF components are modulated by the stimulus intensity and/or duration.

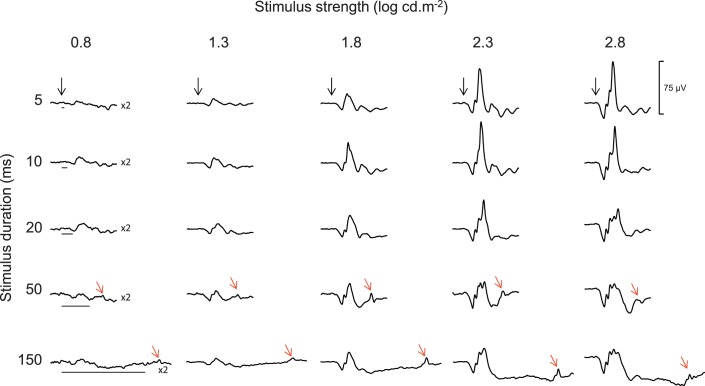
Methods: Discrete wavelet transform descriptors (20, 40 Hz and 40:20-Hz ratio) were extracted from ERGs evoked to 25 combinations of flash durations (150-5 ms) and strengths (0.8-2.8 log cd.m-2).

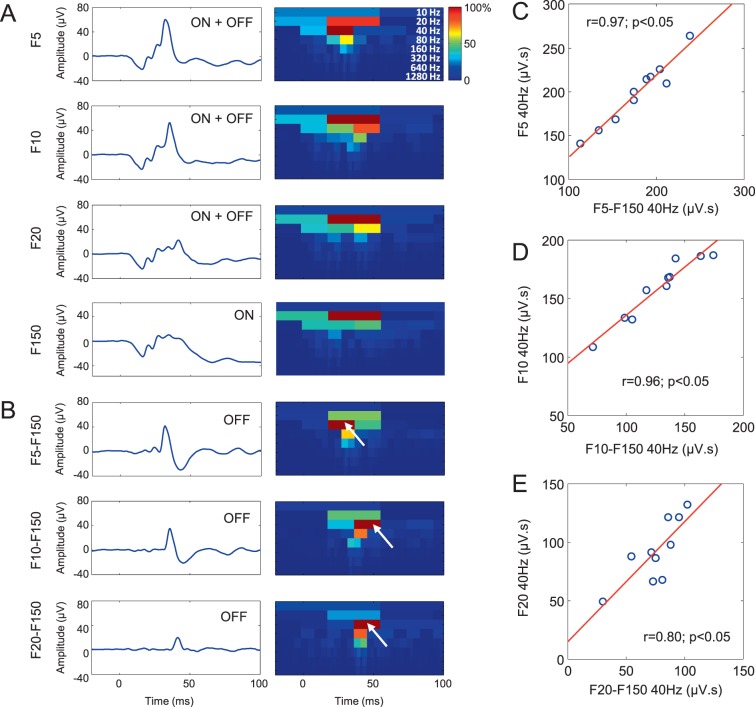
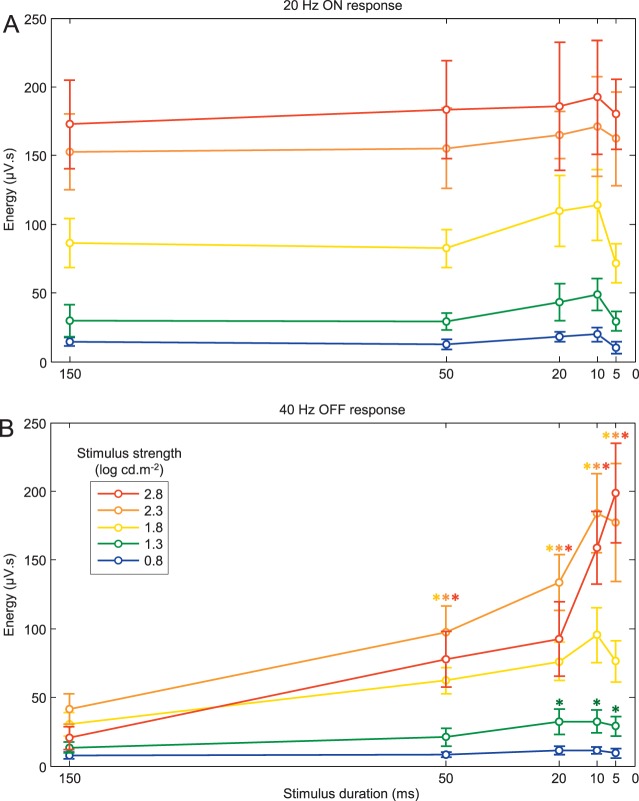
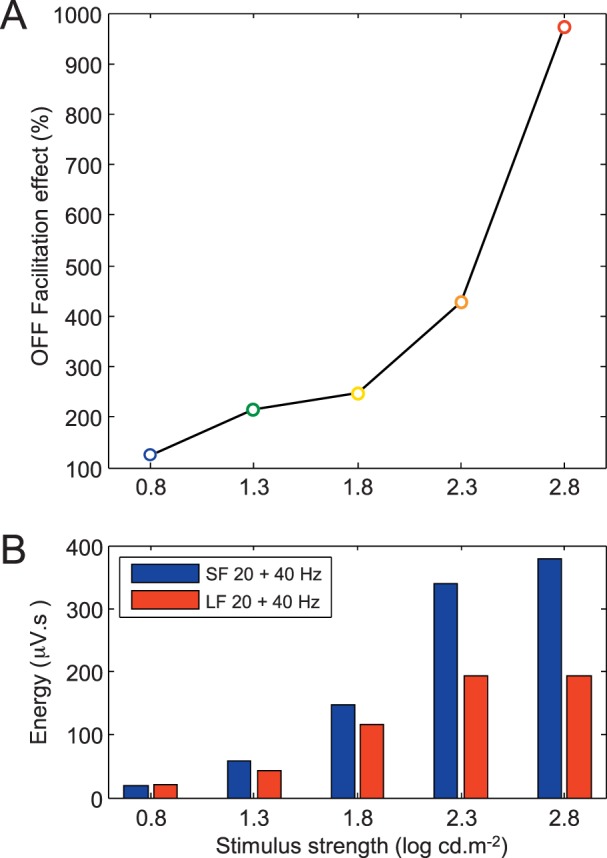
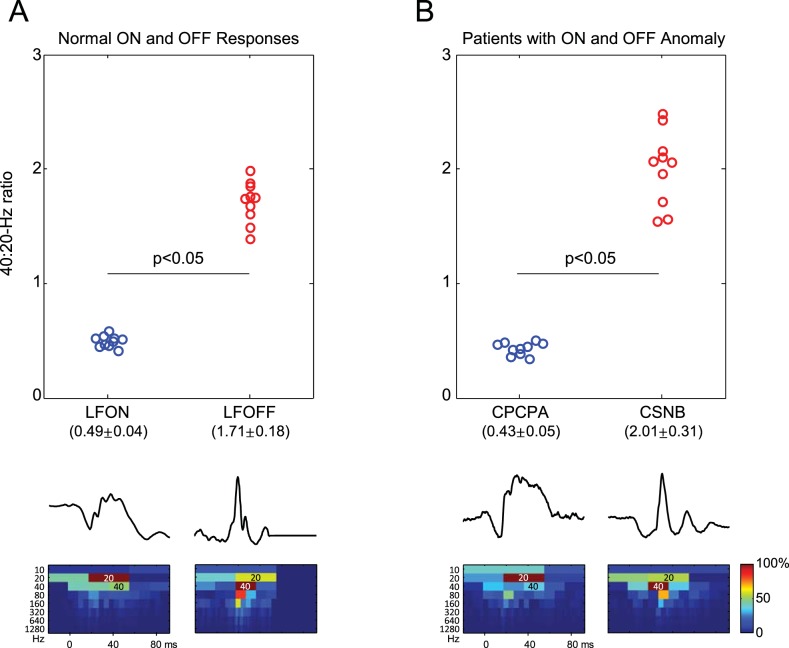
Results: In ERGs evoked to the 150-ms stimulus (to separate the ON and OFF ERGs), the 40:20-Hz ratio of ON ERGs (mean ± SD: 0.49 ± 0.04) was significantly smaller (P < 0.05) than that of OFF ERGs (1.71 ± 0.18) owing to a significantly (P < 0.05) higher contribution of the 20 and 40 Hz components to the ON and OFF ERGs, respectively. With brighter stimuli, the ON and OFF components increased similarly (P < 0.05). While progressively shorter flashes had no impact (P > 0.05) on the ON component, it exponentially enhanced (P < 0.05) the OFF component.

Conclusions: Discrete wavelet transform allows for an accurate determination of ON and OFF retinal pathways even in ERGs evoked to a short flash. To our knowledge, the significant OFF facilitatory effect evidenced with shorter stimuli has not previously been reported.

Translational relevance: The DWT approach should offer a rapid, easy, and reproducible approach to retrospectively and prospectively evaluate the function of the retinal ON and OFF pathways using the standard (short-flash duration) clinical ERG stimulus.

Keywords: ON and OFF; electroretinogram; human; stimulus duration; stimulus strength; wavelet transform.


Conflict of interest statement

M. Gauvin, None; M. Sustar, None; J.M. Little, None; J. Brecelj, None; J.M. Lina, None; P. Lachapelle, None

Figures

Figure 1
Figure 1
Representative ERG traces. Composite ERG signals that were obtained (by averaging the responses of all 10 subjects) using short (5 ms) and long (10, 20, 50 and 150 ms) white flash stimuli of various strengths (0.8, 1.3, 1.8, 2.3, 2.8 log cd.m−2) against a white background of 20 cd.m−2. Vertical black arrows indicate the onset of the stimulus, while black horizontal lines indicate the luminous phase of the stimulus. Red arrows indicate the OFF responses (d-waves). The vertical calibration bar (75 μV) applies to each trace. Traces evoked to the 0.8 log cd.m−2 stimulus were magnified by a factor of 2 for visualization purposes.
Figure 2
Figure 2
Main time-frequency component of ON and OFF responses. (A) Three examples of representative ON and OFF response traces, along with their associated DWT scalograms, obtained using a long (150 ms) white flash stimulus of 2.8 log cd.m−2 in strength. Each ON response is characterized by a strong 20-Hz component (white arrows) that is time-locked to the b-wave. Each OFF response is characterized by a strong 40-Hz component (white arrows) that is time-locked to the d-wave. Each scalogram is normalized to the maximal coefficient (0%–100%). (B) Representative ON and OFF responses, elicited with progressively dimmer flashes (from 2.3 to 0.8 cd.m−2), demonstrating that 20- and 40-Hz components dominated ON and OFF responses, respectively, independently of the stimulus strength. This was not evident for the dimmest flash, where the response was almost at the level of noise.
Figure 3
Figure 3
Main time-frequency component of algebraically extracted OFF responses. (A) Electroretinogram signals obtained by averaging the responses of all 10 subjects and acquired using short-duration stimuli of 5, 10, and 20 ms (identified as F5, F10, F20) where both the ON and OFF responses are merged (ERG = ON + OFF) and a long-duration stimulus of 150 ms (identified as F150) with separated ON and OFF responses. Associated DWT scalograms are shown on the right-hand side of the ERG tracings and are normalized to their maximal coefficients (0%–100%). (B) Algebraically extracted OFF responses obtained by subtracting the long-flash (F150) ON ERG from the mixed ON-OFF ERGs (F5, F10, F20). Associated DWT scalograms are shown on the right-hand side of each tracing. The dominant 40-Hz component contained within these OFF responses is indicated by white arrows. (C–E) Correlations between the 40-Hz component of the mixed ON-OFF ERGs (ordinate) and the 40-Hz component of the algebraically extracted OFF responses (abscissa). Pearson coefficients (r) and associated P values are given in each panel.
Figure 4
Figure 4
Duration/luminance-dependence of 20- and 40-Hz components. (A) Mean (±SD) 20-Hz energy obtained using progressively brighter stimulus strength (0.8: blue curve; 1.3: green curve; 1.8: yellow curve; 2.3: orange curve; 2.8: red curve) and progressively shorter stimulus (from 150 to 5 ms). (B) Mean (±SD) 40-Hz energy obtained using progressively brighter stimulus strength same-color coding as panel A) and progressively shorter stimulus (from 150 to 5 ms).
Figure 5
Figure 5
Stimulus strength dependence of the OFF facilitatory effect. (A) Enhancement of the OFF facilitatory effect (i.e., increase in the energy level of the ERG OFF component with progressively shorter stimuli) with progressively brighter stimuli (abscissa). The OFF facilitatory effect was obtained by dividing the 40-Hz energy level measured in the short-flash (i.e., 5 ms) ERG with that measured in the long-flash (i.e., 150 ms) ERGs multiplied by 100. (B) Comparison between the summation of the 20- and 40-Hz components of the short-flash (SF: 5 ms) ERG (blue bars) with the summated 20- and 40-Hz components of the ON and OFF ERGs evoked to a long-flash (LF: 150 ms) stimuli (red bars) of increasing intensities (as indicated at the bottom of each bar graph).
Figure 6
Figure 6
Correlations between short- (SF) and long-duration flash (LF) responses. (A) Correlation between the 20-Hz component of the SF ERG and the 20-Hz component of the ON response of the long-flash ERG. (B) Correlation between the 40-Hz component of the short-flash ERG and the 40-Hz component of the OFF response of the long-flash ERG. (C) Correlation between the 20-Hz component of the short-flash ERG and the 40-Hz component of the OFF response of the long-flash ERG. (D) Correlation between the 40-Hz component of the short-flash ERG and the 20-Hz component of the ON response of the long-flash ERG. Coefficients of correlation (r) and associated P values are indicated on each graph. Nonsignificant P values are indicated as NS. In panels A to D, the black circles represent the data points from each of the 10 subjects.
Figure 7
Figure 7
Comparison of normal ON and OFF ERG components with CPCPA and CSNB responses. (A) The 40:20-Hz energy ratio was used to segregate the long-flash (LF) ON responses (LFON; blue circles) from the LF OFF responses (LFOFF; red circles). Representative LFON and LFOFF responses and the corresponding DWT scalograms are shown at the bottom of panel A. (B) A similar 40:20-Hz energy ratio was obtained from the short-flash ERGs recorded in patients presenting with an OFF-specific anomaly (CPCPA; blue circles) or an ON-specific anomaly (CSNB; red circles). Representative CPCPA and CSNB ERGs and corresponding DWT scalograms are shown at the bottom of panel B. In the scalograms, the highly energetic dark-red coefficients (indicated as 20 Hz or 40 Hz) further demonstrate the dominant 20- or 40-Hz component measured in LFON and CPCPA ERGs or in LFOFF and CSNB ERGs, respectively.

Similar articles

Cited by

References

    1. Sieving PA,, Murayama K,, Naarendorp F. Push-pull model of the primate photopic electroretinogram: a role for hyperpolarizing neurons in shaping the b-wave. Vis Neurosci. 1994. ; 11: 519–532. - PubMed
    1. Gauvin M,, Little JM,, Lina JM,, Lachapelle P. Functional decomposition of the human ERG based on the discrete wavelet transform. J Vis. 2015. ; 15: 14. - PubMed
    1. Sieving PA, Photopic ON- and OFF-pathway abnormalities in retinal dystrophies. Trans Am Ophthalmol Soc. 1993. ; 91: 701–773. - PMC - PubMed
    1. Ueno S,, Kondo M,, Ueno M,, Miyata K,, Terasaki H,, Miyake Y. Contribution of retinal neurons to d-wave of primate photopic electroretinograms. Vision Res. 2006. ; 46: 658–664. - PubMed
    1. Hawlina M,, Konec B. New noncorneal HK-loop electrode for clinical electroretinography. Doc Ophthalmol. 1992. ; 81: 253–259. - PubMed