. 2017 Jan 10:5:e2803.
doi: 10.7717/peerj.2803. eCollection 2017.

Microbial communities mediating algal detritus turnover under anaerobic conditions

Affiliations

Microbial communities mediating algal detritus turnover under anaerobic conditions

Jessica M Morrison et al. PeerJ. .

Abstract

Background: Algae encompass a wide array of photosynthetic organisms that are ubiquitously distributed in aquatic and terrestrial habitats. Algal species often bloom in aquatic ecosystems, providing a significant autochthonous carbon input to the deeper anoxic layers in stratified water bodies. In addition, various algal species have been touted as promising candidates for anaerobic biogas production from biomass. Surprisingly, in spite of its ecological and economic relevance, the microbial community involved in algal detritus turnover under anaerobic conditions remains largely unexplored.

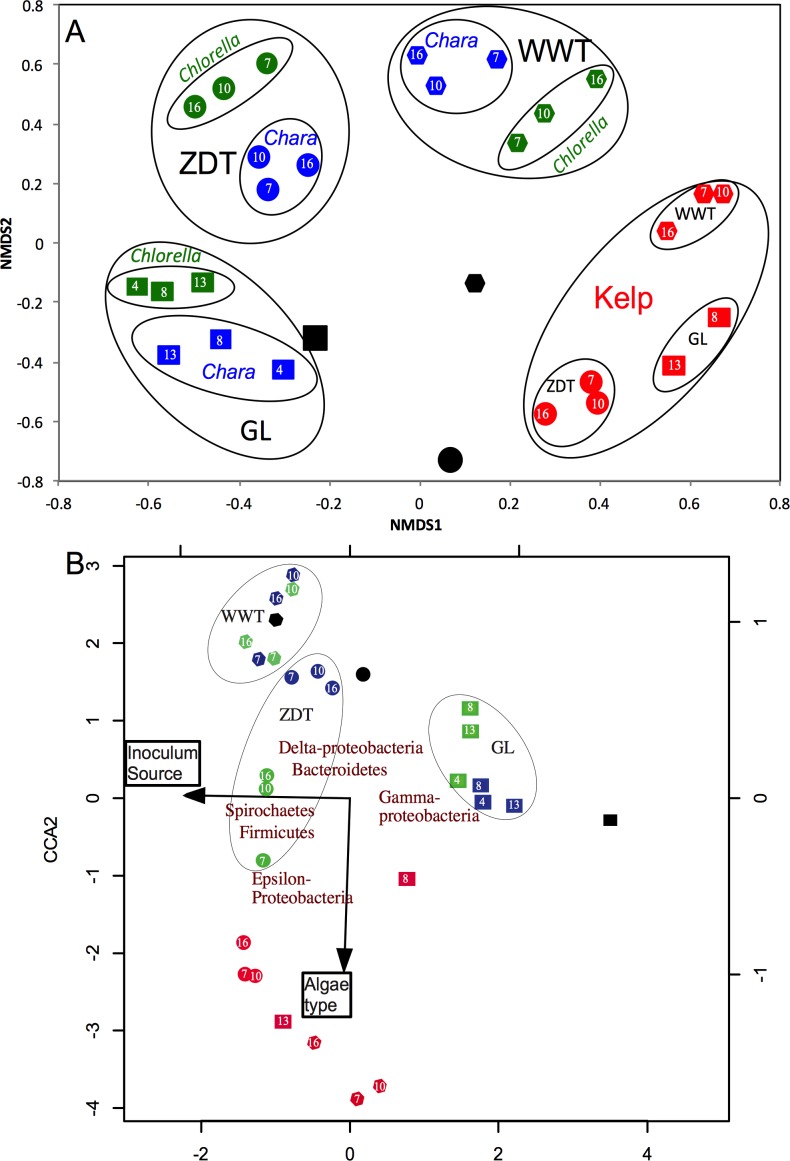
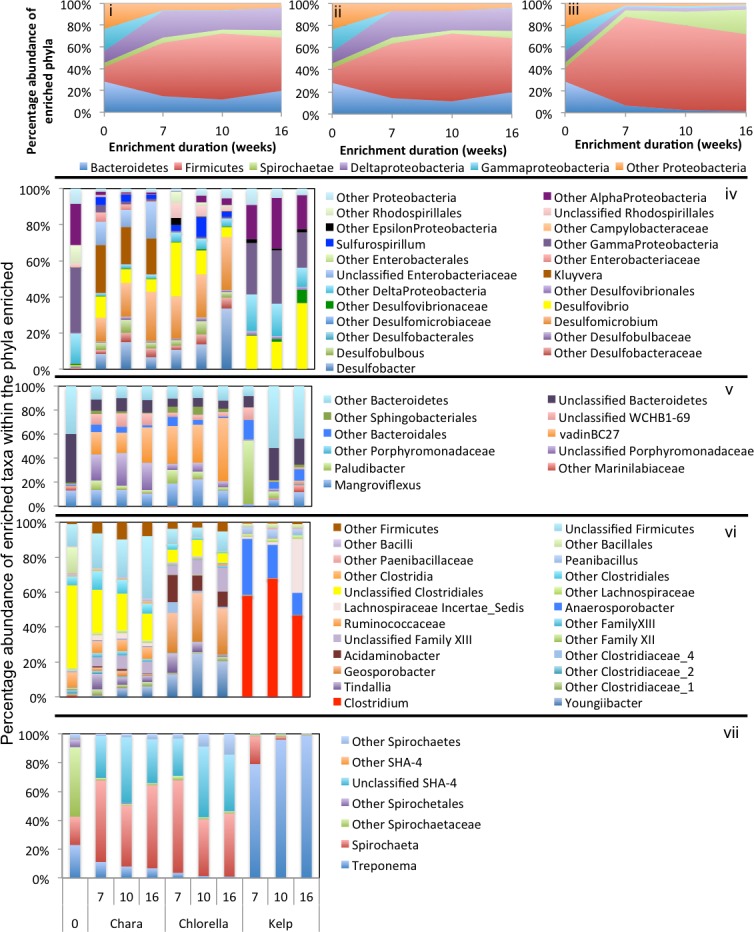
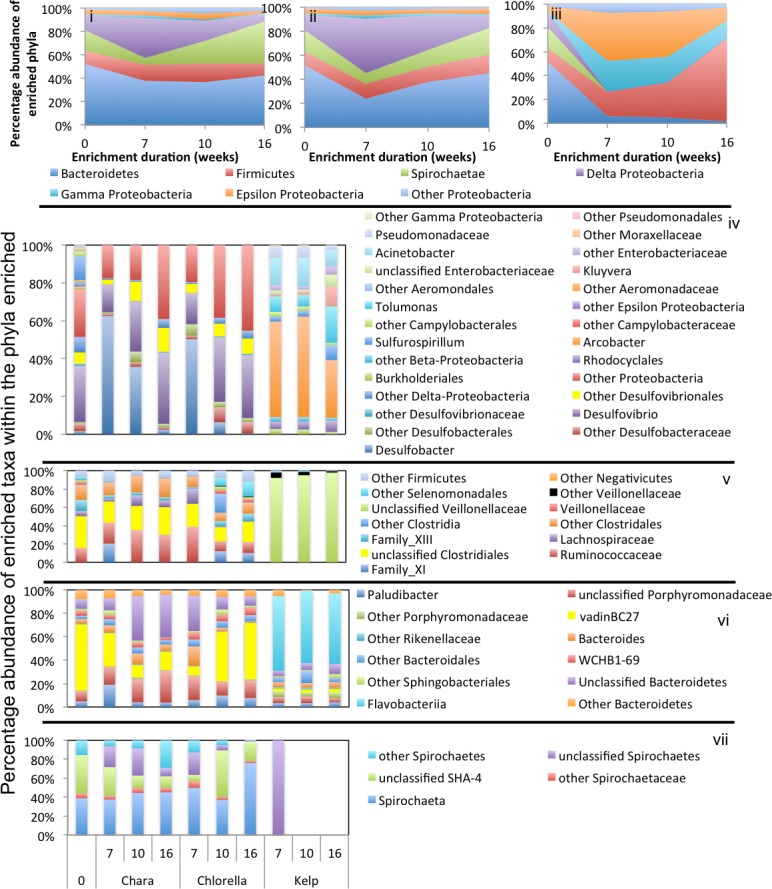
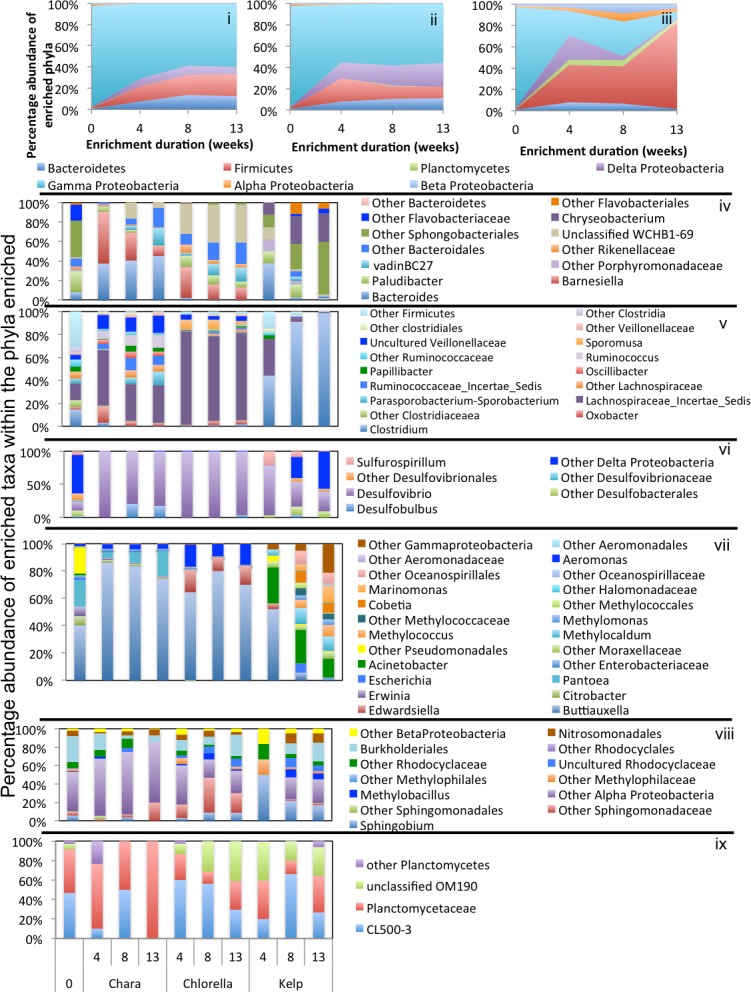
Results: Here, we characterized the microbial communities mediating the degradation of Chlorella vulgaris (Chlorophyta), Chara sp. strain IWP1 (Charophyceae), and kelp Ascophyllum nodosum (phylum Phaeophyceae), using sediments from an anaerobic spring (Zodlteone spring, OK; ZDT), sludge from a secondary digester in a local wastewater treatment plant (Stillwater, OK; WWT), and deeper anoxic layers from a seasonally stratified lake (Grand Lake O' the Cherokees, OK; GL) as inoculum sources. Within all enrichments, the majority of algal biomass was metabolized within 13-16 weeks, and the process was accompanied by an increase in cell numbers and a decrease in community diversity. Community surveys based on the V4 region of the 16S rRNA gene identified different lineages belonging to the phyla Bacteroidetes, Proteobacteria (alpha, delta, gamma, and epsilon classes), Spirochaetes, and Firmicutes that were selectively abundant under various substrate and inoculum conditions. Within all kelp enrichments, the microbial communities structures at the conclusion of the experiment were highly similar regardless of the enrichment source, and were dominated by the genus Clostridium, or family Veillonellaceae within the Firmicutes. In all other enrichments the final microbial community was dependent on the inoculum source, rather than the type of algae utilized as substrate. Lineages enriched included the uncultured groups VadinBC27 and WCHB1-69 within the Bacteroidetes, genus Spirochaeta and the uncultured group SHA-4 within Spirochaetes, Ruminococcaceae, Lachnospiraceae, Yongiibacter, Geosporobacter, and Acidaminobacter within the Firmicutes, and genera Kluyvera, Pantoea, Edwardsiella and Aeromonas, and Buttiauxella within the Gamma-Proteobaceteria order Enterobacteriales.

Conclusions: Our results represent the first systematic survey of microbial communities mediating turnover of algal biomass under anaerobic conditions, and highlights the diversity of lineages putatively involved in the degradation process.

Keywords: Algal detritus; Anaerobic degradation; Enrichment.


Conflict of interest statement

The authors declare there are no competing interests. Richard M. Zamor and Steve Nikolai are employees of Grand River Dam Authority (GRDA).

Figures

Figure 1
Figure 1. Total number of bacterial, archaeal, sulfate-reducing, and methanogenic cells in the pre-enrichment sample (■) versus post-enrichment samples at week 4 for GL enrichments or week 7 for ZDT and WWT enrichment (□), post-enrichment samples at week 8 for GL enrichments or week 10 for ZDT and WWT enrichment ( ), and post-enrichment samples at week 13 for GL enrichments or week 16 for ZDT and WWT enrichment ( ) as measured by quantitative PCR.
The enrichment inoculum source is shown on the left, while the algae type used is shown on top. Error bars are averages ± standard deviations from three biological replicates. Linear regression analysis was performed to examine the trend of increase in cell numbers with the weeks of enrichment, and the significance of such trend was tested by calculating the P-values of the F-statistics obtained, where “**” denotes significant P-value < 0.05, “*” denotes p-value > 0.05 but < 0.1, “NS” denotes non-significant P-value > 0.1, and “ND” refers to cases where the linear regression analysis was not performed because two or more samples were below the detection level of the qPCR. In the few cases, denoted by a superscript letter a, where the total cell numbers increased initially then decreased by the last week of enrichment, the linear regression was only carried on total numbers from the first three weeks of enrichments.
Figure 2
Figure 2. Microbial community structure analysis in the enrichment microcosms (n = 26) as compared to the pre-enrichment inoculum sources (n = 3).
The inoculum sources are denoted by shapes; ZDT (●), WWT (⬣), and GL (■), and the algae types are denoted by color; Chara (blue), Chlorella (green), Kelp (red), and no algae, i.e., pre-enrichment community, (black). Each enrichment condition (inoculum source × algae type) is represented by 3 sample points corresponding to the weeks during enrichment, except for GL-kelp enrichment where the dataset from week 4 is not shown due to the small number of sequences obtained with this dataset. (A) Non-metric multidimensional scaling plots based on Bray–Curtis dissimilarity indices at the species level (0.03). For Chara and Chlorella enrichments, communities grouped by the inoculum source, while Kelp enrichments grouped by the algae type. (B) Canonical correspondence analysis using the abundant phyla/classes relative abundances to study the effect of algae type and inoculum source on the microbial community composition. Here, the same pattern is observed at the phylum/class level, where the community structure of Chara and Chlorella enrichments were similar and grouped by inoculum source, while the microbial community of Kelp enrichments were quite distinct and grouped together regardless of the inoculum source. This pattern is reflected on the direction of the factors arrows, where the algae type is pointing in the direction of the Kelp enrichments. The CCA also depicts the abundant phyla/classes that seem to shape the microbial community in the different enrichments; Gamma-Proteobacteria in GL Chara and Chlorella enrichments, Spirochaetes and Firmicutes in ZDT-Chlorella enrichment, Delta-Proteobacteria and Bacteroidetes in ZDT-Chara enrichments and WWT Chara and Chlorella enrichments, and Epsilon-Proteobacteria and Firmicutes in Kelp enrichments regardless of the inoculum source. The constrained variables explained 57% of the variance.
Figure 3
Figure 3. Microbial community composition in ZDT enrichments.
Abundant phyla/classes are shown as area charts for Chara (i), Chlorella (ii), and Kelp (iii) enrichments for each inoculum source. Phyla that constituted 5% or more of the community at any time during enrichment were considered significant to the degradation process and are shown in the area charts. These include phyla that were abundant prior to enrichment and remained abundant during and after enrichment (e.g., Bacteroidetes in Chara and Chlorella enrichments (i, ii)), and phyla that significantly and progressively increased in abundance with enrichment time (e.g., Firmicutes in Kelp enrichments (iii)). Bar charts depict the relative abundance of abundant genera (>1%) in each of the abundant phyla/classes shown in i-ii-iii. These include Proteobacteria (iv), Bacteroidetes (v), Firmicutes (vi), and Spirochaetes (vii). The X-axis denotes the weeks of enrichment (i–iii), or the weeks of enrichment and algae type (iv–vii). “0” denotes the community composition in the pre-enrichment inoculum source.
Figure 4
Figure 4. Microbial community composition in WWT enrichments.
Abundant phyla/classes are shown as area charts for Chara (i), Chlorella (ii), and Kelp (iii) enrichments for each inoculum source. Phyla that constituted 5% or more of the community at any time during enrichment were considered significant to the degradation process and are shown in the area charts. These include phyla that were abundant prior to enrichment and remained abundant during and after enrichment (e.g., Bacteroidetes in Chara and Chlorella enrichments (i, ii)), phyla that transiently increased in abundance during part of the enrichment but then decreased in abundance by the end of enrichment (e.g., Delta-Proteobacteria in Chara and Chlorella enrichments (i, ii)), and phyla that significantly and progressively increased in abundance with enrichment time (e.g., Firmicutes in Kelp enrichments (iii)). Bar charts depict the relative abundance of abundant genera (>1%) in each of the abundant phyla/classes shown in i-ii-iii. These include Proteobacteria (iv), Firmicutes (v), Bacteroidetes (vi), and Spirochaetes (vii). The X-axis denotes the weeks of enrichment (i–iii), or the weeks of enrichment and algae type (iv–vii). “0” denotes the community composition in the pre-enrichment inoculum source.
Figure 5
Figure 5. Microbial community composition in GL enrichments.
Abundant phyla/classes are shown as area charts for Chara (i), Chlorella (ii), and Kelp (iii) enrichments for each inoculum source. Phyla that constituted 5% or more of the community at any time during enrichment were considered significant to the degradation process and are shown in the area charts. These include phyla that were abundant prior to enrichment and remained abundant during and after enrichment (Gamma-Proteobacteria in Chara and Chlorella enrichments (i, ii)), and phyla that significantly and progressively increased in abundance with enrichment time (e.g., Firmicutes in Kelp enrichments (iii)). Bar charts depict the relative abundance of abundant genera (>1%) in each of the abundant phyla/classes shown in i-ii-iii. These include Bacteroidetes (iv), Firmicutes (v), Delta and Epsilon-Proteobacteria (vi), Gamma-Proteobacteria (vii), Alpha and Beta Proteobacteria (viii), and Planctomycetes (ix). The X-axis denotes the weeks of enrichment (i–iii), or the weeks of enrichment and algae type (iv–ix). “0” denotes the community composition in the pre-enrichment inoculum source.

References

    1. Abbott DW, Boraston AB. Structural biology of pectin degradation by Enterobacteriaceae. Microbiology and Molecular Biology Reviews. 2008;72:301–316. doi: 10.1128/MMBR.00038-07. - DOI - PMC - PubMed
    1. Adamberg K, Tomson K, Talve T, Pudova K, Puurand M, Visnapuu T, Alamäe T, Adamberg S. Levan enhances associated growth of Bacteroides, Escherichia, Streptococcus and Faecalibacterium in fecal microbiota. PLOS ONE. 2015;10:e0144042. doi: 10.1371/journal.pone.0144042. - DOI - PMC - PubMed
    1. Amaral-Zettler L. Algae. In: Gargaud M, Amils R, Quintanilla JC, Cleaves HJ, Irvine WM, Pinti DL, Viso M, editors. Encyclopedia of Astrobiology. Berlin, Heidelberg: Springer; 2011. pp. 27–28.
    1. Amin SA, Parker MS, Armbrust EV. Interactions between Diatoms and Bacteria. Microbiology and Molecular Biology Reviews. 2012;76:667–684. doi: 10.1128/MMBR.00007-12. - DOI - PMC - PubMed
    1. Angel R, Claus P, Conrad R. Methanogenic archaea are globally ubiquitous in aerated soils and become active under wet anoxic conditions. ISME Journal. 2012;6:847–862. doi: 10.1038/ismej.2011.141. - DOI - PMC - PubMed

LinkOut - more resources