. 2017 Jan 10:5:e2832.
doi: 10.7717/peerj.2832. eCollection 2017.

Comprehensive transcriptome analysis provides new insights into nutritional strategies and phylogenetic relationships of chrysophytes

Affiliations

Comprehensive transcriptome analysis provides new insights into nutritional strategies and phylogenetic relationships of chrysophytes

Daniela Beisser et al. PeerJ. .

Abstract

Background: Chrysophytes are protist model species in ecology and ecophysiology and important grazers of bacteria-sized microorganisms and primary producers. However, they have not yet been investigated in detail at the molecular level, and no genomic and only little transcriptomic information is available. Chrysophytes exhibit different trophic modes: while phototrophic chrysophytes perform only photosynthesis, mixotrophs can gain carbon from bacterial food as well as from photosynthesis, and heterotrophs solely feed on bacteria-sized microorganisms. Recent phylogenies and megasystematics demonstrate an immense complexity of eukaryotic diversity with numerous transitions between phototrophic and heterotrophic organisms. The question we aim to answer is how the diverse nutritional strategies, accompanied or brought about by a reduction of the plasmid and size reduction in heterotrophic strains, affect physiology and molecular processes.

Results: We sequenced the mRNA of 18 chrysophyte strains on the Illumina HiSeq platform and analysed the transcriptomes to determine relations between the trophic mode (mixotrophic vs. heterotrophic) and gene expression. We observed an enrichment of genes for photosynthesis, porphyrin and chlorophyll metabolism for phototrophic and mixotrophic strains that can perform photosynthesis. Genes involved in nutrient absorption, environmental information processing and various transporters (e.g., monosaccharide, peptide, lipid transporters) were present or highly expressed only in heterotrophic strains that have to sense, digest and absorb bacterial food. We furthermore present a transcriptome-based alignment-free phylogeny construction approach using transcripts assembled from short reads to determine the evolutionary relationships between the strains and the possible influence of nutritional strategies on the reconstructed phylogeny. We discuss the resulting phylogenies in comparison to those from established approaches based on ribosomal RNA and orthologous genes. Finally, we make functionally annotated reference transcriptomes of each strain available to the community, significantly enhancing publicly available data on Chrysophyceae.

Conclusions: Our study is the first comprehensive transcriptomic characterisation of a diverse set of Chrysophyceaen strains. In addition, we showcase the possibility of inferring phylogenies from assembled transcriptomes using an alignment-free approach. The raw and functionally annotated data we provide will prove beneficial for further examination of the diversity within this taxon. Our molecular characterisation of different trophic modes presents a first such example.

Keywords: Alignment-free phylogeny; Chrysophyceae; Differential expression analysis; Molecular phylogeny; Nutritional strategy; Pathway analysis; Protists; RNA-Seq; Transcriptomics.


Conflict of interest statement

Sven Rahmann is an Academic Editor for PeerJ.

Figures

Figure 1
Figure 1. Statistics for transcriptomes assembled with Trinity.
(A) shows the GC content of each strain. Since the GC content separates the trophic modes, the other panels were also sorted by GC content. (B) shows the estimated transcriptome sizes (total number of bases in transcriptome). (C) shows N50 value of each strain (contig length such that half of the transcriptome is in contigs longer than this length). (D) shows the number of assembled transcripts (light colour) and components (approximately genes; dark colour) for each sample.
Figure 2
Figure 2. Number of annotations to KEGG genes, KEGG Orthology IDs (KOs) and to KEGG pathways from all transcripts of each sample (A) and the number of unique KOs and KEGG pathways for each sample (B).
Strains on the x-axis are sorted and coloured according to Fig. 1.
Figure 3
Figure 3. Completeness of KEGG essential modules.
(A) shows pathway modules, (B) shows structural complexes. Modules are considered operational if all enzymes necessary for the reaction steps or proteins constituting a complex are present. Pathway modules are coloured in green if at most one enzyme is missing, in blue if more than one enzyme is missing, but the central module is complete (e.g., complete module: M00001 Glycolysis (Embden-Meyerhof pathway); central module: M00002 Glycolysis, core module involving three-carbon compounds) and in red if more than one enzyme and the core module are missing. Structural complexes consist of several modules, e.g., ATP synthesis consists of 22 modules. Structural complexes are coloured in green if the majority of the modules is functional, in blue if less then half of them are present and in red if the structural complex is missing. Strains on the x-axis are sorted and coloured according to Fig. 1.
Figure 4
Figure 4. Most highly expressed pathways per sample, such that contained genes explain 50% of the total expression.
Pathways are coloured and grouped according to their KEGG hierarchy II displayed below the pathway legend, e.g., all blue colours, number 5, belong to energy metabolism. Samples names are sorted and coloured according to Fig. 1.
Figure 5
Figure 5. Principal component analysis (PCA) of normalized expression profiles.
Depicted are the first and second component, which separate the mixotrophic (blue) and heterotrophic (green) strains, indicated by the dashed line, while the phototrophic (black) lies on the border of the mixotrophic group. The first and second component together explain 29.88% of the variance.
Figure 6
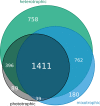
Figure 6. Gene content analysis.
In our group of samples, the trophic groups share a core genome of 1,411 orthologous genes; phototrophs have in addition 89, mixotrophs 180 and heterotrophs 758 group-specific genes.
Figure 7
Figure 7. Pathways enriched for differentially expressed KOs between hetreotrophic and mixotrophic strains.
Each row represents a pathway; the cells in a row represent KOs of the respective pathway. KOs showing a significant difference in expression (Benjamini–Hochberg adjusted p-value < 0.1) between trophic modes were used in a pathway enrichment analysis. For enriched pathways (p-value < 0.1), all KO IDs belonging to the pathway are shown, and significantly differential KOs are colored with their log-fold change. Yellow indicates a higher expression in the mixotrophs while blue shows a higher expression of the gene in heterotrophs.
Figure 8
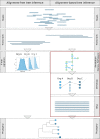
Figure 8. Overview of alignment-free and alignment-based gene-centric approaches of phylogenetic inference.
Both approaches include the assembly of reads to transcripts using Trinity (Grabherr et al., 2011). Based on the transcript sequences in the alignment-free approach, k-mers were counted (4-mers and 6-mers) and used to calculate transcriptome signatures. Using the euclidean distance between the signatures, trees were constructed using the Unweighted Paired Group Method with Arithmetic Mean (UPGMA). In contrast, for the alignment-based approach, the steps marked in red differ. Here the transcripts were annotated with KEGG genes, pathways and KEGG orthology information (Kanehisa & Goto, 2000). The KEGG orthology information was used to find orthologous genes between all strains. Multiple sequence alignments were constructed with MAFFT (Katoh & Standley, 2013) using overlapping regions of the transcripts of all 18 strains. One or several transcripts, constituting splice variants or alternative assemblies, were included if they feature an adequate length. Based on the multiple sequence alignments, a model test was performed and a bootstrapped maximum-likelihood phylogeny estimated.
Figure 9
Figure 9. Inferred phylogenetic trees.
K-mer based approaches (A–C) and a multigene based approach (D) were used to calculate phylogenetic trees from transcript sequences. (A) shows the k-mer based phylogenetic tree calculated on transcript sequences, (B) on calculated CDS in transcripts and panel (C) on calculated CDS of transcripts that are present in all strains. (D) depicts the maximum likelihood phylogenetic tree from 8 concatenated multiple sequence alignments of transcript sequences. Bootstrap values are shown for the inner nodes of the trees in A–D (values > 50 are shown). Grey boxes indicate the genera, order and clades of the Chrysophyceae species. Strains are coloured according to their trophic mode.

References

    1. Adl SM, Simpson AGB, Lane CE, Lukeš J, Bass D, Bowser SS, Brown MW, Burki F, Dunthorn M, Hampl V, Heiss A, Hoppenrath M, Lara E, Le Gall L, Lynn DH, McManus H, Mitchell EAD, Mozley-Stanridge SE, Parfrey LW, Pawlowski J, Rueckert S, Shadwick RS, Shadwick L, Schoch CL, Smirnov A, Spiegel FW. The revised classification of eukaryotes. The Journal of Eukaryotic Microbiology. 2012;59(5):429–493. doi: 10.1111/j.1550-7408.2012.00644.x. - DOI - PMC - PubMed
    1. Ahmed N. Metabolism and functions of polyamines. Biochemical Education. 1987;15(3):106–110. doi: 10.1016/0307-4412(87)90037-9. - DOI
    1. Andersen RA. Molecular systematics of the Chrysophyceae and Synurophyceae. In: Brodie J, Lewis J, editors. Unravelling the algae —the past, present, and future of algal systematics. CRC Press; Boca Raton: 2007. pp. 285–313. (Systematics association special volumes).
    1. Andrews S. FastQC a quality control tool for high throughput sequence data. [Software] 2012. http://www.bioinformatics.babraham.ac.uk/projects/fastqc/ http://www.bioinformatics.babraham.ac.uk/projects/fastqc/
    1. Beisser D, Graupner N, Bock C, Wodniok S, Grossmann L, Vos M, Sures B, Rahmann S, Boenigk J. Raw sequence data and assembled transcripts at ENA EBI. 2016. http://www.ebi.ac.uk/ena/data/search?query=PRJEB13662. [2016 July 25]. http://www.ebi.ac.uk/ena/data/search?query=PRJEB13662

LinkOut - more resources