. 2016 Dec 28;4(4):293-299.
doi: 10.14218/JCTH.2016.00046. Epub 2016 Dec 26.

miR-29a Promotes Lipid Droplet and Triglyceride Formation in HCV Infection by Inducing Expression of SREBP-1c and CAV1

Affiliations

miR-29a Promotes Lipid Droplet and Triglyceride Formation in HCV Infection by Inducing Expression of SREBP-1c and CAV1

Mennatallah Mamdouh Mahdy et al. J Clin Transl Hepatol. .

Abstract

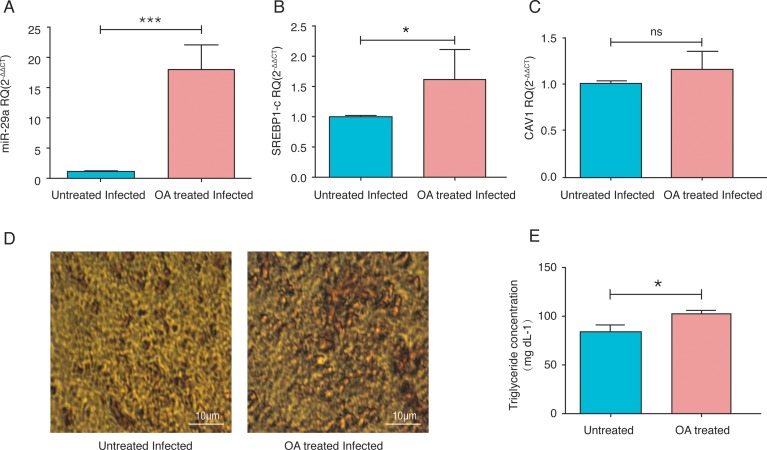
Aims: To examine the regulation of SREBP-1c and CAV1 by microRNA-29a (miR-29a) in cells infected with hepatitis C virus (HCV) in an attempt to control HCV-induced non-alcoholic fatty liver disease. Methods: In order to examine the manipulation of SREBP-1c and CAV1 by miR-29a, oleic acid (OA)-treated JFH-I-infected Huh-7 cells were used. OA was added 24 h post-transfection and gene expression was investigated by qRT-PCR at 48 h post treatment. The functional impact of the observed alteration in SREBP-1c and CAV1 expression was analyzed by examining lipid droplet (LD) and triglyceride (TG) content at 72 h post-OA treatment using light microscopy and spectrophotometry, respectively. Viral load was quantified by qRT-PCR at 72 h post-transfection. Results: OA treatment induced the expression of miR-29a and SREBP-1c, as compared to untreated cells. Forced miR-29a expression led to a significant up-regulation of SREBP-1c as well as CAV1 compared to mock untransfected cells. Ectopic expression of miR-29a resulted in a marked increase in LDs and their respective TGs, while miR-29a antagomirs decreased both the LD and TG content compared to mock untransfected cells. Moreover, forcing the expression of miR-29a in JFH-1 HCV-infected Huh-7 cells resulted in 53% reduction in viral titers compared to mock untransfected Huh-7 cells. Conclusion: Inducing miR-29a expression significantly induces SREBP-1c and CAV1 expression, thereby increasing LDs as well as their respective TGs. Nonetheless, forcing the expression of miR-29a resulted in reduction of HCV RNA levels in Huh-7 cells.

Keywords: Caveolin-1; HCV; Lipid droplets; MicroRNA-29a; SREBP-1c.


Conflict of interest statement

None

Figures

Fig. 1.
Fig. 1.. Impact of oleic acid (OA) treatment on miR-29a, SREBP-1c and CAV1 mRNA expression and on lipid droplet (LD) and triglyceride (TG) content in JFH-I-infected Huh-7 cells.
The OA treatment led to A) significant up-regulation of miR-29a mRNA expression (17.74 ± 2.162, p = 0.0002***, n = 5), B) significant up-regulation of SREBP-1c mRNA expression (1.591 ± 0.2129, p = 0.0443*, n = 5) and C) no significant change in the mRNA expression of CAV1 (1.153 ± 0.1940, n = 10), as compared to untreated cells (1.010 ± 0.08429), (1.000 ± 0.009492), (1.003 ± 0.02906), respectively. Results are expressed as a mean ± SEM. OA treatment led to D) marked increase in LDs, as shown by increase in the red coloration due to the oil red O staining, and as compared to untreated cells, n = 3. Scale bars of 10 μm are shown on the images. E) TG concentration is significantly increased upon OA treatment (102.3 ± 3.068, p = 0.0305*, n = 5) compared to untreated cells (84.58 ± 6.573). Results are expressed as a mean ± SEM. Student’s t-test was used for the statistical analysis.
Fig. 2.
Fig. 2.. Impact of manipulating miR-29a on SREBP-1c and CAV1 mRNA expression and on cellular lipid droplet (LD) and triglyceride (TG) content in JFH-I-infected Huh-7 cells.
miR-29a mimics or antagomirs were transfected into oleic acid-treated JFH-1-infected Huh-7 cells. A) Efficient delivery of miR-29a mimics into Huh-7 cells was confirmed by measuring the amount of miRNA in mimicked cells. miR-29a mimic increased miR-29a expression by a mean of 1157.018-fold (p = 0.0035**, n = 4) and the antagomir decreased its expression by a mean of 0.9-fold (p = 0.0111*, n = 4) in comparison of transfected versus mock cells. B) Mimicking with miR-29a lead to up-regulation of SREBP-1c mRNA expression (1.369 ± 0.1292, p = 0.0276*, n = 9) with no significant change observed for antagonizing miR-29a expression (1.067 ± 0.1949, n = 9) compared to untransfected cells (1.043 ± 0.07413). C) miR-29a mimics induced the mRNA expression of CAV1 (1.606 ± 0.1704, p = 0.0337*, n = 9), while antagomirs did not significantly alter CAV1 mRNA expression (1.406 ± 0.1134, n = 9) compared to untransfected cells (1.081 ± 0.1350). D) Mimicking of miR-29a resulted in increased amount of LDs, as shown by increase in the red coloration due to the oil red O staining, while miR-29a antagomir showed a slight decrease in the amount of LDs compared to untransfected cells, n = 3. Scale bars of 10 μm are shown on the images. E) Mimicking of miR-29a also significantly increased the concentration of TGs (114.8 ± 2.578, p = 0.0038**, n = 6) and antagonizing miR-29a significantly decreased TG concentration (80.73 ± 4.382, p = 0.0125*, n = 2) compared to untransfected cells (99.87 ± 2.352). All results are expressed as a mean ± SEM. Student’s t-test was used for the statistical analysis.
Fig. 3.
Fig. 3.. Impact of SREBP-1c siRNA on lipid droplet (LD) formation and CAV1 expression.
A) SREBP siRNA were efficiently transfected into oleic acid-treated JFH-1-infected (p < 0.0001***, n = 9). B) A significant decrease in the intracellular level of LDs, as shown by decrease in the amount of the red-colored LDs due to the oil red O staining (n = 3) compared to mock untransfected controls. C) SREBP siRNA transfection led to significant up-regulation of CAV1 (p = 0.0030**, n = 9). Results are expressed as mean ± SEM. Student’s t-test was used for the statistical analysis.
Fig. 4.
Fig. 4.. Impact of manipulating miR-29a on viral load.
Mimicking of miR-29a in JFH-I-infected Huh-7 cells resulted in 53% reduction (153380 ± 8850, p = 0.0499*, n = 4) in viral titers compared to untransfected Huh-7 cells (289005 ± 30205). Results are expressed as mean ± SEM. Student’s t-test was used for the statistical analysis.

Similar articles

Cited by

References

    1. Asselah T, Rubbia-Brandt L, Marcellin P, Negro F. Steatosis in chronic hepatitis C: why does it really matter? Gut. 2006;55:123–130. doi: 10.1136/gut.2005.069757. - DOI - PMC - PubMed
    1. Thomopoulos KC, Arvaniti V, Tsamantas AC, Dimitropoulou D, Gogos CA, Siagris D, et al. Prevalence of liver steatosis in patients with chronic hepatitis B: a study of associated factors and of relationship with fibrosis. Eur J Gastroenterol Hepatol. 2006;18:233–237. - PubMed
    1. Mirandola S, Bowman D, Hussain MM, Alberti A. Hepatic steatosis in hepatitis C is a storage disease due to HCV interaction with microsomal triglyceride transfer protein (MTP) Nutr Metab (Lond) 2010;7:13. doi: 10.1186/1743-7075-7-13. - DOI - PMC - PubMed
    1. Singaravelu R, Chen R, Lyn RK, Jones DM, O’Hara S, Rouleau Y, et al. Hepatitis C virus induced up-regulation of microRNA-27: a novel mechanism for hepatic steatosis. Hepatology. 2014;59:98–108. doi: 10.1002/hep.26634. - DOI - PubMed
    1. Afzal MS, Zaidi NU, Dubuisson J, Rouille Y. Hepatitis C virus capsid protein and intracellular lipids interplay and its association with hepatic steatosis. Hepat Mon. 2014;14:e17812. doi: 10.5812/hepatmon.17812. - DOI - PMC - PubMed