. 2017 Jan 12;2(1):e89761.
doi: 10.1172/jci.insight.89761.

Lung vaso-occlusion in sickle cell disease mediated by arteriolar neutrophil-platelet microemboli

Affiliations

Lung vaso-occlusion in sickle cell disease mediated by arteriolar neutrophil-platelet microemboli

Margaret F Bennewitz et al. JCI Insight. .

Abstract

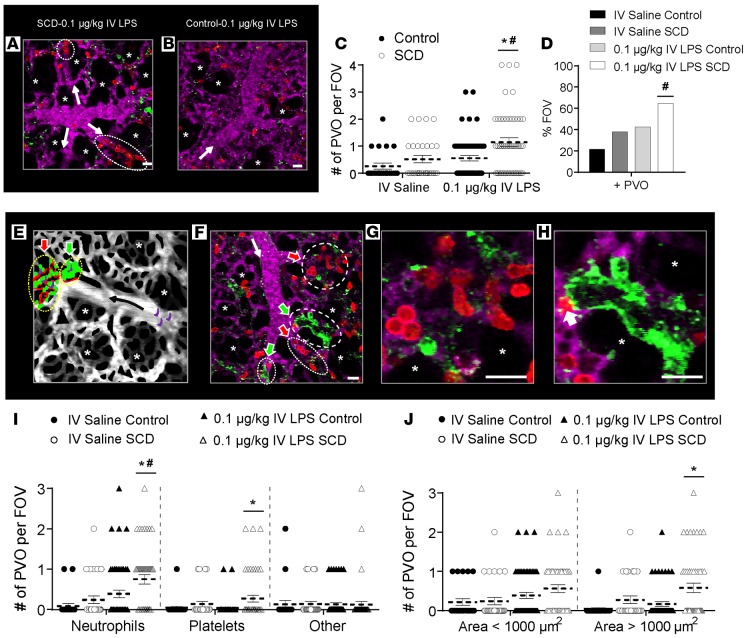
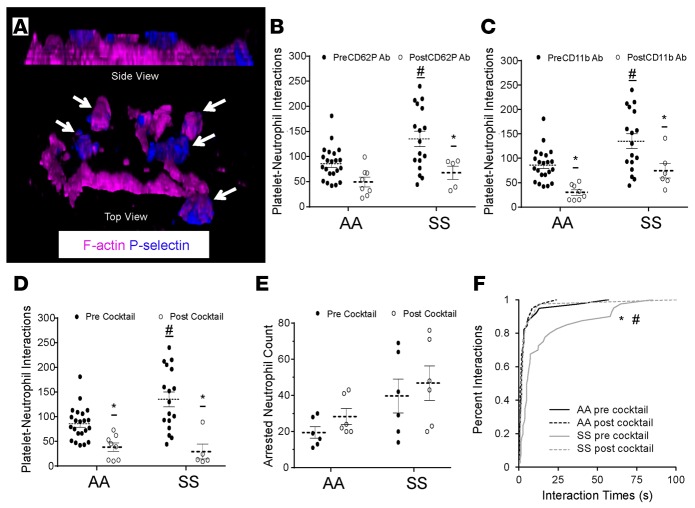
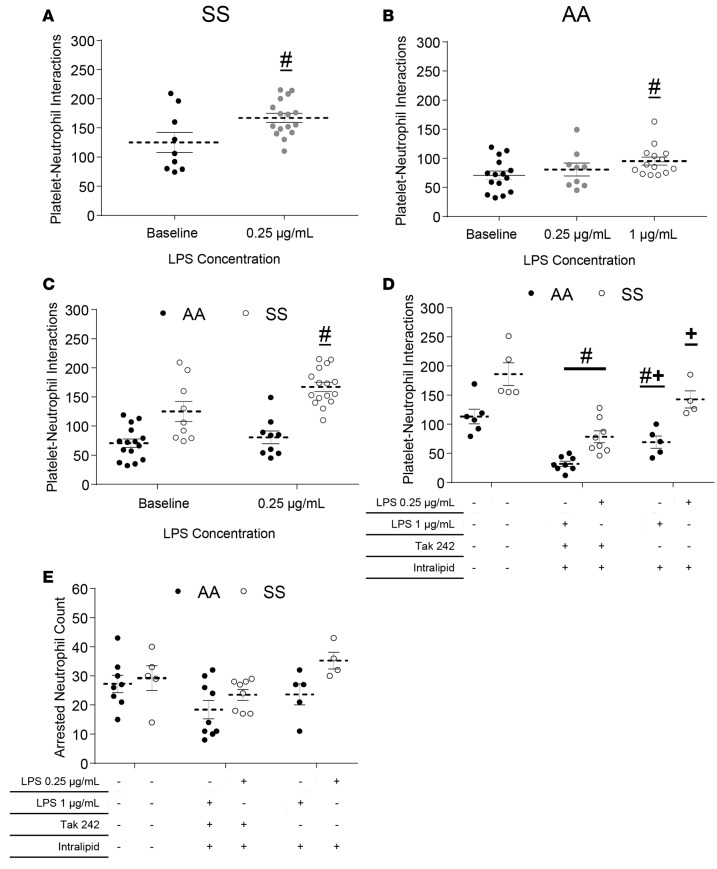
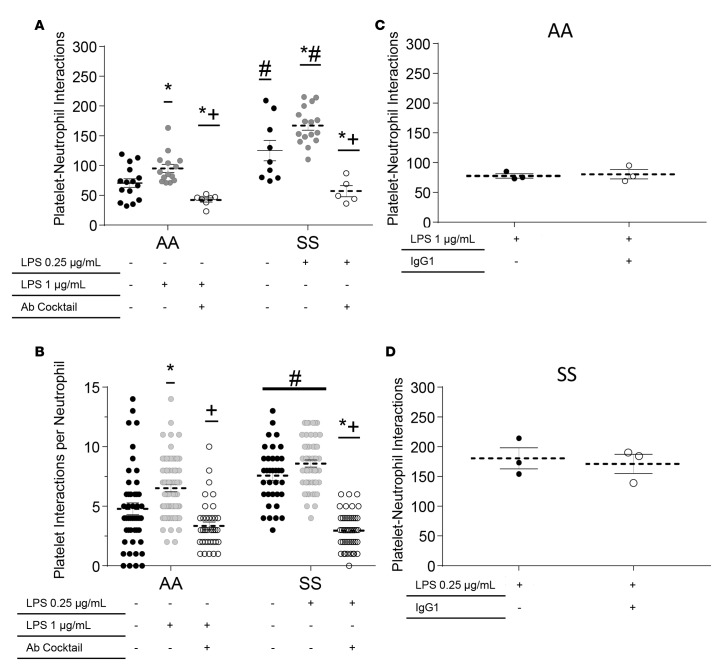
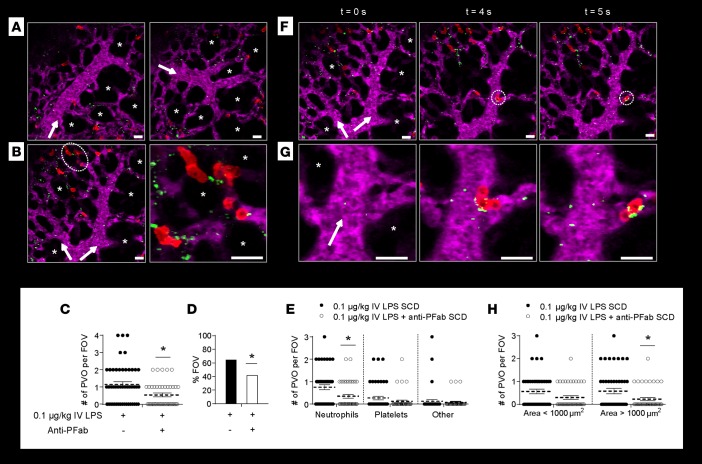
In patients with sickle cell disease (SCD), the polymerization of intraerythrocytic hemoglobin S promotes downstream vaso-occlusive events in the microvasculature. While vaso-occlusion is known to occur in the lung, often in the context of systemic vaso-occlusive crisis and the acute chest syndrome, the pathophysiological mechanisms that incite lung injury are unknown. We used intravital microscopy of the lung in transgenic humanized SCD mice to monitor acute vaso-occlusive events following an acute dose of systemic lipopolysaccharide sufficient to trigger events in SCD but not control mice. We observed cellular microembolism of precapillary pulmonary arteriolar bottlenecks by neutrophil-platelet aggregates. Blood from SCD patients was next studied under flow in an in vitro microfluidic system. Similar to the pulmonary circulation, circulating platelets nucleated around arrested neutrophils, translating to a greater number and duration of neutrophil-platelet interactions compared with normal human blood. Inhibition of platelet P-selectin with function-blocking antibody attenuated the neutrophil-platelet interactions in SCD patient blood in vitro and resolved pulmonary arteriole microembolism in SCD mice in vivo. These results establish the relevance of neutrophil-platelet aggregate formation in lung arterioles in promoting lung vaso-occlusion in SCD and highlight the therapeutic potential of targeting platelet adhesion molecules to prevent acute chest syndrome.


Conflict of interest statement

The authors have declared that no conflict of interest exists.

Figures

Figure 1
Figure 1. 0.1 μg/kg IV LPS triggers pulmonary vaso-occlusion in SCD mice.
Control and sickle cell disease (SCD) mice were injected intravenously (IV) with saline (n = 3 mice per group; control: 23 fields of view [FOVs]; SCD: 29 FOVs) or 0.1 μg/kg LPS (n = 5 mice per group; control: 54 FOVs; SCD: 48 FOVs). Arterioles were imaged 2–2.5 hours after IV saline or 0.1 μg/kg IV LPS using qFILM. (A and B) qFILM images showing 2 pulmonary vaso-occlusions (dotted ellipses) in SCD mice (A) and an absence of pulmonary vaso-occlusions in control mice (B) administered 0.1 μg/kg IV LPS. Supplemental Video 3 shows the FOV in A. Pulmonary arteriolar vaso-occlusions were quantified as described in Supplemental Methods. (C) Number of pulmonary vaso-occlusions (PVO) per FOV for control (black circles) and SCD mice (white circles) administered IV saline or IV LPS. Size of FOV: ~67,600 μm2. (D) Percent FOVs with pulmonary vaso-occlusions in SCD and control mice administered IV saline or IV LPS. (E) Conceptual schematic of pulmonary vaso-occlusions. Large neutrophil-platelet aggregates (yellow dotted ellipses) block arteriolar bottlenecks. Neutrophil vaso-occlusion (red arrow): few platelets (green) adhered to a neutrophil macro-aggregate (red). Platelet vaso-occlusion (green arrow): few neutrophils embedded inside a platelet macro-aggregate. Erythrocytes (purple) are trapped within neutrophil-platelet aggregates. Black arrow denotes direction of blood flow. Asterisks denote alveoli. (F) qFILM image of a SCD mouse challenged with 0.1 μg/kg IV LPS. All 4 arteriolar bottlenecks are blocked by neutrophil (red arrows) or platelet (green arrows) vaso-occlusions. (G) Neutrophil vaso-occlusion (magnified from F) showing mostly neutrophils (red) bound to few platelets (green). (H) Platelet vaso-occlusion (magnified from F) showing mostly platelets bound to one neutrophil (white arrow). Pulmonary microcirculation is shown in purple. White arrows in A, B, and F denote direction of blood flow. Diameter of arteriole shown in F is ~28 μm. Scale bars: 20 μm. Supplemental Video 7 shows the FOV in F. (I) Number of pulmonary vaso-occlusions per FOV classified by cellular composition. (J) Number of pulmonary vaso-occlusions per FOV with area <1,000 μm2 or >1,000 μm2. Average number of pulmonary vaso-occlusions per FOV, cellular composition of pulmonary vaso-occlusions, and area of pulmonary vaso-occlusions were compared using t tests with Bonferroni correction. Percent of FOVs with pulmonary vaso-occlusions were compared using 4-fold table analyses with Bonferroni χ2 statistics. Data represent mean ± SEM. *P < 0.05 for control vs. SCD and #P < 0.05 for IV saline vs. 0.1 μg/kg IV LPS.
Figure 2
Figure 2. Microembolic or in situ nucleated neutrophil-platelet aggregates occlude the arteriolar bottlenecks.
Sickle cell disease (SCD) mice were injected intravenously (IV) with 0.1 μg/kg of LPS, and arterioles were imaged using quantitative fluorescence intravital lung microscopy (qFILM) to evaluate the formation of pulmonary vaso-occlusion within arteriolar bottlenecks. (A) qFILM images of the same field of view (FOV) at 3 different time points in a SCD mouse administered 0.1 μg/kg IV LPS showing pulmonary vaso-occlusion enabled by a microembolic large neutrophil-platelet aggregate. t = 0 s shows the arteriole before the microembolus appears in the FOV. At t = 1.5 seconds, a microembolus comprising several neutrophils attached to a few platelets appears (white dotted circle) and begins to travel down the arteriole. The microembolus gets trapped in the “arteriolar bottleneck,” resulting in a pulmonary vaso-occlusion by t = 16.2 seconds. (B) qFILM images of the same FOV at 3 different time points in a SCD mouse administered 0.1 μg/kg IV LPS showing the formation of a pulmonary vaso-occlusion via an in situ nucleation of a large neutrophil-platelet aggregate. At t = 0 seconds, an aggregate comprising 3 neutrophils attached to a few platelets (dotted white circle) is partially occluding an arteriolar bottleneck. A neutrophil (thick white arrow) begins to travel down the arteriole at t = 0 seconds and nucleates on top of the existing neutrophil-platelet aggregate by t = 2.2 seconds. Another neutrophil (thick white arrow) appears in the FOV at t = 2.2 seconds and flows down the arteriole to nucleate on top of the existing neutrophil-platelet aggregate (t = 4.4 seconds), resulting in the formation of a large aggregate composed of 5 neutrophils and a few platelets (dotted white circle) that completely occludes the arteriolar bottleneck. The times displayed are relative to the selected frames. Neutrophils are shown in red, platelets in green, pulmonary microcirculation in purple. Asterisks denote alveoli. Thin white arrows mark the direction of blood flow within the feeding arterioles. The diameters of the arterioles shown in A and B are 26 μm and 30 μm, respectively. Scale bars: 20 μm. See Supplemental Videos 11 and 14 for the complete qFILM time series corresponding to A and B.
Figure 3
Figure 3. Neutrophil-platelet aggregation is higher in steady state sickle cell disease (SCD) human blood.
African American control (AA) and steady-state SCD (SS) human whole blood was perfused through micro-channels presenting P-selectin, ICAM-1, and IL-8, and interactions of platelets with arrested neutrophils were monitored using quantitative microfluidic fluorescence microscopy (qMFM). (A and B) qMFM images of the same field of view (FOV) at 2 different time points (0 and 120 seconds) showing freely flowing platelets interacting with arrested neutrophils in control (A) and SCD (B) blood. Schematic above each column shows the qMFM step (1 or 2) used to acquire the images in that column. Step 1 of qMFM was used to visualize the footprints of arresting neutrophils (purple) at t = 0 seconds, and step 2 was used to visualize nucleation of freely flowing platelets (green) on top of arrested neutrophils (purple) at t = 120 seconds. The complete time series is shown in Supplemental Videos 17 and 18, respectively. White arrows denote the direction of blood flow. (C) Pseudocolored scanning electron micrograph showing platelets (green) nucleated on top of arrested neutrophils (purple) in SCD blood. Erythrocytes (red) are sequestered within the neutrophil-platelet aggregates. Arrow denotes the direction of flow. Scale bars: 20 μm. (D) Platelet interactions with arrested neutrophils shown as total interactions per minute in a FOV. (E) Total number of neutrophils arresting per minute in a FOV. (F) Platelet interactions with arrested neutrophils shown as the number of platelet interaction events per arrested neutrophil over a 2-minute observation period in a FOV. (G) Lifetime of platelet-neutrophil interactions shown as a cumulative probability distribution. The median lifetime was 2 seconds (control) and 14 seconds (SCD). AE are representative of 6 experiments with 3 control and 3 SCD patients. F and G are representative of 8 experiments with 4 control and 4 SCD patients. Data in DF represent mean ± SEM; means were compared using Student’s t test. Distributions in G were compared using the nonparametric Kruskal-Wallis H test. Each data point in D and E represents a single FOV. Observations were made using multiple FOVs in individual experiments. Each data point in F represents a single neutrophil. #P < 0.05 when comparing control with SCD. Wall shear stress 6 dyn/cm2.FOV: ~14,520 μm2. See Supplemental Methods for details.
Figure 4
Figure 4. Neutrophil-platelet aggregation in sickle cell disease (SCD) human blood is platelet P-selectin dependent.
African American control (AA) and steady-state SCD (SS) human whole blood with or without addition of function blocking mAbs against P-selectin and/or Mac-1 was perfused through micro-channels presenting P-selectin, ICAM-1, and IL-8, and interactions of platelets with arrested neutrophils were monitored using quantitative microfluidic fluorescence microscopy (qMFM). (A) Structured illumination micrograph of platelets nucleated on an arrested neutrophil in SCD blood. F-actin (purple) can be seen throughout the outer ring (lamellipodium) of the arrested neutrophil and within the nucleating platelets. CD62P (blue) is expressed primarily on the platelets. Platelets are marked with white arrows. See also Supplemental Video 19. (B) Effect of platelet P-selectin inhibition on total platelet interactions with arrested neutrophils. (C) Effect of Mac-1 inhibition on total platelet interactions with arrested neutrophils. (D and E) Effect of simultaneous inhibition of platelet P-selectin and neutrophil Mac-1 on (D) total platelet interactions with arrested neutrophils and (E) total number of arrested neutrophils. (F) Effect of simultaneous inhibition of P-selectin and Mac-1 on the lifetime of platelet-neutrophil interactions. The median lifetime was ~1.8 seconds (control before Ab cocktail treatment [AA pre cocktail], control after cocktail [AA post cocktail], and SCD after cocktail [SS post cocktail]) vs. 5 seconds (SCD before cocktail [SS pre cocktail]). The data for AA pre and SS pre shown in F are not the same as the data in Figure 3G; the 2 sets of data were generated using a separate set of experiments. Wall shear stress: 6 dyn/cm2. FOV: ~14,520 μm2. BD representative of 10 experiments with 4 control and 5 SCD patients; E and F representative of 6 experiments with 3 control and 3 SCD patients. Data represent mean ± SEM. Means in BE were compared using Student’s t test with Bonferroni correction. Interaction times in F were compared using the nonparametric Kruskal-Wallis H test. Each data point in BE (black circles, pre-Ab treatment; white circles, post-Ab treatment) represents a single field of view (FOV), and observations were made using multiple FOVs in individual experiments. #P < 0.05 when comparing control with SCD; *P < 0.05 when comparing pre- and post-Ab treatment. Wall shear stress: 6 dyn/cm2. FOV: ~14,520 μm2.
Figure 5
Figure 5. LPS promotes neutrophil-platelet aggregation in sickle cell disease (SCD) human blood.
African American control (AA) or steady-state SCD (SS) human whole blood with or without LPS pretreatment was perfused through micro-channels presenting P-selectin, ICAM-1, and IL-8; and neutrophil-platelet interactions were monitored using quantitative microfluidic fluorescence microscopy (qMFM) over a 2-minute period. (A) Total platelet interactions with arrested neutrophils in SCD (steady state) whole blood with or without pretreatment with 0.25 μg/ml of LPS. Representative of 6 experiments with 6 SCD subjects. (B) Total platelet interactions with arrested neutrophils in control human blood with or without pretreatment with 0.25 or 1 μg/ml LPS. Representative of 6 experiments with 5 control subjects. (C) Comparison of total platelet-neutrophil interactions following pretreatment of control and SCD blood with 0.25 μg/ml LPS. Representative of 8 experiments with 3 control and 5 SCD subjects. (D and E) Effect of TAK-242 and/or intralipid (vehicle) pretreatment on (D) the total number of platelet interactions with arrested neutrophils and (E) total number of arrested neutrophils over a 2-minute observation period in 0.25 or 1 μg/ml LPS–treated SCD or control human blood, respectively. TAK-242 was added to the blood (50 μg/ml) and incubated for 5 minutes. After 5 minutes, LPS was added to the blood and incubated for 10 minutes before perfusion through the micro-channels. Representative of 6 experiments with 3 control and 3 SCD subjects. Data represent mean ± SEM. #P < 0.05 when comparing with baseline; +P < 0.05 when comparing with TAK-242. Means were compared using Student’s t test with Bonferroni correction. Each data point represents a single field of view (FOV), and observations were made over multiple FOVs in some experiments. See Supplemental Methods for details. Wall shear stress: 6 dyn/cm2. FOV: ~14,520 μm2.
Figure 6
Figure 6. LPS-induced neutrophil-platelet aggregation is P-selectin and Mac-1 dependent.
African American control (AA) or steady -state sickle cell disease (SS) human whole blood with or without LPS pretreatment and with or without addition of a cocktail of P-selectin and Mac-1 function-blocking mAbs was perfused through micro-channels presenting P-selectin, ICAM-1, and IL-8; and neutrophil-platelet interactions were monitored in a field of view (FOV) using quantitative microfluidic fluorescence microscopy (qMFM) over a 2-minute period. LPS was added to the blood and incubated at room temperature for 10 minutes before perfusion through the micro-channels. Flow was stopped after 2 minutes of perfusion, and function-blocking antibodies were added to the blood. Flow was resumed, and observations were made for another 2 minutes. (A and B) Effect of simultaneous inhibition of platelet P-selectin and neutrophil Mac-1 on (A) total platelet interactions with arrested neutrophils and (B) number of platelet interaction events per arrested neutrophil in control or SCD human blood with or without pretreatment with LPS (0.25 or 1 μg/ml). *P < 0.05 when compared with baseline; #P < 0.05 when comparing control with SCD; +P < 0.05 when comparing LPS with Ab treatment. Representative of 8 experiments with 4 control and 4 SCD subjects. (C and D) No effect of isotype IgG1 control Ab treatment on the total number of platelet interactions with arrested neutrophils in (C) 1 μg/ml LPS–treated control and (D) 0.25 μg/ml LPS–treated SCD human blood. Representative of 5 experiments done with 2 control and 3 SCD subjects. Data represent mean ± SEM. Means were compared using Student’s t test with Bonferroni correction for multiple comparisons. Each data point represents a single field of view (FOV), and observations were made over multiple FOVs in individual experiments. See Supplemental Methods for details. Wall shear stress: 6 dyn/cm2. FOV: ~14,520 μm2.
Figure 7
Figure 7. P-selectin blockade ameliorates LPS-induced pulmonary arteriole microembolism in SCD mice.
Sickle cell disease (SCD) mice were injected intravenously (IV) with 0.1 μg/kg LPS (n = 5 mice; 48 fields of view [FOVs]) or 0.1 μg/kg IV LPS + anti–P-selectin mAb Fab fragments (n = 3 mice; 43 FOVs). Arterioles were imaged 2–2.5 hours after IV LPS or IV LPS + anti–P-selectin Fab fragments using quantitative fluorescence intravital lung microscopy (qFILM). (A and B) qFILM images of 3 FOVs from a SCD mouse administered IV LPS + anti–P-selectin Fab fragments. (A) A majority (58%) of FOVs show no pulmonary vaso-occlusions. Supplemental Video 20 shows the FOV in A (right panel). (B) Anti–P-selectin Fab fragments attenuated LPS-induced arteriolar pulmonary vaso-occlusions. A small aggregate of neutrophils (red) and platelets (green) blocks the arteriolar bottleneck (white dotted circle). Magnified view of vaso-occlusion is shown to the right. Pulmonary microcirculation is shown in purple. Asterisks denote alveoli. White arrows mark the direction of blood flow. Average diameter of arterioles in A and B: 30 ± 2 μm. Scale bars: 20 μm. (CH) Data from SCD mice administered 0.1 μg/kg IV LPS are repeated from Figure 1. (C) Number of pulmonary vaso-occlusions (PVO) per FOV for SCD mice administered IV LPS (black circles) or IV LPS + anti–P-selectin Fab fragments (white circles). Size of FOV: ~67,600 μm2. (D) Percent FOVs with pulmonary vaso-occlusions. (E) Number of pulmonary vaso-occlusions per FOV classified by cellular composition. (F) qFILM images of one FOV at 3 different time points in a SCD mouse administered IV LPS + anti–P-selectin Fab fragments. A neutrophil-platelet aggregate (white dotted circles) arrives and disintegrates within a pulmonary arteriole. (G) Magnified view of neutrophil-platelet aggregate in F. t = 0 s shows the arteriole before the aggregate arrives. At t = 4 seconds, the neutrophil-platelet aggregate appears and quickly enters the arteriolar bottleneck. By t = 5 seconds, one neutrophil has detached and traversed farther into the capillary. Diameter of arteriole in F and G: 28 μm. Scale bars: 20 μm. Supplemental Video 21 shows the FOV in G. (H) Number of pulmonary vaso-occlusions per FOV with area <1,000 μm2 or >1,000 μm2. Average number of pulmonary vaso-occlusions per FOV, area of pulmonary vaso-occlusions, and cellular composition of pulmonary vaso-occlusions were compared using unpaired t tests. Percent FOVs with pulmonary vaso-occlusions were compared using 4-fold table analyses with Bonferroni χ2 statistics. Data represent mean ± SEM. *P < 0.05 for 0.1 μg/kg IV LPS SCD vs. 0.1 μg/kg IV LPS + anti-PFab SCD.

References

    1. Manwani D, Frenette PS. Vaso-occlusion in sickle cell disease: pathophysiology and novel targeted therapies. Blood. 2013;122(24):3892–3898. doi: 10.1182/blood-2013-05-498311. - DOI - PMC - PubMed
    1. GBD 2013 Mortality Causes of Death Collaborators Global, regional, and national age-sex specific all-cause and cause-specific mortality for 240 causes of death, 1990-2013: a systematic analysis for the Global Burden of Disease Study 2013. Lancet. 2015;385(9963):117–171. doi: 10.1016/S0140-6736(14)61682-2. - DOI - PMC - PubMed
    1. Rees DC, Williams TN, Gladwin MT. Sickle-cell disease. Lancet. 2010;376(9757):2018–2031. doi: 10.1016/S0140-6736(10)61029-X. - DOI - PubMed
    1. Gladwin MT, Ofori-Acquah SF. Erythroid DAMPs drive inflammation in SCD. Blood. 2014;123(24):3689–3690. doi: 10.1182/blood-2014-03-563874. - DOI - PMC - PubMed
    1. Miller AC, Gladwin MT. Pulmonary complications of sickle cell disease. Am J Respir Crit Care Med. 2012;185(11):1154–1165. doi: 10.1164/rccm.201111-2082CI. - DOI - PMC - PubMed

Publication types

MeSH terms