. 2017 Jan 18:7:40726.
doi: 10.1038/srep40726.

Lithium Accumulates in Neurogenic Brain Regions as Revealed by High Resolution Ion Imaging

Affiliations

Lithium Accumulates in Neurogenic Brain Regions as Revealed by High Resolution Ion Imaging

Giulia Zanni et al. Sci Rep. .

Abstract

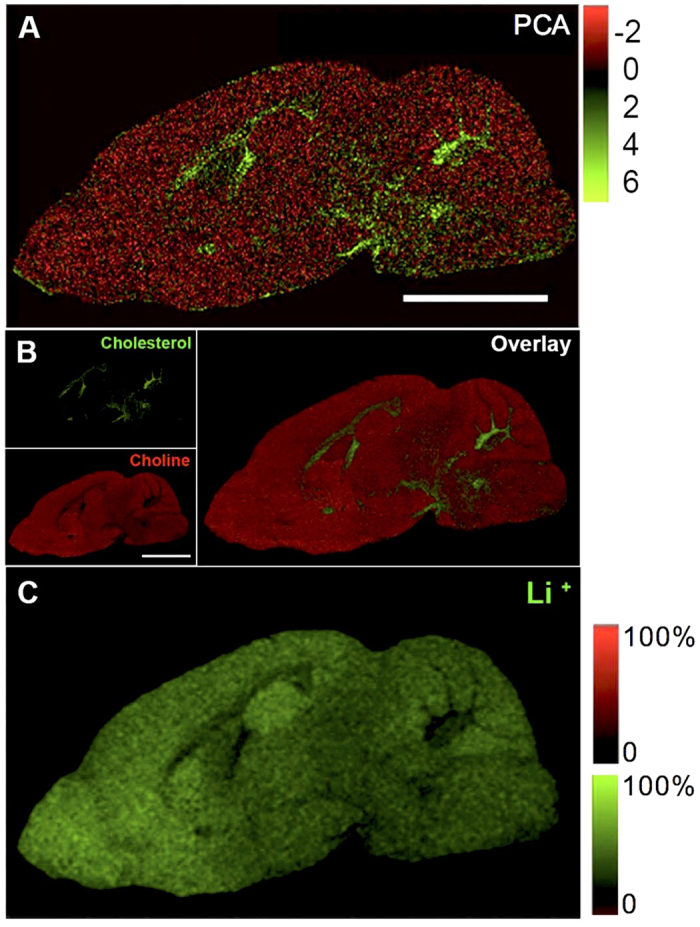
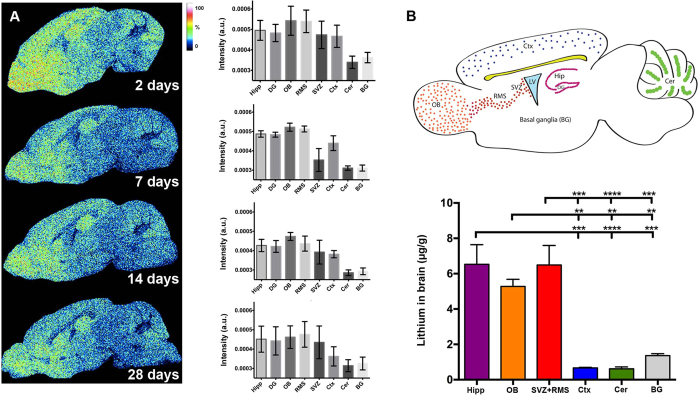
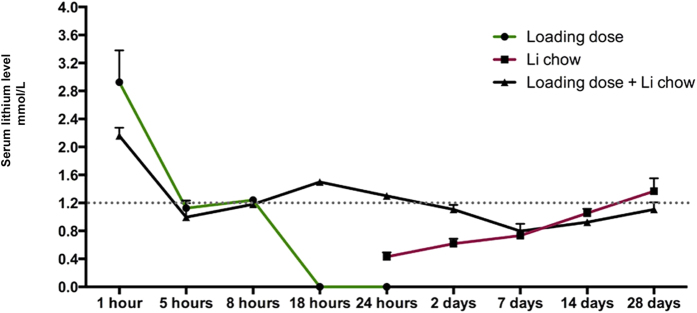
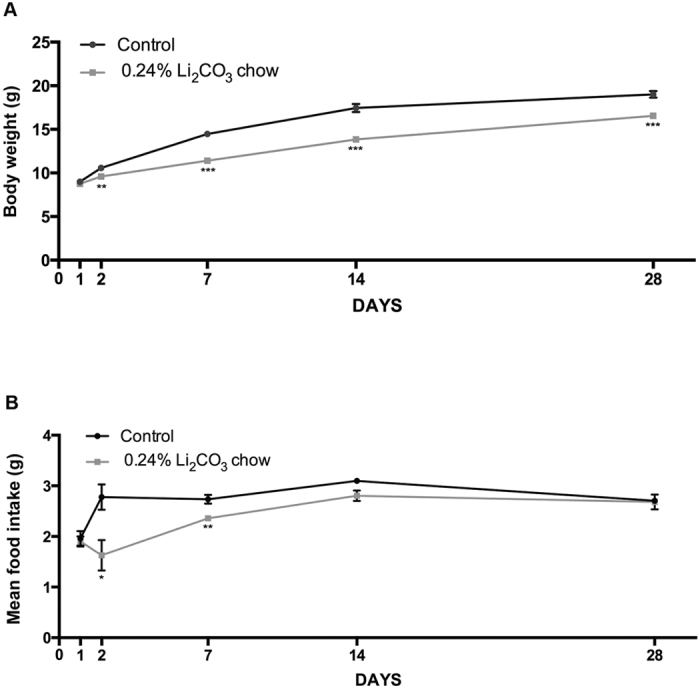
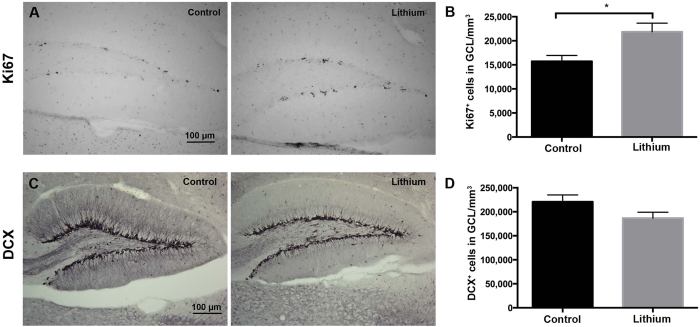
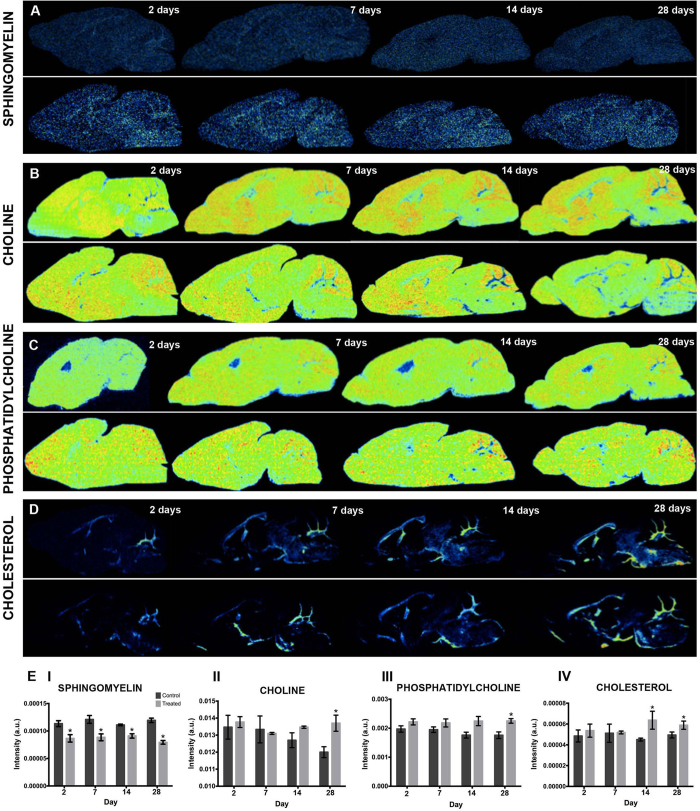
Lithium (Li) is a potent mood stabilizer and displays neuroprotective and neurogenic properties. Despite extensive investigations, the mechanisms of action have not been fully elucidated, especially in the juvenile, developing brain. Here we characterized lithium distribution in the juvenile mouse brain during 28 days of continuous treatment that result in clinically relevant serum concentrations. By using Time-of-Flight Secondary Ion Mass Spectrometry- (ToF-SIMS) based imaging we were able to delineate temporospatial lithium profile throughout the brain and concurrent distribution of endogenous lipids with high chemical specificity and spatial resolution. We found that Li accumulated in neurogenic regions and investigated the effects on hippocampal neurogenesis. Lithium increased proliferation, as judged by Ki67-immunoreactivity, but did not alter the number of doublecortin-positive neuroblasts at the end of the treatment period. Moreover, ToF-SIMS revealed a steady depletion of sphingomyelin in white matter regions during 28d Li-treatment, particularly in the olfactory bulb. In contrast, cortical levels of cholesterol and choline increased over time in Li-treated mice. This is the first study describing ToF-SIMS imaging for probing the brain-wide accumulation of supplemented Li in situ. The findings demonstrate that this technique is a powerful approach for investigating the distribution and effects of neuroprotective agents in the brain.


Figures

Figure 1
Figure 1. Multivariate Image analysis identified anatomical regions of interest.
PCA and single ion images from one representative animal. (A) Score image for the first principal component obtained from PCA of the imaging data illustrating the major chemical differences of distinct anatomical regions. (B,C) From the corresponding loadings, the variables (m/z) that contribute the most to variance can be identified. These localize to different anatomical regions that can hence be delineated based on their chemical identity. These include, choline (B upper left), m/z = 104.1, [C5H14NO+], gray matter), cholesterol (B lower left), m/z = 369.33, [C27H45+], white matter) and the overlay (B on the right): choline (red) and cholesterol (green) and Li+ (C, m/z = 7). Scale bar = 2 cm.
Figure 2
Figure 2. Region-selective lithium uptake following continuous treatment.
(A) Single ion images from one representative animal per group for m/z 7 [Li+] at different time points. A characteristic decrease was observed in various anatomical regions at day 14 and 28 compared to day 2. This was particularly prominent in the cerebellum and cortex. (B) (Upper panel) Representative color-coded schematic image of a sagittal section of the mouse brain showing the ROIs identified by ToF-SIMS. Ctx = cortex, Cer = cerebellum, BG = basal ganglia, DG = dentate gyrus, Hip = hippocampus, LV = lateral ventricle, SVZ = subventricular zone, RMS = rostral migratory stream and OB = olfactory bulb. (Lower panel) ICP-AES quantification confirmed lithium-selective uptake in specific ROIs of the brain: SVZ+RMS, hippocampus and OB had significantly higher Li+ concentrations as compared to BG, cortex and cerebellum. ***p = 0.0001, ****p < 0.0001, pOBvsBG = 0.0085, pOBvscerebellum = 0.0015 and pOBvscortex = 0.0017.
Figure 3
Figure 3. Serum lithium distribution at different time points.
Measurements of the serum lithium levels at 1, 5, 8, 18 and 24 hours and 2, 7, 14, and 28 days after an initial loading dose of 4 mmol/kg LiCl and the onset of 0.24% Li2CO3 chow administration. After a single intraperitoneal injection the clearance of lithium serum levels is observed by 18 hours (green line), whereas with the chow the increase in serum lithium levels to therapeutically relevant concentrations did not occur until after 14 days (red line). In this study we combined a loading dose and the lithium chow (black line). In each time point n = 5.
Figure 4
Figure 4. Chronic lithium treatment decreased body weight gain and food intake.
(A) Graph showing the mean body weight in controls (black line) and in lithium-treated animals (gray line). Day 1 and 2 n = 18 control and n = 38 lithium, day 7 n = 18 control and n = 33 lithium, day 14 n = 12 control and n = 22 lithium, day 28 n = 12 control and n = 22 lithium. (B) Graph of the mean food intake per animal during lithium treatment. Significance was considered at p-values < 0.05. All data are presented as mean ± SEM.
Figure 5
Figure 5. Lithium boosted hippocampal NSPC proliferation but not neuronal differentiation.
(A) Ki67 immunoreactivity in the granule cell layer (GCL) of control and lithium-treated animals. In each group n = 6. (B) Bar graph showing the quantification of Ki67+ cells in the SGZ after 28 days of lithium treatment. Significance was considered at p-values < 0.05. (C) DCX immunoreactivity in the granule cell layer (GCL) of control and lithium-treated animals. (D) Bar graph showing the quantification of DCX+ cells in the GCL after 28 days from the onset of lithium treatment. In each group n = 6. Data are presented as mean ± SEM.
Figure 6
Figure 6. Lithium induced changes in region lipid levels.
(A) Single ion images from one representative animal per group for sphingomyelin (m/z 264.26, SM, [C17H30NO+]), (B) choline (m/z 104.11 [C5H14NO+]), (C) phosphatidylcholine (m/z 224.11, PC, [C8H19PNO4+]) and (D) cholesterol (m/z 369.33, [C27H45+]) at different time points for treatment (top) and control (bottom) groups. (E) The levels of the individual lipid signals in cerebellar cortex of treatment groups were compared to the controls. (E I) Sphingomyelin SM (m/z 264.26) was significantly decreased for all the days in the lithium treatment groups. Conversely, choline (m/z 104.11) (E II) and phosphatidylcholine PC (m/z 224.11) (E III) showed significantly higher cortical levels at day 28. Similarly cholesterol (m/z 369.33) (E IV) displayed a significant increase on day 14 and 28.
Figure 7
Figure 7. Vitamin E levels were transiently altered during lithium treatment.
(A) Single ion images for vitamin E (m/z 430.33, alpha tocopherol, [C29H50O+]) at different time points during the lithium treatment (top) and in the control (bottom) group. (B) The levels of vitamin E (m/z 430.33) were elevated at day 2 in the dentate gyrus (DG), but leveled out at the later time points.

References

    1. Sproule B. Lithium in bipolar disorder: can drug concentrations predict therapeutic effect? Clinical pharmacokinetics 41, 639–660, doi: 10.2165/00003088-200241090-00002 (2002). - DOI - PubMed
    1. Berridge M. J. & Irvine R. F. Inositol phosphates and cell signalling. Nature 341, 197–205, doi: 10.1038/341197a0 (1989). - DOI - PubMed
    1. King J. S. et al.. The mood stabiliser lithium suppresses PIP3 signalling in Dictyostelium and human cells. Disease models & mechanisms 2, 306–312, doi: 10.1242/dmm.001271 (2009). - DOI - PMC - PubMed
    1. Pardo R., Andreolotti A. G., Ramos B., Picatoste F. & Claro E. Opposed effects of lithium on the MEK-ERK pathway in neural cells: inhibition in astrocytes and stimulation in neurons by GSK3 independent mechanisms. Journal of neurochemistry 87, 417–426, doi: 10.1046/j.1471-4159.2003.02015.x (2003). - PubMed
    1. Manji H. K. & Lenox R. H. Long-term action of lithium: a role for transcriptional and posttranscriptional factors regulated by protein kinase C. Synapse 16, 11–28, doi: 10.1002/syn.890160103 (1994). - DOI - PubMed

Publication types

LinkOut - more resources