. 2017 Jan 18:7:40774.
doi: 10.1038/srep40774.

Epigenetic modifications at DMRs of placental genes are subjected to variations in normal gestation, pathological conditions and folate supplementation

Affiliations

Epigenetic modifications at DMRs of placental genes are subjected to variations in normal gestation, pathological conditions and folate supplementation

Beenish Rahat et al. Sci Rep. .

Abstract

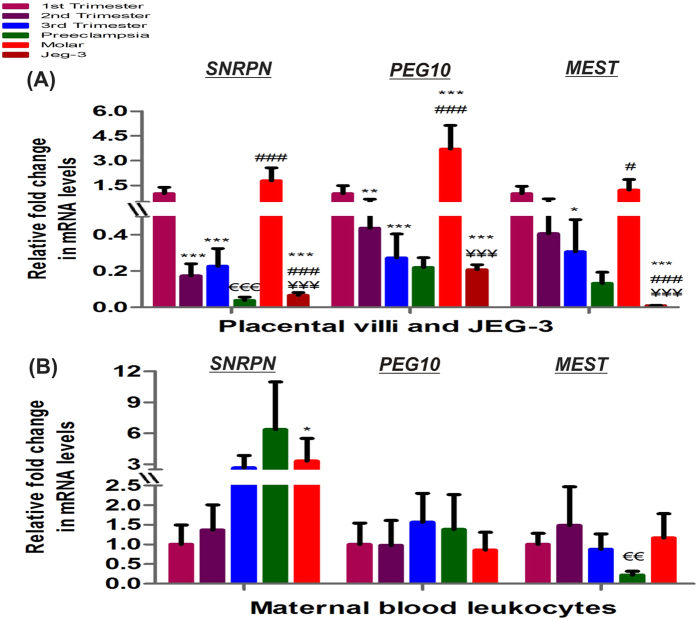
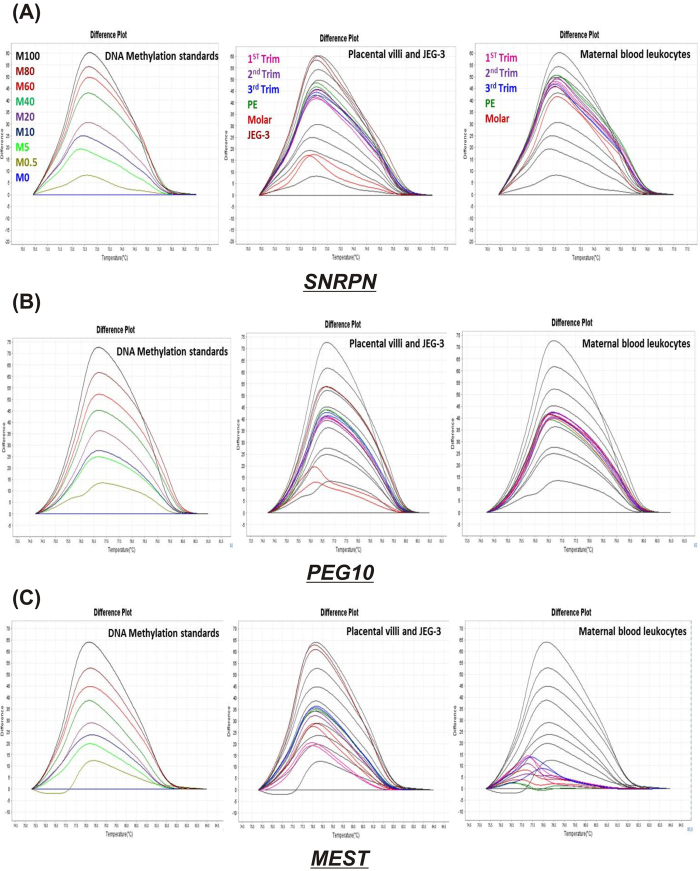
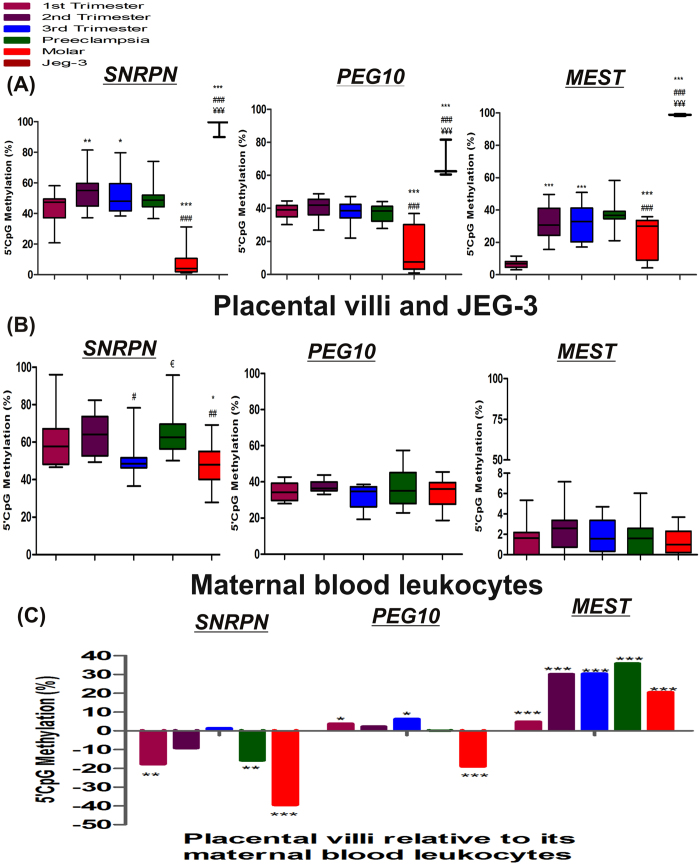
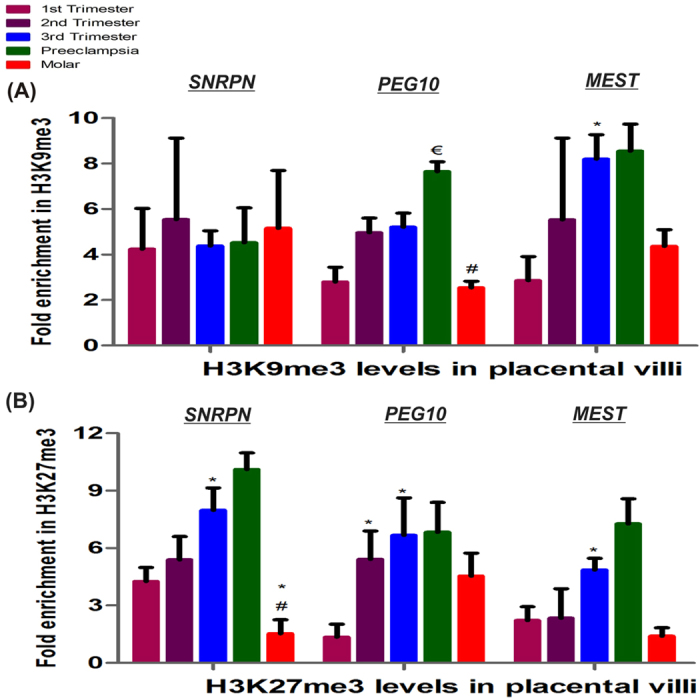
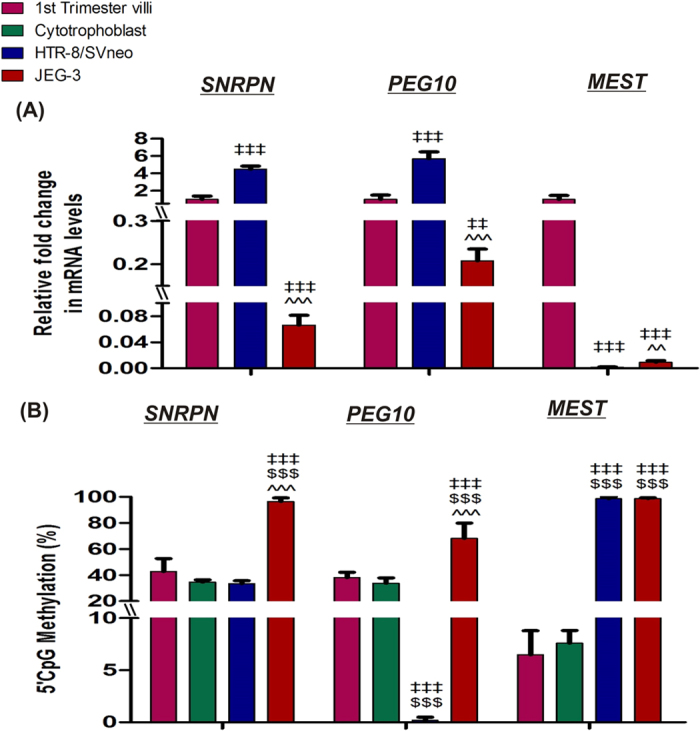
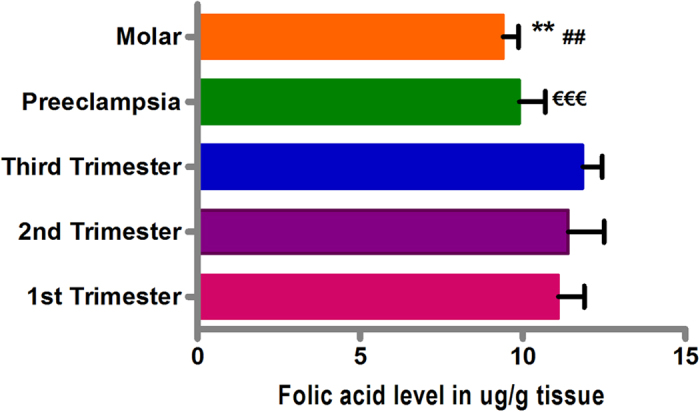
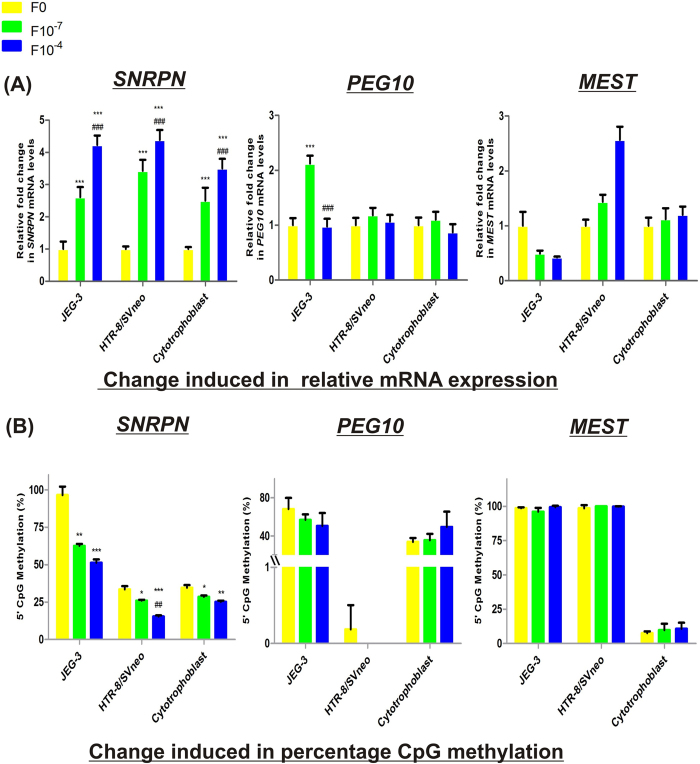
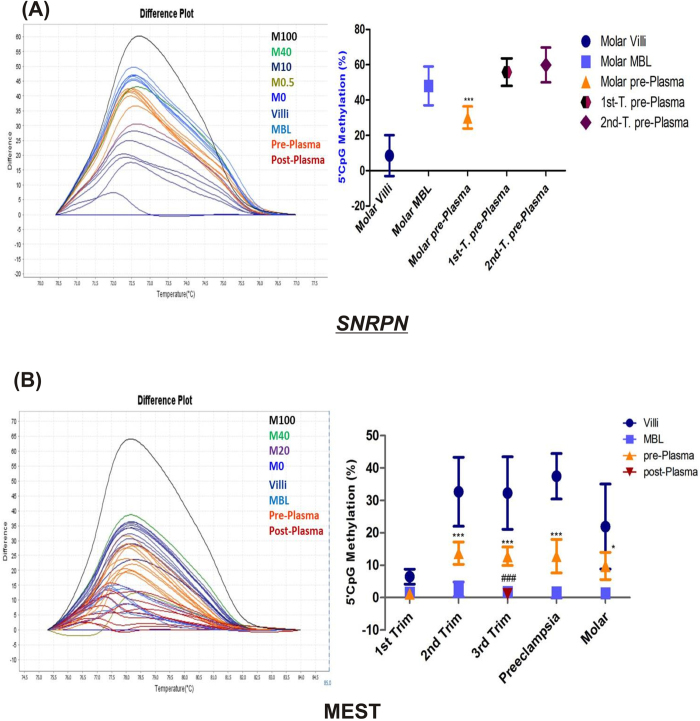
Invasive placentation and cancer development shares many similar molecular and epigenetic pathways. Paternally expressed, growth promoting genes (SNRPN, PEG10 and MEST) which are known to play crucial role in tumorogenesis, are not well studied during placentation. This study reports for the first time of the impact of gestational-age, pathological conditions and folic acid supplementation on dynamic nature of DNA and histone methylation present at their differentially methylated regions (DMRs). Here, we reported the association between low DNA methylation/H3K27me3 and higher expression of SNRPN, PEG10 and MEST in highly proliferating normal early gestational placenta. Molar and preeclamptic placental villi, exhibited aberrant changes in methylation levels at DMRs of these genes, leading to higher and lower expression of these genes, respectively, in reference to their respective control groups. Moreover, folate supplementation could induce gene specific changes in mRNA expression in placental cell lines. Further, MEST and SNRPN DMRs were observed to show the potential to act as novel fetal DNA markers in maternal plasma. Thus, variation in methylation levels at these DMRs regulate normal placentation and placental disorders. Additionally, the methylation at these DMRs might also be susceptible to folic acid supplementation and has the potential to be utilized in clinical diagnosis.


Figures

Figure 1
Figure 1. Relative fold change in mRNA of imprinting genes normalized with GAPDH.
Relative mRNA expression among (A) placental villous samples and JEG-3 cells (B) maternal blood leukocytes [*p < 0.05, **p < 0.01, ***p < 0.001 vs 1st trimester, #p < 0.05, ###p < 0.001 vs 2nd trimester, €€p < 0.01, €€€p < 0.001 vs 3rd trimester and ¥¥¥p < 0.001 vs molar]. The data is presented as mean of the observed fold change ± SEM, n = 30 per group.
Figure 2
Figure 2. DNA methylation at DMRs of imprinting genes as predicted by HRM software.
HRM difference plots for (A) SNRPN (B) PEG10 (C) MEST. Each representing three difference plots: first one for methylation standards in different colors (M100% - M0%, which stands for DNA methylation standards with 100 to 0% methylation) normalized to the 0%-methylated standard DNA, second and third difference plots for few selected samples from placental villous groups & JEG-3 cells and maternal leukocyte groups represented in different colors and methylated standard curve of M100 to 0% represented as black curves. Note: “Trim” stands for trimester.
Figure 3
Figure 3. DNA methylation at DMRs of imprinting genes.
(A) Box-and-whisker plot to show % CpG methylation among different placental villous samples and JEG-3 cells, (B) Box-and-whisker plot to show % CpG methylation among maternal blood leukocytes [*p < 0.05, **p < 0.01, ***p < 0.001 vs 1st trimester, #p < 0.05, ##p < 0.01, ###p < 0.001 vs 2nd trimester, p < 0.05 vs 3rd trimester and ¥¥¥p < 0.001 vs molar], and (C) % CpG methylation in villous samples in reference to their corresponding maternal blood leukocytes [*p < 0.05, **p < 0.01,***p < 0.001]. n = 30 per group.
Figure 4
Figure 4. Quantification of histone trimethylation at DMRs of imprinting genes among placental villous groups.
Fold enrichment relative to non-specific IgG acting as negative control and normalized with input DNA in (A) H3K9me3 and (B) H3K27me3. The data is presented as mean of the observed fold change ± SEM; n = 4 per group. *p < 0.05 vs 1st trimester, #p < 0.05 vs 2nd trimester, p < 0.05 vs 3rd trimester.
Figure 5
Figure 5. Regulation of differential mRNA expression via DNA methylation in placental cell lines, isolated cytotrophoblasts and normal first trimester placental villi.
(A) qRT-PCR analysis of candidate tumor suppressor genes. (B) MS-HRM analysis of candidate tumor suppressor genes. ‡‡p < 0.01, ‡‡‡p < 0.001 vs first trimester villi, $$$p < 0.001 vs isolated cytotrophoblasts and ^^p < 0.01, ^^^p < 0.001 vs HTR-8/SVneo. The data is presented as mean of observed percentage methylation ± SEM of three experiments for cell lines, isolated cytotrophoblasts and for 30 patients in first trimester placental villi group.
Figure 6
Figure 6. Relative Folic acid levels among different placental villi samples categories.
Folate levels in ug/g of villous tissue in normal 1st, 2nd and 3rd trimester, preeclampsia and molar villi samples. The data are expressed as mean value ± SEM. **p < 0.01, ##p < 0.01 w.r.t second trimester and €€€p < 0.001 w.r.t third trimester.
Figure 7
Figure 7. Effect of folic acid supplementation on imprinting gene regulation in placental cell lines and isolated cytotrophoblasts.
(A) Effect of folic acid supplementation on relative mRNA expression of imprinting genes. (B) Effect of folic acid supplementation on percentage CpG methylation at DMRs of imprinting genes. F0-without folic acid supplementation, F10−7 and F10−4 - folic acid supplementation at the concentration of 10−7 and 10−4 M respectively. The data is presented as mean ± SEM, of three experiments. *p < 0.05, **p < 0.01, ***p < 0.001 w.r.t the respective F0 control and ##p < 0.01, ###p < 0.001 w.r.t the respective F10−7 treated cells.
Figure 8
Figure 8. Evaluation of SNRPN and MEST as a fetal DNA epigenetic marker.
(A) SNRPN and (B) MEST, each figure represents a difference plot showing methylation standards in different colors (M100%–M0%, which stands for DNA methylation standards with 100 to 0% methylation) normalized to the 0%-methylated standard DNA and few representative samples of each group and a graphical representation of % CpG methylation detected within placental villous samples, maternal blood leukocytes (MBL), maternal plasma samples obtained pre- obstetric procedure (pre-Plasma) and post-delivery (post-Plasma, only in case of third trimester group) from each group. The data is presented as mean percentage methylation ± SEM, n = 30 per group. *p < 0.05, ***p < 0.001 w.r.t the respective maternal blood leukocytes and ###p < 0.001 w.r.t the pre-plasma.

Similar articles

Cited by

References

    1. Ferretti C., Bruni L., Dangles-Marie V., Pecking A. P. & Bellet D. Molecular circuits shared by placental and cancer cells, and their implications in the proliferative, invasive and migratory capacities of trophoblasts. Hum Reprod Update 13, 121–141, doi: dml048 10.1093/humupd/dml048, doi: 10.1038/srep02696(2013) J. Cell Biol (2007). - DOI - DOI - PubMed
    1. Soundararajan R. & Rao A. J. Trophoblast ‘pseudo-tumorigenesis’: significance and contributory factors. Reprod Biol Endocrinol 2, 15, doi: 10.1186/1477-7827-2-151477-7827-2-15 (2004). - DOI - PMC - PubMed
    1. D’Souza A. W. & Wagner G. P. Malignant cancer and invasive placentation: A case for positive pleiotropy between endometrial and malignancy phenotypes. Evol Med Public Health 2014, 136–145, doi: 10.1093/emph/eou022eou022 (2014). - DOI - PMC - PubMed
    1. Novakovic B. & Saffery R. Placental pseudo-malignancy from a DNA methylation perspective: unanswered questions and future directions. Front Genet. 4, 285, doi: 10.3389/fgene.2013.00285 (2013). - DOI - PMC - PubMed
    1. Moore T. & Haig D. Genomic imprinting in mammalian development: a parental tug-of-war. Trends Genet. 7, 45–49, doi: 10.1016/0168-9525(91)90230-N (1991). - DOI - PubMed

Publication types