. 2017 Feb 2;542(7639):119-123.
doi: 10.1038/nature21052. Epub 2017 Jan 18.

Genomic deletion of malic enzyme 2 confers collateral lethality in pancreatic cancer

Affiliations

Genomic deletion of malic enzyme 2 confers collateral lethality in pancreatic cancer

Prasenjit Dey et al. Nature. .

Abstract

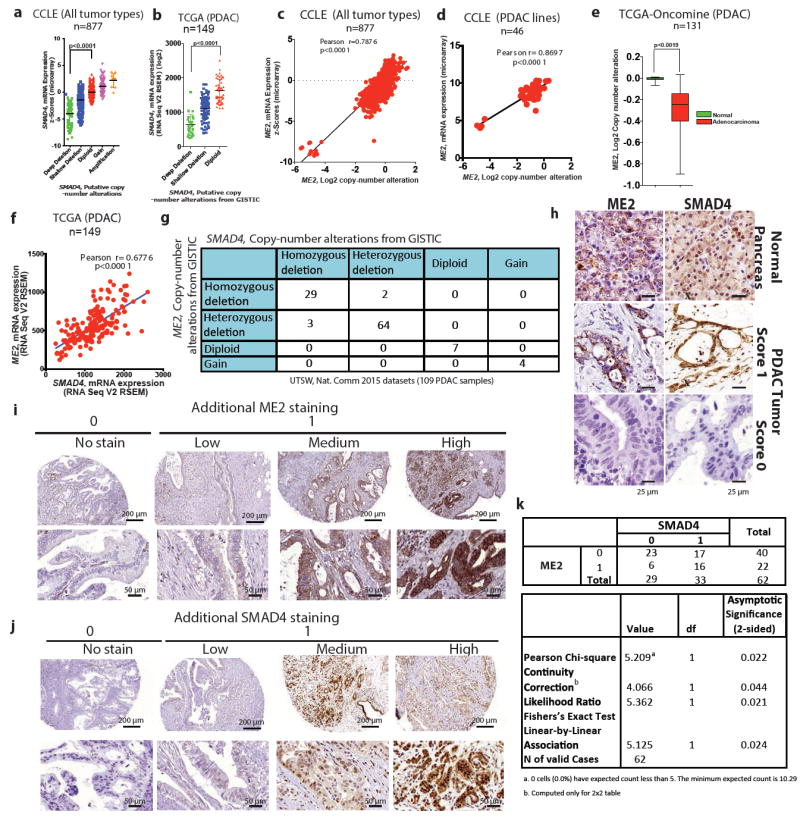
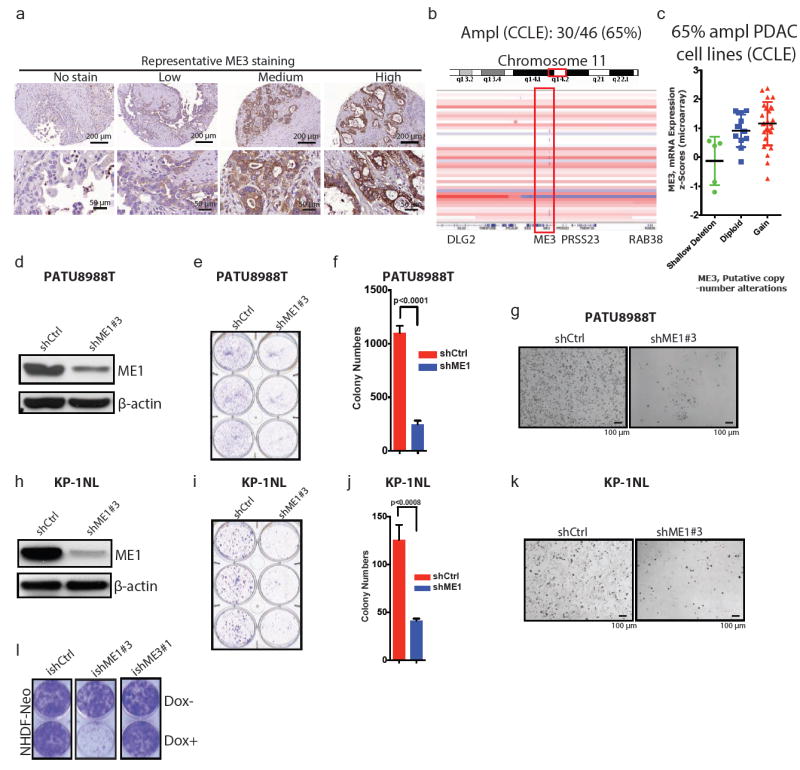
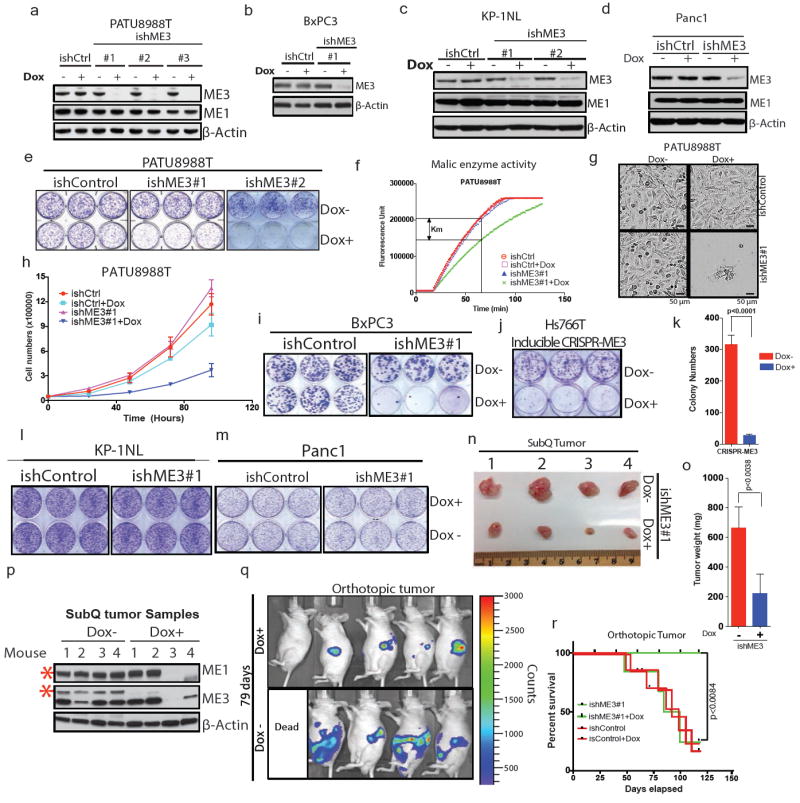
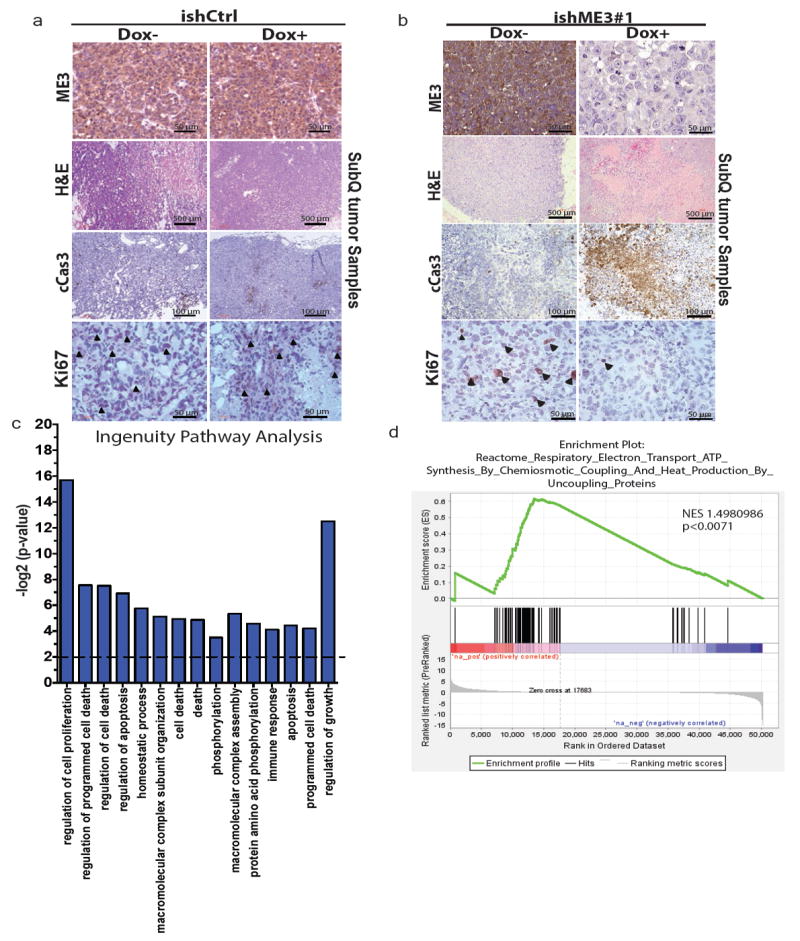
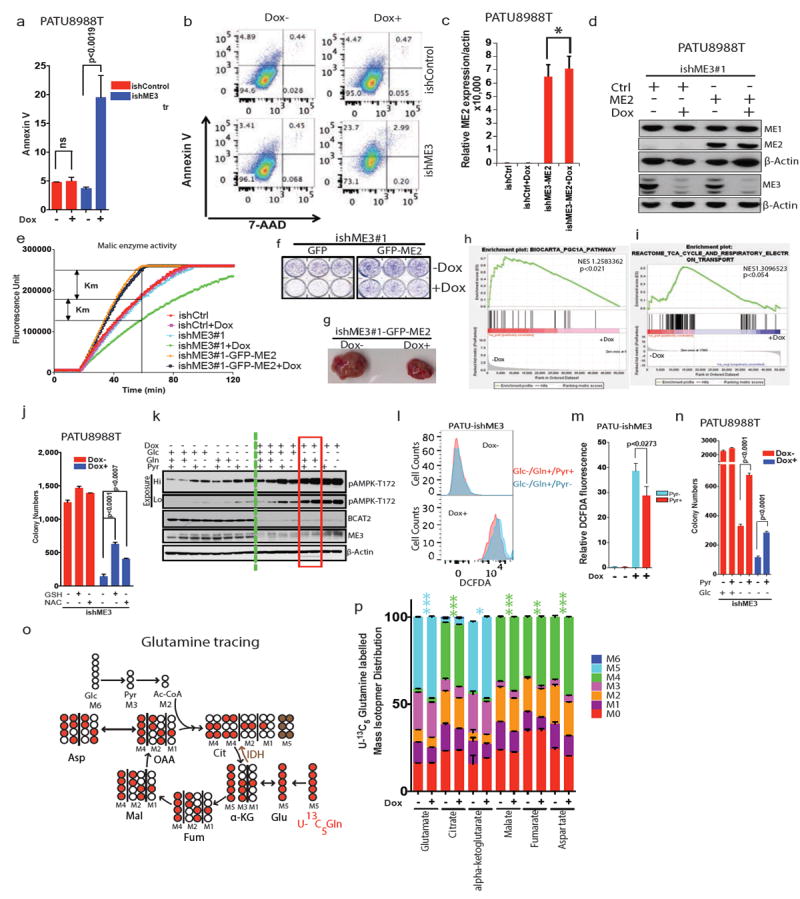
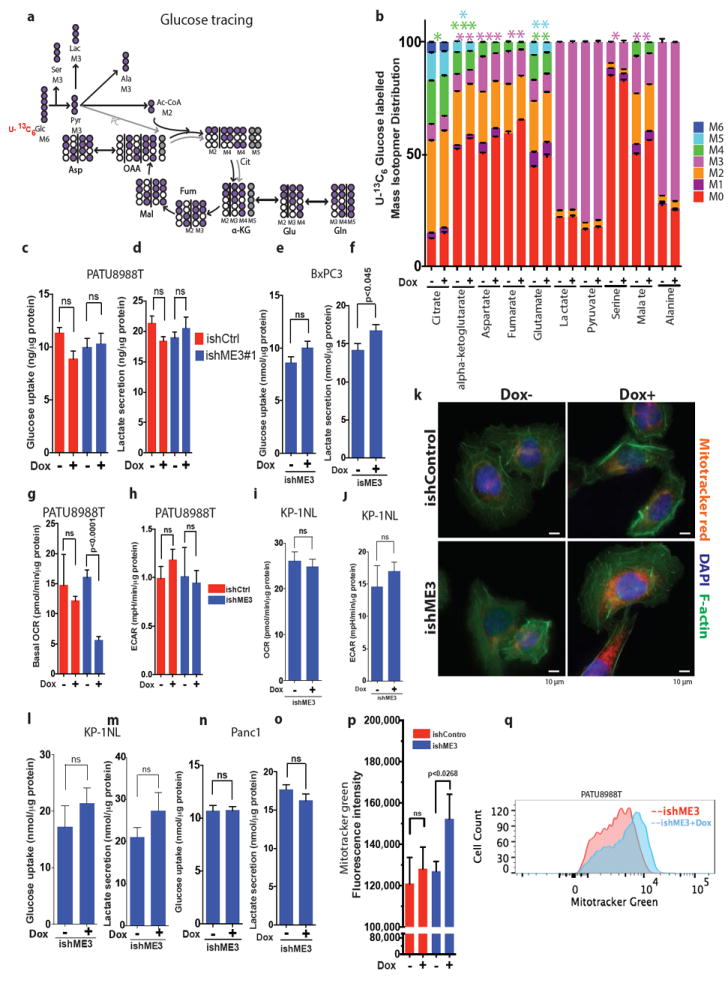
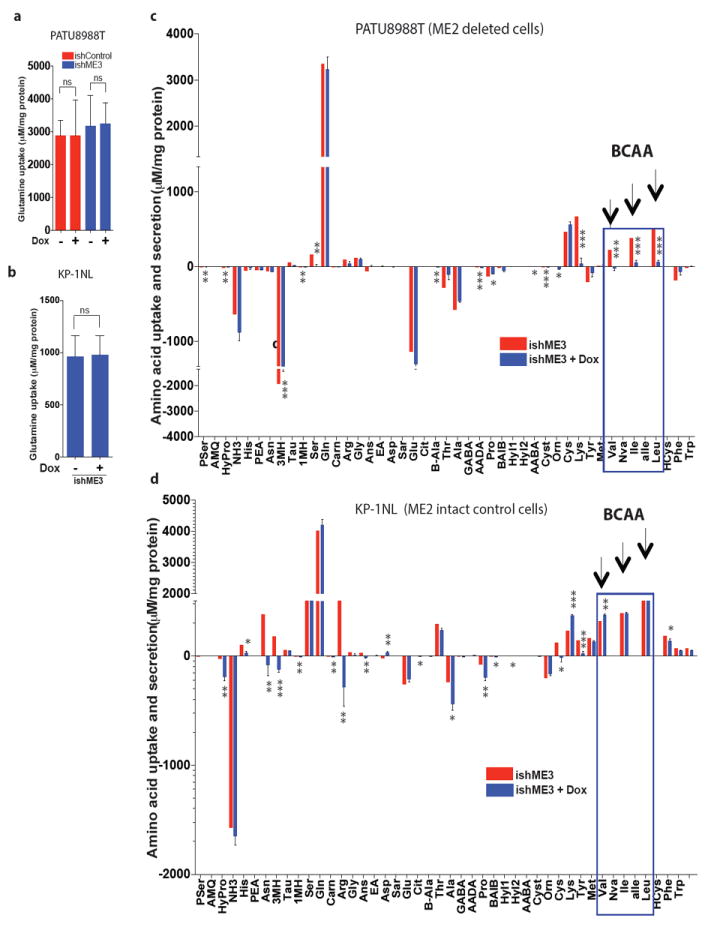
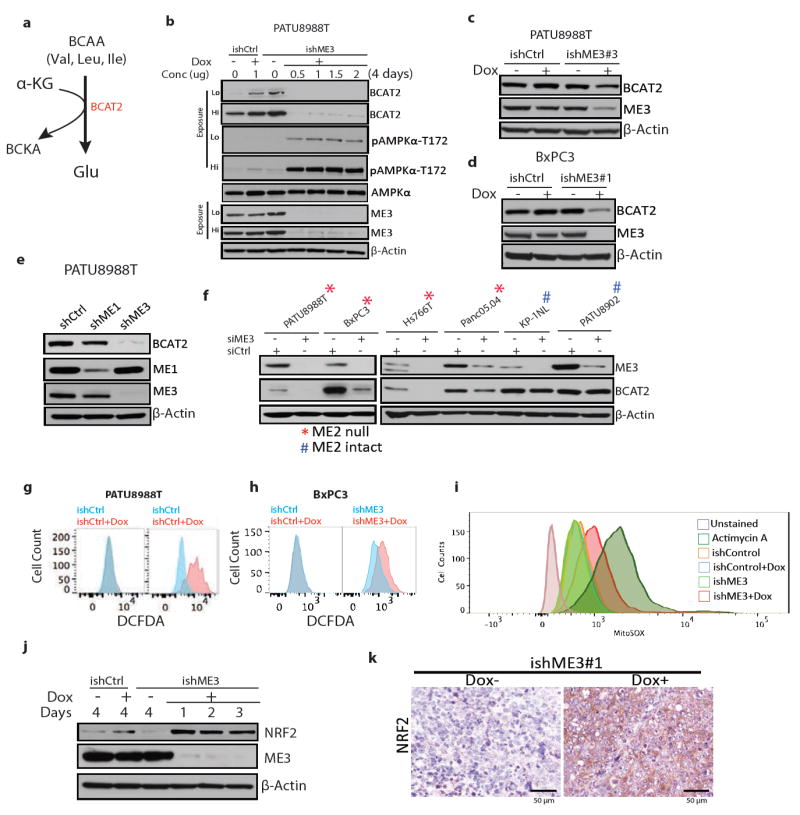
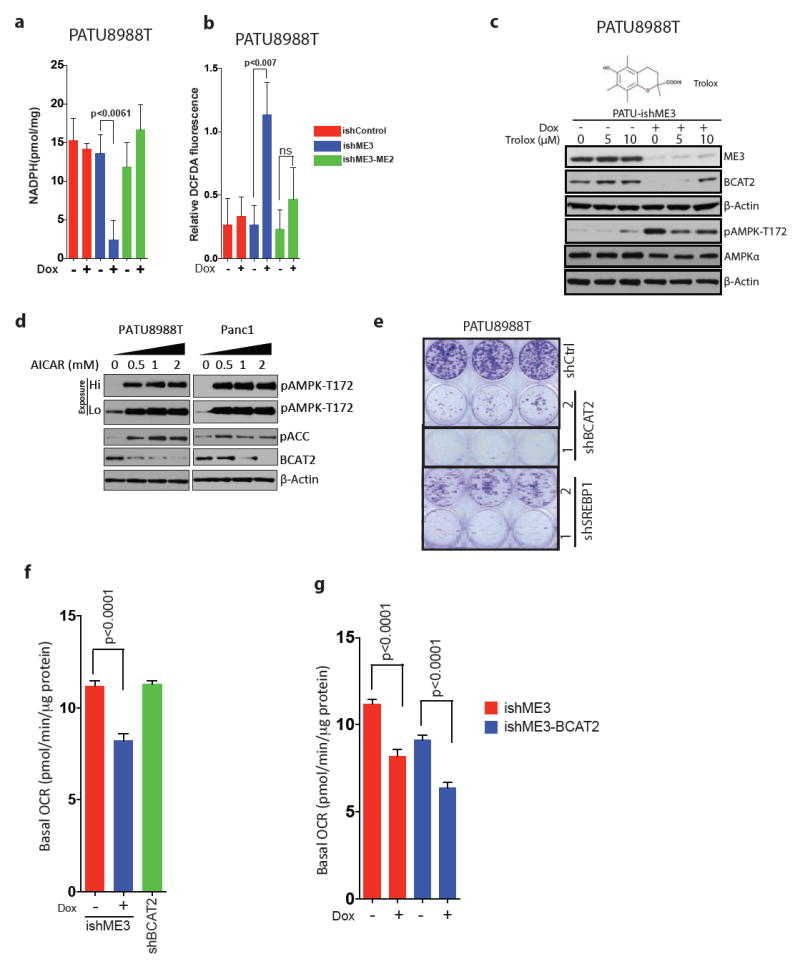
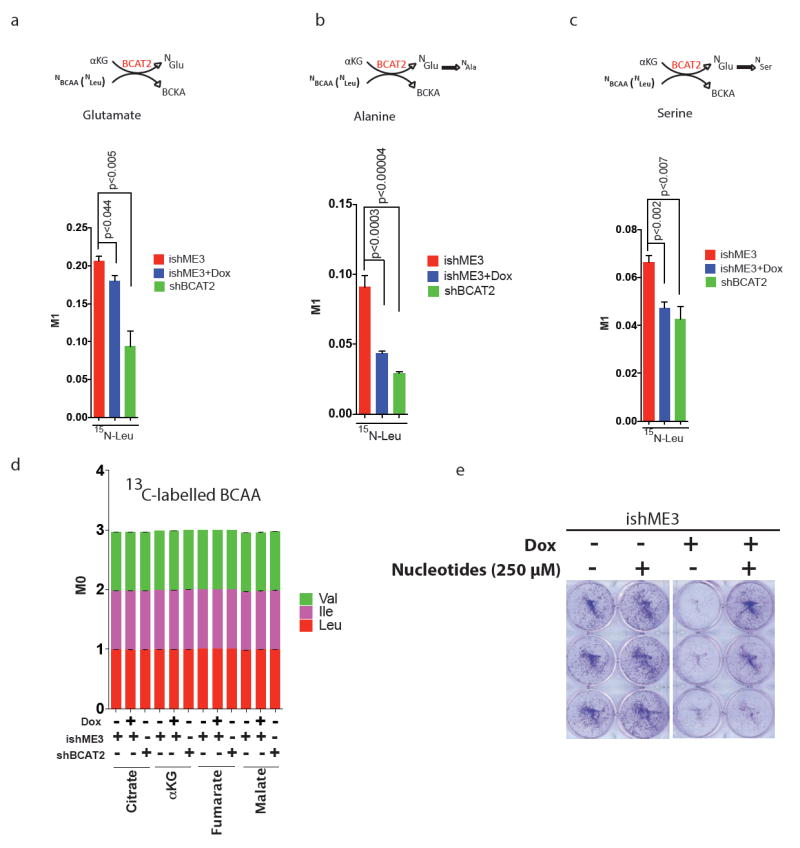
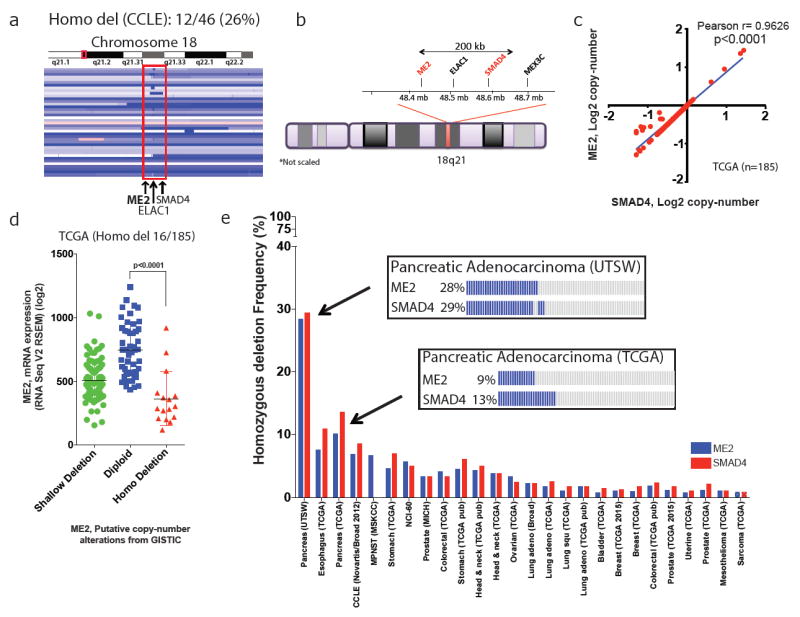
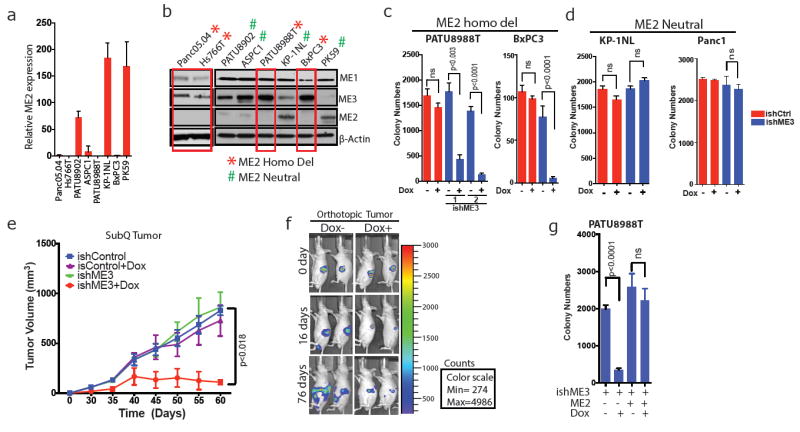
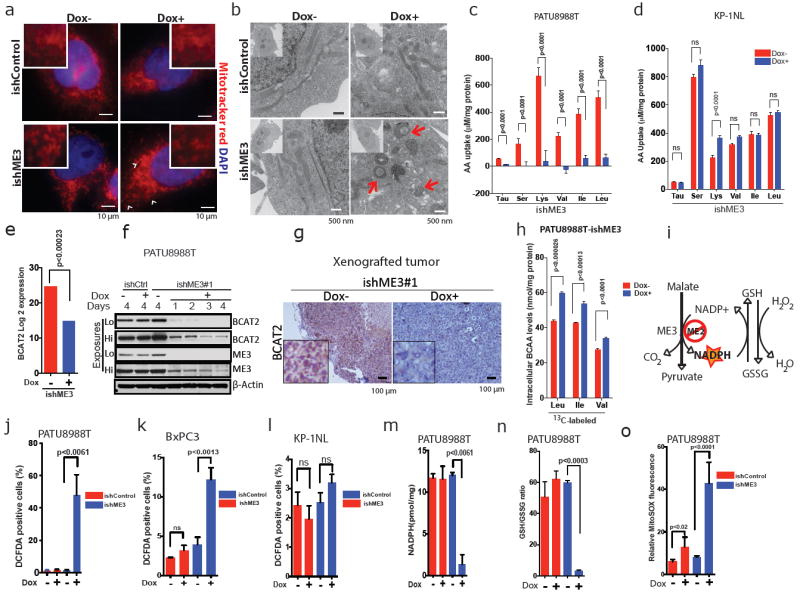
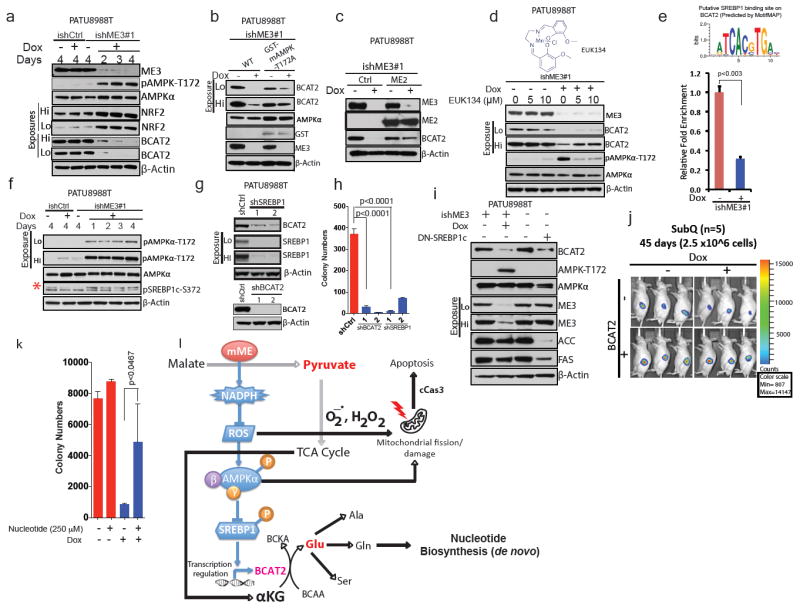
The genome of pancreatic ductal adenocarcinoma (PDAC) frequently contains deletions of tumour suppressor gene loci, most notably SMAD4, which is homozygously deleted in nearly one-third of cases. As loss of neighbouring housekeeping genes can confer collateral lethality, we sought to determine whether loss of the metabolic gene malic enzyme 2 (ME2) in the SMAD4 locus would create cancer-specific metabolic vulnerability upon targeting of its paralogous isoform ME3. The mitochondrial malic enzymes (ME2 and ME3) are oxidative decarboxylases that catalyse the conversion of malate to pyruvate and are essential for NADPH regeneration and reactive oxygen species homeostasis. Here we show that ME3 depletion selectively kills ME2-null PDAC cells in a manner consistent with an essential function for ME3 in ME2-null cancer cells. Mechanistically, integrated metabolomic and molecular investigation of cells deficient in mitochondrial malic enzymes revealed diminished NADPH production and consequent high levels of reactive oxygen species. These changes activate AMP activated protein kinase (AMPK), which in turn directly suppresses sterol regulatory element-binding protein 1 (SREBP1)-directed transcription of its direct targets including the BCAT2 branched-chain amino acid transaminase 2) gene. BCAT2 catalyses the transfer of the amino group from branched-chain amino acids to α-ketoglutarate (α-KG) thereby regenerating glutamate, which functions in part to support de novo nucleotide synthesis. Thus, mitochondrial malic enzyme deficiency, which results in impaired NADPH production, provides a prime 'collateral lethality' therapeutic strategy for the treatment of a substantial fraction of patients diagnosed with this intractable disease.


Conflict of interest statement

The authors declare no competing financial interests.

Figures

Extended Data Fig. 1
Extended Data Fig. 1. ME2 is codeleted with SMAD4 in pancreatic cancer
a, b, Scatterplots of SMAD4 mRNA expression against log2 CNA of all tumour types from CCLE datasets (a; n = 877), and PDAC samples in TCGA (b; n = 149). c, d, Scatterplots of ME2 mRNA expression against log2 CNA of all tumour types from CCLE datasets (c; n = 877) and PDAC samples from CCLE datasets (d; n = 46). e, log2 CNA of ME2 in TCGA PDAC database analysed by Oncomine (n = 131). f, Correlation between mRNA expression of ME2 and SMAD4 in TCGA PDAC database (n = 149). g, CNA of ME2 and SMAD4 in UTSW microdissected PDAC samples (Nature Communication data sets, 2015)7(n = 109) as reported by cBioportal were current in August 2016. h, Representative IHC images of SMAD4 and ME2 expression in PDAC samples compared with a matching normal pancreas sample. i,j, Additional ME2 (i) and SMAD4 (j) IHC images of PDAC samples. Staining is shown as no stain (score 0) and low-to-high staining (score 1). k, IHC analysis of paired normal and PDAC samples (n = 62) for ME2 and SMAD4 expression. Scoring is based on no expression (score 0) and low-to-high expression (score 1).
Extended Data Figure 2
Extended Data Figure 2. ME1 and ME3 are paralogous isoformsof ME2
a, Representative IHC images of ME3 in PDAC samples. Staining is shown as no stain or low-to-high staining. b, IGV image of chromosome 11 encompassing region q14 of PDAC cell lines from CCLE (n = 46). c, ME3 mRNA expression against log2 copy number of PDAC lines from CCLE (n = 46). d, Expression of ME1 upon depletion of ME1 in PATU8988T cells. β-Actin used as loading control. e, Colony-formation assay of cell lines corresponding to the immunoblot in d. f, Quantification of the colony-formation assay in e. g, Representative microscopic fields of PATU8988T shCtrl and shME1#3 cells (Scale bar= 100 μm). h, Expression of ME1 upon depletion of ME1 in KP-1NL cells. i, Colony-formation assay corresponding to the immunoblot in h. j, Quantification of the colony-formation assay in i. k, Representative microscopic fields of KP-1NL shCtrl and shME1#3 cells (Scale bar= 100 μm). l, Colony-formation assay of NHDF-Neo cells (skin fibroblast cell line) (ishCtrl ± dox, ishME1#3 ± dox and NHDF-Neo/ishME3#1 ± dox). β-Actin used as loading control. Error bars represent s.d. of at least n = 3 replicates.
Extended Data Figure 3
Extended Data Figure 3. ME3 depletion in ME2 null cellsleads to growth inhibitiona
Immunoblot showing expression of ME3 upon depletion with three independent Dox-inducible hairpins or non-targeting inducible control hairpin (ishCtrl) in PATU8988T cells. ME1 expression remained unchanged upon ME3 depletion. b, Expression of ME3 following depletion by ishME3#1 and ishCtrl hairpin in BxPC3 cells (ME2-null). c, Immunoblot of KP-1NL cells (ME2-intact) assessing deletion of ME3 expression. d, Immunoblot of Panc1 cells (ME2-intact) assessing deletion of ME3 expression. e, Raw photos of colony-formation assay upon depletion of ME3 in ME2-null PATU8988T cells. f, Malic enzyme activity assay upon depletion of ME3 in PATU8988T cells. g, Representative microscopic field comparing cell growth between ishCtrl ± Dox and ishME3#1 ± Dox cells (Scale bar= 50 μm). h, Growth curve upon ME3 depletion. i, Raw photos of colony-formation assay upon depletion of ME3 in ME2-null BxPC3 cells. j, Raw photo of colony-formation assay upon inducible CRISPR/Cas9 deletion of ME3 in Hs766T cells. k, Inducible CRISPR/Cas9 deletion of ME3 inhibits colony formation in Hs766T cells. l, m, Raw photos of colony formation assay upon depletion of ME3 in ME2-intact (l) KP-1NL and (m) Panc1 cells. n, o, Raw tumour image after 60 days of tumour growth (n) and graph of mean tumour weights (o) (n = 5). p, Immunoblot of ME3-depleted (dox+) and non-depleted (dox–) xenograft tumour samples confirms complete depletion of ME3. Human-specific ME1 antibody did not detect any remaining ME1 protein in dox+ mouse tumours #3 and #4, indicating no remaining human tumour cells (Red asterisk denote the specific band). β-Actin used as loading control. q, Luciferase imaging (IVIS spectrum) of nude mice 79 days after orthotopic transplantation of PATU8988T-ishME3 cells (±dox). r, Survival data for mice (n = 10 each group) orthotopically grafted with PATU8988T cells (ishCtrl ± dox and ishME3#1 ± dox).
Extended Data Figure 4
Extended Data Figure 4. Inhibition of ME3 in ME2 null cells affects tumour growth
a, b, Representative IHC and haematoxylin and eosin-stained images of xenograft tumour samples of PATU8988T ishCtrl ± dox (a) and ishME3 ± dox (b) cells. Arrowheads indicate Ki67-positive cells. c, Top pathways enriched in ME3-depleted xenograft tumours from Ingenuity pathway analysis of RNA-seq data. d, Electron transport cycle (ETC) pathways are enriched in non-ME3-depleted versus ME3-depleted xenograft tumours as analysed by GSEA.
Extended Data Figure 5
Extended Data Figure 5. ME3 depletion in ME2 null cells increases apoptosis
a, Increase in annexin V staining upon ME3 depletion. b, Raw flow cytometric plot of rate of apoptosis using annexin V and propidium iodide staining of PATU8988T cells. c, qRT PCR data showing ME2 (CMV-GFP-ME2) expression in PATU8998T-ishME3#1 cells. d, Immunoblot of overexpression of ME2 in ME3-depleted PATU8988T cells. e, Malic enzyme assay showing the rescue of enzyme activity upon overexpression of ME2 in PATU8998T-ishME3#1 cells. f, Colony-formation assay of cell lines (PATU8998T-ishME3#1-GFP and PATU8998T-ishME3#1-GFP-ME2). g, Representative xenograft tumour photo showing partial rescue of tumour growth upon ME2 overexpression in ME3-depleted cell lines (n = 5, each group). h, GSEA analysis of RNA-seq data showing enrichment of PGC1α signature. i, GSEA analysis of RNA-seq data showing enrichment of TCA cycle signature. j, Colony-formation data for PATU8988T-ishME3 cells rescued with GSH (4 mM) or NAC (4 mM). k, Expression of pAMPK1-T172, BCAT2 and ME3 upon treatment with Glc (10 mM), Gln (2 mM) and/or Pyr (5 mM). l, Raw flow cytometric plot of DCFDA upon rescue with pyruvate (5 mM). m, Relative DCFDA fluorescence upon rescue with pyruvate. n, Colony-formation data for PATU8988T-ishME3 cells rescued with pyruvate (5 mM). o, Mapping of carbon atom transitions using uniformly labelled 13C5-glutamine. p, Mass isotopomer distribution (MID) of uniformly labelled 13C5-glutamine contribution to TCA cycle metabolites. ME3 depletion led to increased glutamine flux into TCA cycle. Error bars represent s.e.m. of n = 4 biological samples from two independent experiments. P values were determined by two-tailed t-test.
Extended Data Figure 6
Extended Data Figure 6. ME3 depletion in ME2 null cells causes mitochondrial dysfunction
a, Mapping of carbon atom transitions using uniformly labelled 13C6-glucose. b, MID of uniformly labelled 13C6-glucose contribution to TCA cycle metabolites. ME3 depletion led to decreased glucose entry to TCA cycle. Error bars represent the s.e.m of n = 4 biological samples from two independent experiments. P values were determined by two-tailed t-test. c–f, Glucose uptake rate and lactate secretion rate were measured in PATU8988T (c, d) and BxPC3 (e, f) cells. g, h, Measurements of oxygen consumption rate (OCR) (g) and extracellular acidification rate (ECAR) (h) in PATU8988T cells upon ME3 depletion. i, j, Measurements of OCR (i) and ECAR (j) in KP-1NL cells upon ME3 depletion. Error bars represent s.e.m. of at least n = 5 replicates. P values were determined by two-tailed t-test. k, MitoTracker red, DAPI and F-actin staining of ME3-depleted (Dox+) and non-depleted (Dox–) cells. l–o, Glucose uptake rate and lactate secretion rate were measured in KP-1NL (l, m) and Panc1 (n, o) cells. p, Quantification of MitoTracker green staining to assess the mitochondrial biomass (Scale bar= 10 μm). q, Representative flow cytometry data of MitoTracker green staining of ME3-depleted (+Dox) versus. non-depleted cells. Error bars represent s.e.m. of at least n = 5 replicates. P values were determined by two-tailed t-test.
Extended Data Figure 7
Extended Data Figure 7. ME affects branched chain amino acids metabolism
a, b,Glutamine uptake rate measured in PATU8988T (a) and KP-1NL (b) cells upon ME3 depletion. c, d, Measurement of amino acid uptake and secretion rates in PATU8988T (c) and KP-1NL (d) cells upon ME3 depletion. Positive values refer to amino acid uptake; negative values refer to secretion. Error bars represent s.e.m. of n = 6 biological samples (PATU8988T and KP-1NL). P values were determined by two-tailed t-test.
Extended Data Figure 8
Extended Data Figure 8. ME regulates BCAT2 via a ROS mediated pathway
a, Schematic of the first enzymatic step of BCAA catabolism to branched chain ketoacid (BCKA). b, Time course of expression of BCAT2, ME3, pAMPKα-T172 and total AMPK following ME3 depletion in PATU8988T cells. c, Expression of BCAT2 and ME3 in cells treated with another independent ishRNA (ishME3#3). d, Expression of BCAT2 and ME3 in BxPC3 cells. e, Expression of BCAT2 and ME3 upon depletion of ME1 and ME3 using independent (non-dox dependent) shRNAs. f, Expression of ME3 and BCAT2 upon siRNA depletion of ME3 in PDAC lines. β-Actin used as loading control. g, h, Raw flow cytometry data of DCFDA-stained cells for measurement of ROS in PATU8988T (g) and BxPC3 (h) cells upon ME3 depletion. i, Raw flow cytometry data of MitoSOX staining in PATU8988T and ME3-depleted PATU8988T cells. Antimycin A used as positive control. j, Immunoblot showing time course of expression of NRF2 in cells with dox-induced ME3 depletion. β-Actin used as loading control. k, IHC images showing NRF2 staining in ME3-depleted and control xenograft tumours (Scale bar= 50μm).
Extended Data Figure 9
Extended Data Figure 9. Increase in ROS activates AMPK pathway
a, b, Measurement of NADPH (a) and total ROS (b) in ME2-rescued and ME3-depleted PATU8988T cells. Error bars represent s.d. of at least n = 5 replicates. c, Immunoblot of ME3, BCAT2 and AMPK expression upon depletion of ME3 followed by Trolox treatment for 24 h. Structure of Trolox (above), a synthetic vitamin E analogue that acts as a potent antioxidant. d, Expression of BCAT2 in PATU8988T and Panc1 cells upon treatment with AICAR for 14 h. e, Colony-formation assay showing decreased cell growth upon shRNA-mediated depletion of BCAT2 and SREBP1 using two independent shRNAs. Error bars represent s.d. of at least n = 3 replicates.f, OCR in cells depleted of BCAT2 by shRNA. g, OCR in cells upon overexpression of BCAT2. Error bars represent s.e.m of at least n = 5 replicates. P values were determined by two-tailed t-test.
Extended Data Figure 10
Extended Data Figure 10. BCAAs contribution to nucleotide synthesis
a–c, MID of 15N-labelled BCAA (Leu) contribution to glutamate (a), alanine (b), and serine (c). d, Plot of 13C-labelled BCAAs contribution to TCA cycle metabolites. Error bars represent s.e.m. of n = 4 biological samples from two independent experiments. P values were determined by two-tailed t-test. e, Colony formation assay of cells treated with nucleotides (mix of thymine, guanine, cytosine, uracil, and inosine, 250 μM each) showing rescue of ME3-depleted PATU8988T cells. Error bars represent s.d. of n = 3 biological samples from two independent experiments. P values were determined by two-tailed t-test.
Figure 1
Figure 1. ME2 is a passenger deletion in patients with PDAC
a, Interactive genome viewer (IGV) image of chromosome 18 encompassing region q21 of PDAC cell lines from CCLE data set. Twelve of 46 PDAC samples had homozygous deletion of ME2. b, Ideogram of chromosome 18 showing close proximity (<200 kb) of ME2 to SMAD4. c, Correlation of copy-number alterations (CNA) between SMAD4 and ME2 in PDAC samples. d, ME2 deletion events in PDAC samples (TCGA) showing a correlation between CNA and mRNA expression. Homozygous deletion in 16 of 185 samples. e, Frequency of ME2 and SMAD4 deletion in multiple solid tumours (cBioportal). Boxes detail ME2 and SMAD4 deletion frequency from UTSW and TCGA PDAC datasets. adeno, adenocarcinoma; DLBC, Diffuse large B-cell lymphoma; MPNST, Malignant Peripheral Nerve Sheath Tumors; NEPC, Neuroedocrine prostate cancer.
Figure 2
Figure 2. Depletion of ME3 leads to collateral lethality in ME2-null PDAC cells
a, Relative ME2 mRNA expression determined by qRT–PCR in ME2-null and ME2-intact PDAC cell lines. b, Immunoblots of ME1, ME2 and ME3 expression in ME2-null (red boxes) and ME2-intact PDAC cell lines. β-Actin used as loading control. c, d, Quantification of colony formation assay of ME2-null PATU8988T and BxPC3 cell lines (c) and ME2-intact KP-1NL and Panc1 cell lines (d) upon ME3 depletion by addition of dox to cells expressing control ishRNA (ishCtrl) or ishRNA targeting ME3 (ishME3). e, Tumour volume progression of xenografted subcutaneous PATU8988T (ishCtrl ± dox and ishME3 ± dox) cells (n=5, each group). Colour scale, minimum 274, maximum 4,986. f, Representative luciferase imaging of orthotopic PDAC tumours in nude mice with and without dox (n = 5, each group). g, Colony formation of PATU8988T cells rescued by overexpression of ME2. All error bars represent s.d. of at least three replicates. P values determined by two-tailed t-test.
Figure 3
Figure 3. ME3 depletion in ME2-null PDAC cells leads to mitochondrial defects
a, MitoTracker red staining in PATU8988T cells (arrow-head shows mitochondrial fission). Scale bar = 10 μm. b, TEM showing aberrant ring-shaped mitochondria (arrows in bottom right). Scale bar = 500 nm. c, d, Measurement of BCAA uptake in PATU8988T (c) and KP-1NL cells (d) (n = 6 each). Error bars represent the s.e.m.e, Log2 expression data of BCAA transaminase 2 (BCAT2) from RNA-seq data. f, Immunoblot of BCAT2 expression time course upon depletion of ME3. β-Actin used as loading control. g, Representative IHC images of BCAT2 in xenograft tumours. Scale bar = 100 μm. h, Plot of intracellular levels of BCAAs in ME3-depleted PATU8988T cells (n = 4). Error bars represent the s.e.m. i, Overview of malic enzyme reaction. J–l, Measurement of total ROS (as 2′,7′-dichlorofluorescin diacetate (DCFDA)-positive cells) in PATU8988T (j), BxPC3 (k) and KP-1NL (l) cells (n = 5 each). m, Measurement of NADPH in PATU8988T cells. n, Measurement of GSH/GSSG ratio in PATU8988T cells. o, Measurement of mitochondria-specific ROS (mitoSOX red) in PATU8988T cells. All error bars represent the s.d. except wherever mentioned otherwise. of at least three replicates from two independent experiments. P values were determined by two-tailed t-test.
Figure 4
Figure 4. ME3 regulates BCAT2 expression via AMPK and its downstream effectors
a, Immunoblot assessing activation of AMPK and expression of NRF2 in PATU8988T cells. β-Actin used as loading control. (b) Immunoblot showing rescue of BCAT2 expression using GST-tagged kinase-dead AMPK (T172A) in PATU8988T cells. c, Immunoblot showing rescue of BCAT2 expression by ME2 in PATU8988T cells. d, Immunoblot showing rescue of BCAT2 expression by 24-h treatment with EUK134. e, Top, putative SREBP1-binding site on BCAT2 promoter predicted by MotifMAP. Bottom, chromatin immunoprecipitation (ChIP) analysis of SREBP1 binding to BCAT2 promoter. f, Immunoblot of SREBP1c phosphorylation at S372 in PATU8988T cells (Red asterisk denote the specific band). g, Immunoblot of BCAT2 expression upon shRNA-mediated depletion of SREBP1 (top) and BCAT2 (bottom) in PATU8988T cells. h, Colony formation assay of cells depleted in BCAT2 (shBCAT2) or SREBP1 (shSREBP1). i, Immunoblot assessing BCAT2 expression in PATU8988T cells expressing DN-SREBP1c (Y320A). j, Luciferase images of BCAT2-overexpressing subcutaneous tumours (n = 5 each group) 45 days after implantation of 2.5 × 10⁶ cells. Colour scale, minimum 807, maximum 14,147. k, Rescue of ME3-depleted cells by addition of nucleotides. l, Proposed model of mitochondrial malic enzyme (mME) function. β-Actin used as loading control in all immunoblots. Error bars represent s.d. of at least three replicates. P values determined by two-tailed t-test.

Comment in

  • Cancer: Double trouble for tumours.
    Biffi G, Tuveson DA. Biffi G, et al. Nature. 2017 Feb 2;542(7639):34-35. doi: 10.1038/nature21117. Epub 2017 Jan 18. Nature. 2017. PMID: 28099410 No abstract available.

References

    1. Bardeesy N, et al. Smad4 is dispensable for normal pancreas development yet critical inprogression and tumor biology of pancreas cancer. Genes Dev. 2006;20:3130–3146. - PMC - PubMed
    1. Pongratz RL, Kibbey RG, Shulman GI, Cline GW. Cytosolic andmitochondrial malic enzyme isoforms differentially control insulin secretion. J Biol Chem. 2007;282:200–207. - PubMed
    1. Jiang P, Du W, Mancuso A, Wellen KE, Yang X. Reciprocal regulation of p53 and malic enzymes modulates metabolism and senescence. Nature. 2013;493:689–693. - PMC - PubMed
    1. Hutson SM, Fenstermacher D, Mahar C. Role of mitochondrial transamination in branched chain amino acid metabolism. J Biol Chem. 1988;263:3618–3625. - PubMed
    1. Muller FL, Aquilanti EA, DePinho RA. Collateral lethality: a new therapeutic strategy in oncology. Trends Cancer. 2015;1173:161. - PMC - PubMed

MeSH terms