. 2017 Jan 16;50(1):e5492.
doi: 10.1590/1414-431X20165492.

A simple and efficient method for poly-3-hydroxybutyrate quantification in diazotrophic bacteria within 5 minutes using flow cytometry

Affiliations

A simple and efficient method for poly-3-hydroxybutyrate quantification in diazotrophic bacteria within 5 minutes using flow cytometry

L P S Alves et al. Braz J Med Biol Res. .

Abstract

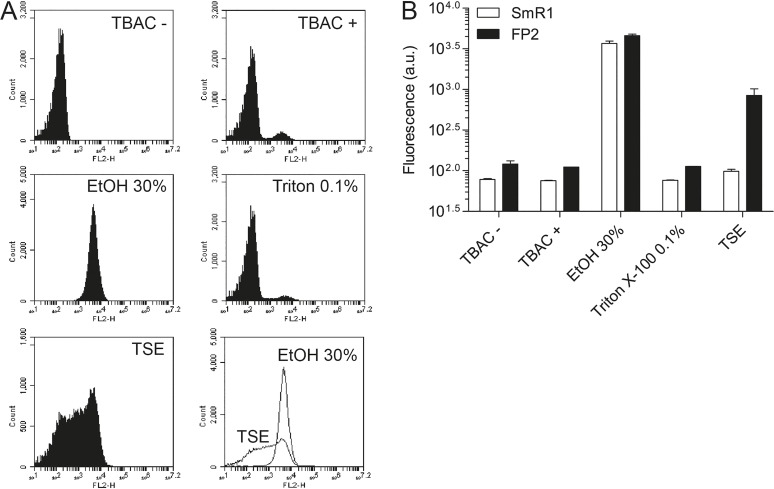
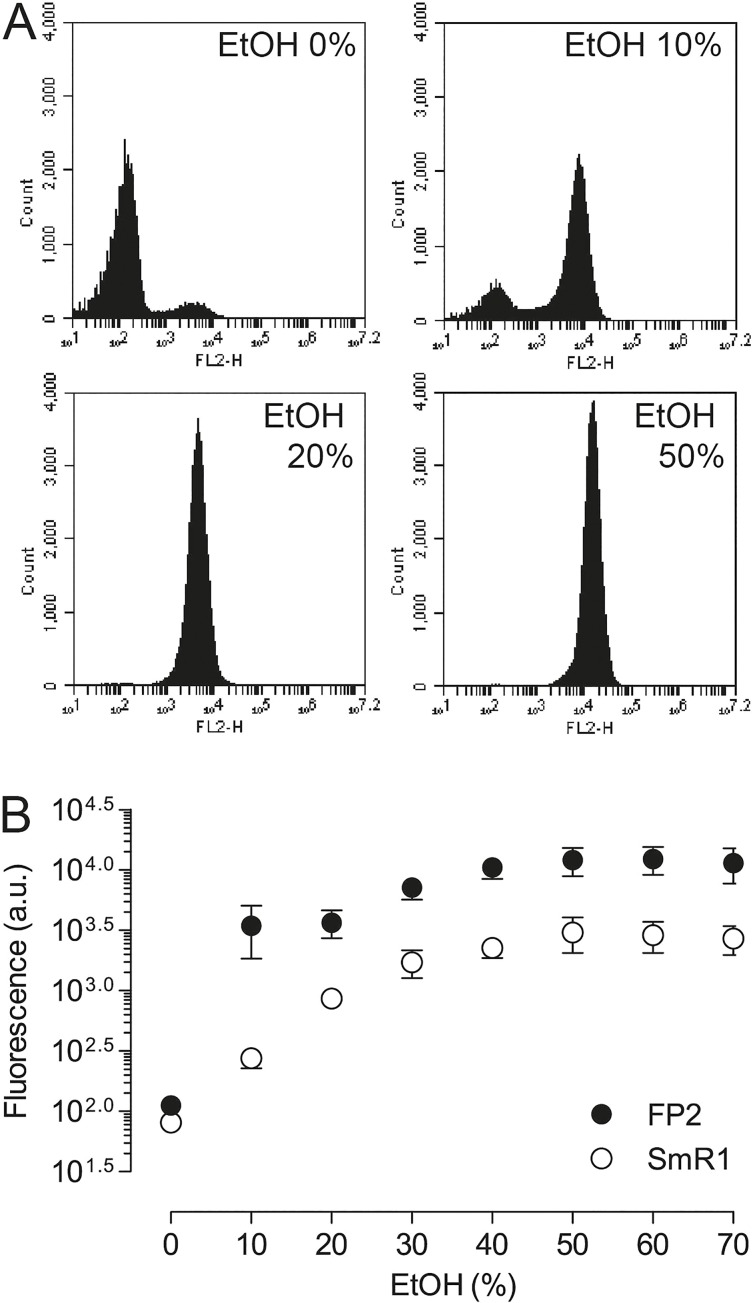
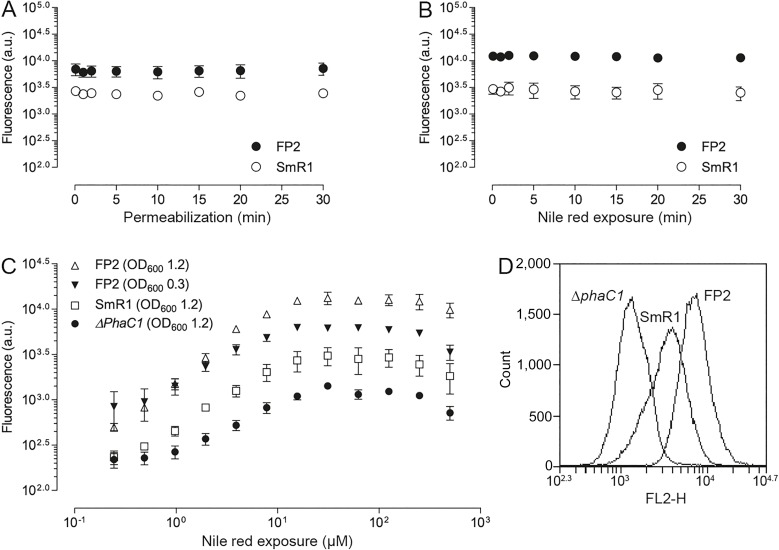
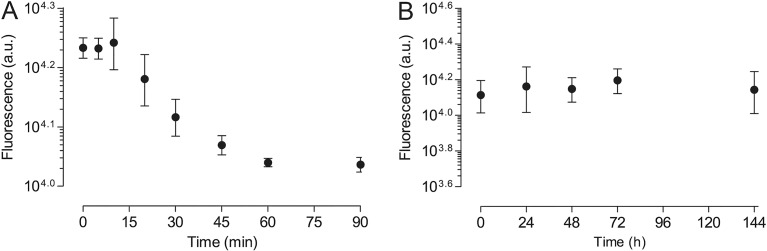
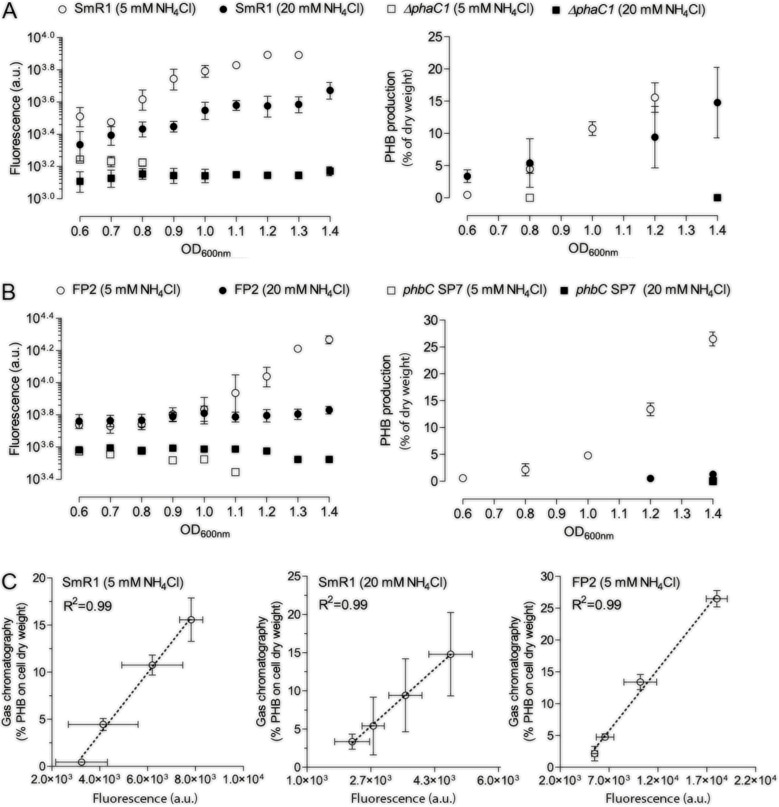
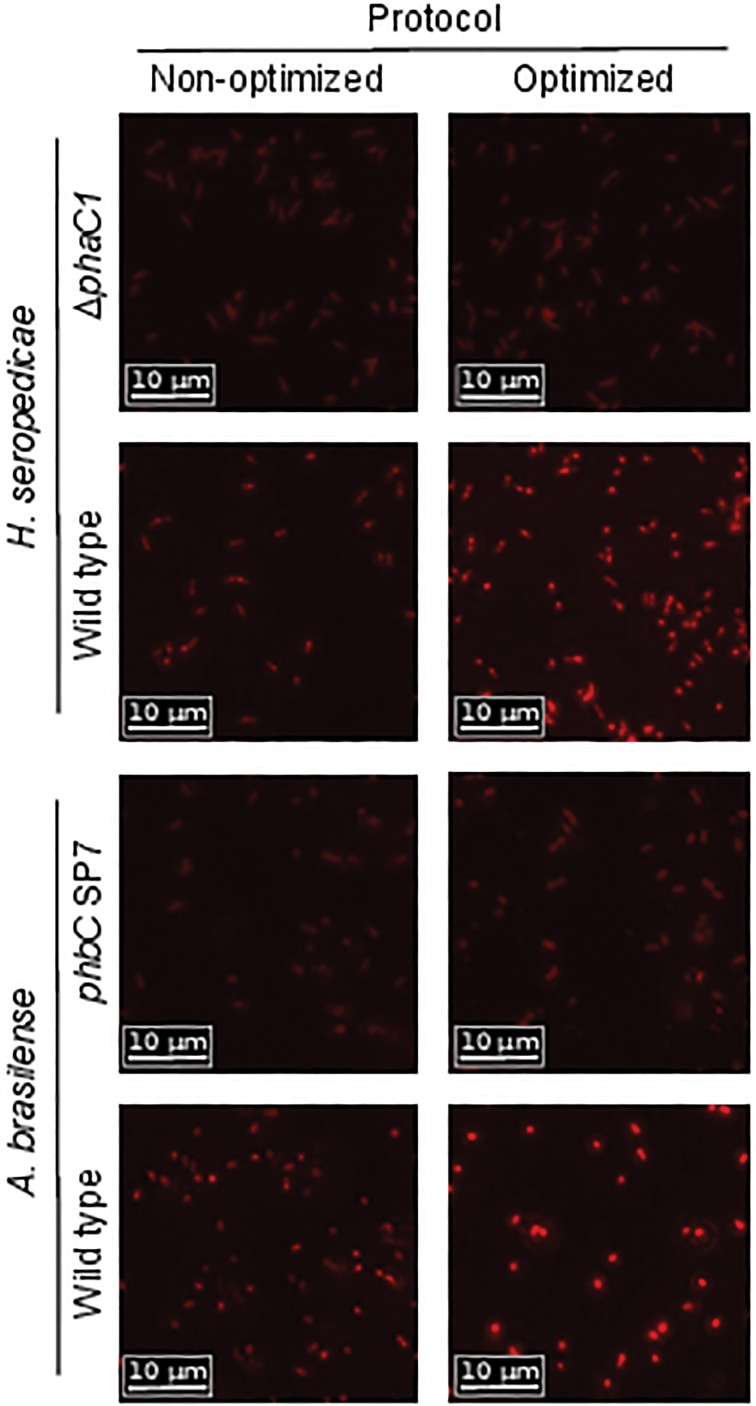
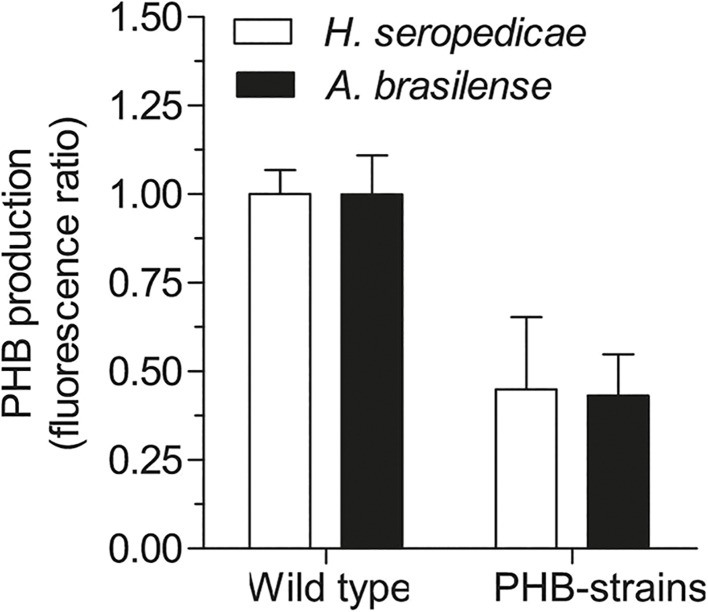
The conventional method for quantification of polyhydroxyalkanoates based on whole-cell methanolysis and gas chromatography (GC) is laborious and time-consuming. In this work, a method based on flow cytometry of Nile red stained bacterial cells was established to quantify poly-3-hydroxybutyrate (PHB) production by the diazotrophic and plant-associated bacteria, Herbaspirillum seropedicae and Azospirillum brasilense. The method consists of three steps: i) cell permeabilization, ii) Nile red staining, and iii) analysis by flow cytometry. The method was optimized step-by-step and can be carried out in less than 5 min. The final results indicated a high correlation coefficient (R2=0.99) compared to a standard method based on methanolysis and GC. This method was successfully applied to the quantification of PHB in epiphytic bacteria isolated from rice roots.


Figures

Figure 1
Figure 1. Screening for cell permeabilization solutions. Bacteria were grown at an OD600 of 1.2, 0.1 mL was centrifuged (1 min at 13,400 g), and resuspended in 1 mL of each solution evaluated. The bacterial suspensions were stained with NR (9.42 µM) during 5 min, and analyzed by flow cytometry. A, Histograms are representative of A. brasilense strain FP2. Conditions: TBAC- corresponds to Nile red (NR) non-stained samples, used as a blank. All other samples were stained with NR. TBAC+ corresponds to non-permeabilized samples in TBAC. EtOH 30% corresponds to samples in TBAC containing 30% of ethanol. Triton 0.1% corresponds to samples in TBAC containing 0.1% of Triton X-100. TSE corresponds to samples in TSE buffer. TSE/EtOH 30% corresponds to overlay of two histograms, TSE and EtOH 30%, respectively. B, Fluorescence data (arbitrary units, a.u.) are reported as means±SD of 3 independent experiments with H. seropedicae strain SmR1 and A. brasilense strain FP2, by using the median fluorescence intensity values in the FL2-H channel.
Figure 2
Figure 2. Optimization of ethanol (EtOH) percentage in TBAC buffer for cell permeabilization. Bacteria were grown at an OD600 of 1.2, 0.1 mL was centrifuged (1 min at 13,400 g), and resuspended in 1 mL of TBAC buffer containing different percentages of EtOH (0-70%). After 5 min of EtOH exposure, cells were stained with Nile red (9.42 µM) during 5 min, centrifuged (1 min at 13,400 g), and resuspended in TBAC buffer for analysis by flow cytometry. A, Histograms are representative of A. brasilense strain FP2 using different percentages of EtOH in TBAC buffer, as indicated. B, Fluorescence data (arbitrary units, a.u.) are reported as means±SD of 3 independent experiments with H. seropedicae strain SmR1 and A. brasilense strain FP2, by using the median fluorescence intensity values in the FL2-H channel.
Figure 3
Figure 3. Incubation time required for cell permeabilization and Nile red (NR) staining. Bacteria were grown at an OD600 of 1.2, 0.1 mL was centrifuged (1 min at 13,400 g), and resuspended in 1 mL of TBAC buffer containing 50% of EtOH. A, Exposure with EtOH during 0 to 30 min and cells stained with NR (9.42 µM). B, After 1 min of exposure in TBAC buffer containing 50% of EtOH, the bacterial suspensions were incubated with NR (9.42 µM) during 0 to 30 min. C, After 1 min of exposure of cells in TBAC buffer containing 50% of EtOH, the bacterial suspensions were stained with NR (0 to 500 µM) during 1 min, centrifuged (1 min at 13,400 g), and resuspended in TBAC buffer for analysis by flow cytometry. Fluorescence data (arbitrary units, a.u.) are reported as means±SD of 3 independent experiments with H. seropedicae strain SmR1 and A. brasilense strain FP2, by using the median fluorescence intensity values in the FL2-H channel. D, Histogram overlay of three samples, a mutant strain of H. seropedicae, ΔphaC1, H. seropedicae strain SmR1, and A. brasilense strain FP2, using the optimized concentration of NR (31.25 µM).
Figure 4
Figure 4. Nile red (NR) fluorescence stability. A. brasilense strain FP2 was grown until reaching OD600 of 1.4. PHB measurements were performed using the optimized procedure, as described in the Materials and Methods. A, After resuspension of cells in TBAC buffer, NR fluorescence was monitored during 90 min by flow cytometry. B, Samples were stored at 4°C in permeabilization solution (TBAC buffer containing 50% of EtOH), until analysis, as indicated. For analysis, samples were stained with NR (31.25 µM) during 1 min, centrifuged (1 min at 13,400 g), resuspended in TBAC buffer and analyzed immediately by flow cytometry. Fluorescence data (arbitrary units, a.u.) are reported as means±SD of 3 independent experiments with H. seropedicae strain SmR1 and A. brasilense strain FP2, by using the median fluorescence intensity values in the FL2-H channel.
Figure 5
Figure 5. Correlation between flow cytometry and gas chromatography (GC) analysis for PHB quantification. PHB measurements by flow cytometry using the optimized procedure and the standard method based on GC were applied on H. seropedicae strain SmR1, a mutant strain of H. seropedicae, ΔphaC1, A. brasilense strain FP2, and a mutant strain of A. brasilense, phbC SP7, OD600 ranging from 0.6 to 1.4 using two NH4Cl concentrations in growth medium, as indicated. A, H. seropedicae. B, A. brasilense. C, Correlation between flow cytometry and GC. Fluorescence data (arbitrary units, a.u.) are reported as means±SD of 3 independent experiments with H. seropedicae strain SmR1 and A. brasilense strain FP2, by using the median fluorescence intensity values in the FL2-H channel.
Figure 6
Figure 6. Intracellular PHB detection by fluorescence microscopy using the non-optimized and optimized protocols. H. seropedicae strain SmR1, a mutant strain of H. seropedicae, ΔphaC1, A. brasilense strain FP2, and a mutant strain of A. brasilense, phbC SP7 were grown to OD600 of 1.4 using 5 mM NH4Cl in growth medium. Fluorescence microscopy analysis was performed using the procedure described in the Material and Methods.
Figure 7
Figure 7. PHB production of epiphytic bacteria analyzed by flow cytometry. PHB measurements were performed using the optimized procedure on rice epiphytic H. seropedicae strain SmR1, a mutant strain of H. seropedicae, ΔphaC1, A. brasilense strain FP2, and a mutant strain of A. brasilense, phbC SP7, 7 days after inoculation, as described in the Material and Methods. Fluorescence ratio data are reported as means±SD of 2 independent experiments performed in triplicate, using the median fluorescence intensity values in the FL2-H channel.

References

    1. Urtuvia V, Villegas P, Gonzalez M, Seeger M. Bacterial production of the biodegradable plastics polyhydroxyalkanoates. Int J Biol Macromol. 2014;70:208–213. doi: 10.1016/j.ijbiomac.2014.06.001. - DOI - PubMed
    1. Jendrossek D, Pfeiffer D. New insights in the formation of polyhydroxyalkanoate granules (carbonosomes) and novel functions of poly(3-hydroxybutyrate) Environ Microbiol. 2014;16:2357–2373. doi: 10.1111/1462-2920.12356. - DOI - PubMed
    1. Khanna S, Srivastava AK. Recent advances in microbial polyhydroxyalkanoates. Process Biochem. 2005;40:607–619. doi: 10.1016/j.procbio.2004.01.053. - DOI
    1. Karr DB, Waters JK, Emerich DW. Analysis of poly-β-hydroxybutyrate in Rhizobium japonicum bacteroids by ion-exclusion high-pressure liquid chromatography and UV detection. Appl Environ Microbiol. 1983;46:1339–1344. - PMC - PubMed
    1. Gorenflo V, Steinbuchel A, Marose S, Rieseberg M, Scheper T. Quantification of bacterial polyhydroxyalkanoic acids by Nile red staining. Appl Microbiol Biotechnol. 1999;51:765–772. doi: 10.1007/s002530051460. - DOI - PubMed

MeSH terms